Copyright
©The Author(s) 2024.
World J Radiol. Sep 28, 2024; 16(9): 446-452
Published online Sep 28, 2024. doi: 10.4329/wjr.v16.i9.446
Published online Sep 28, 2024. doi: 10.4329/wjr.v16.i9.446
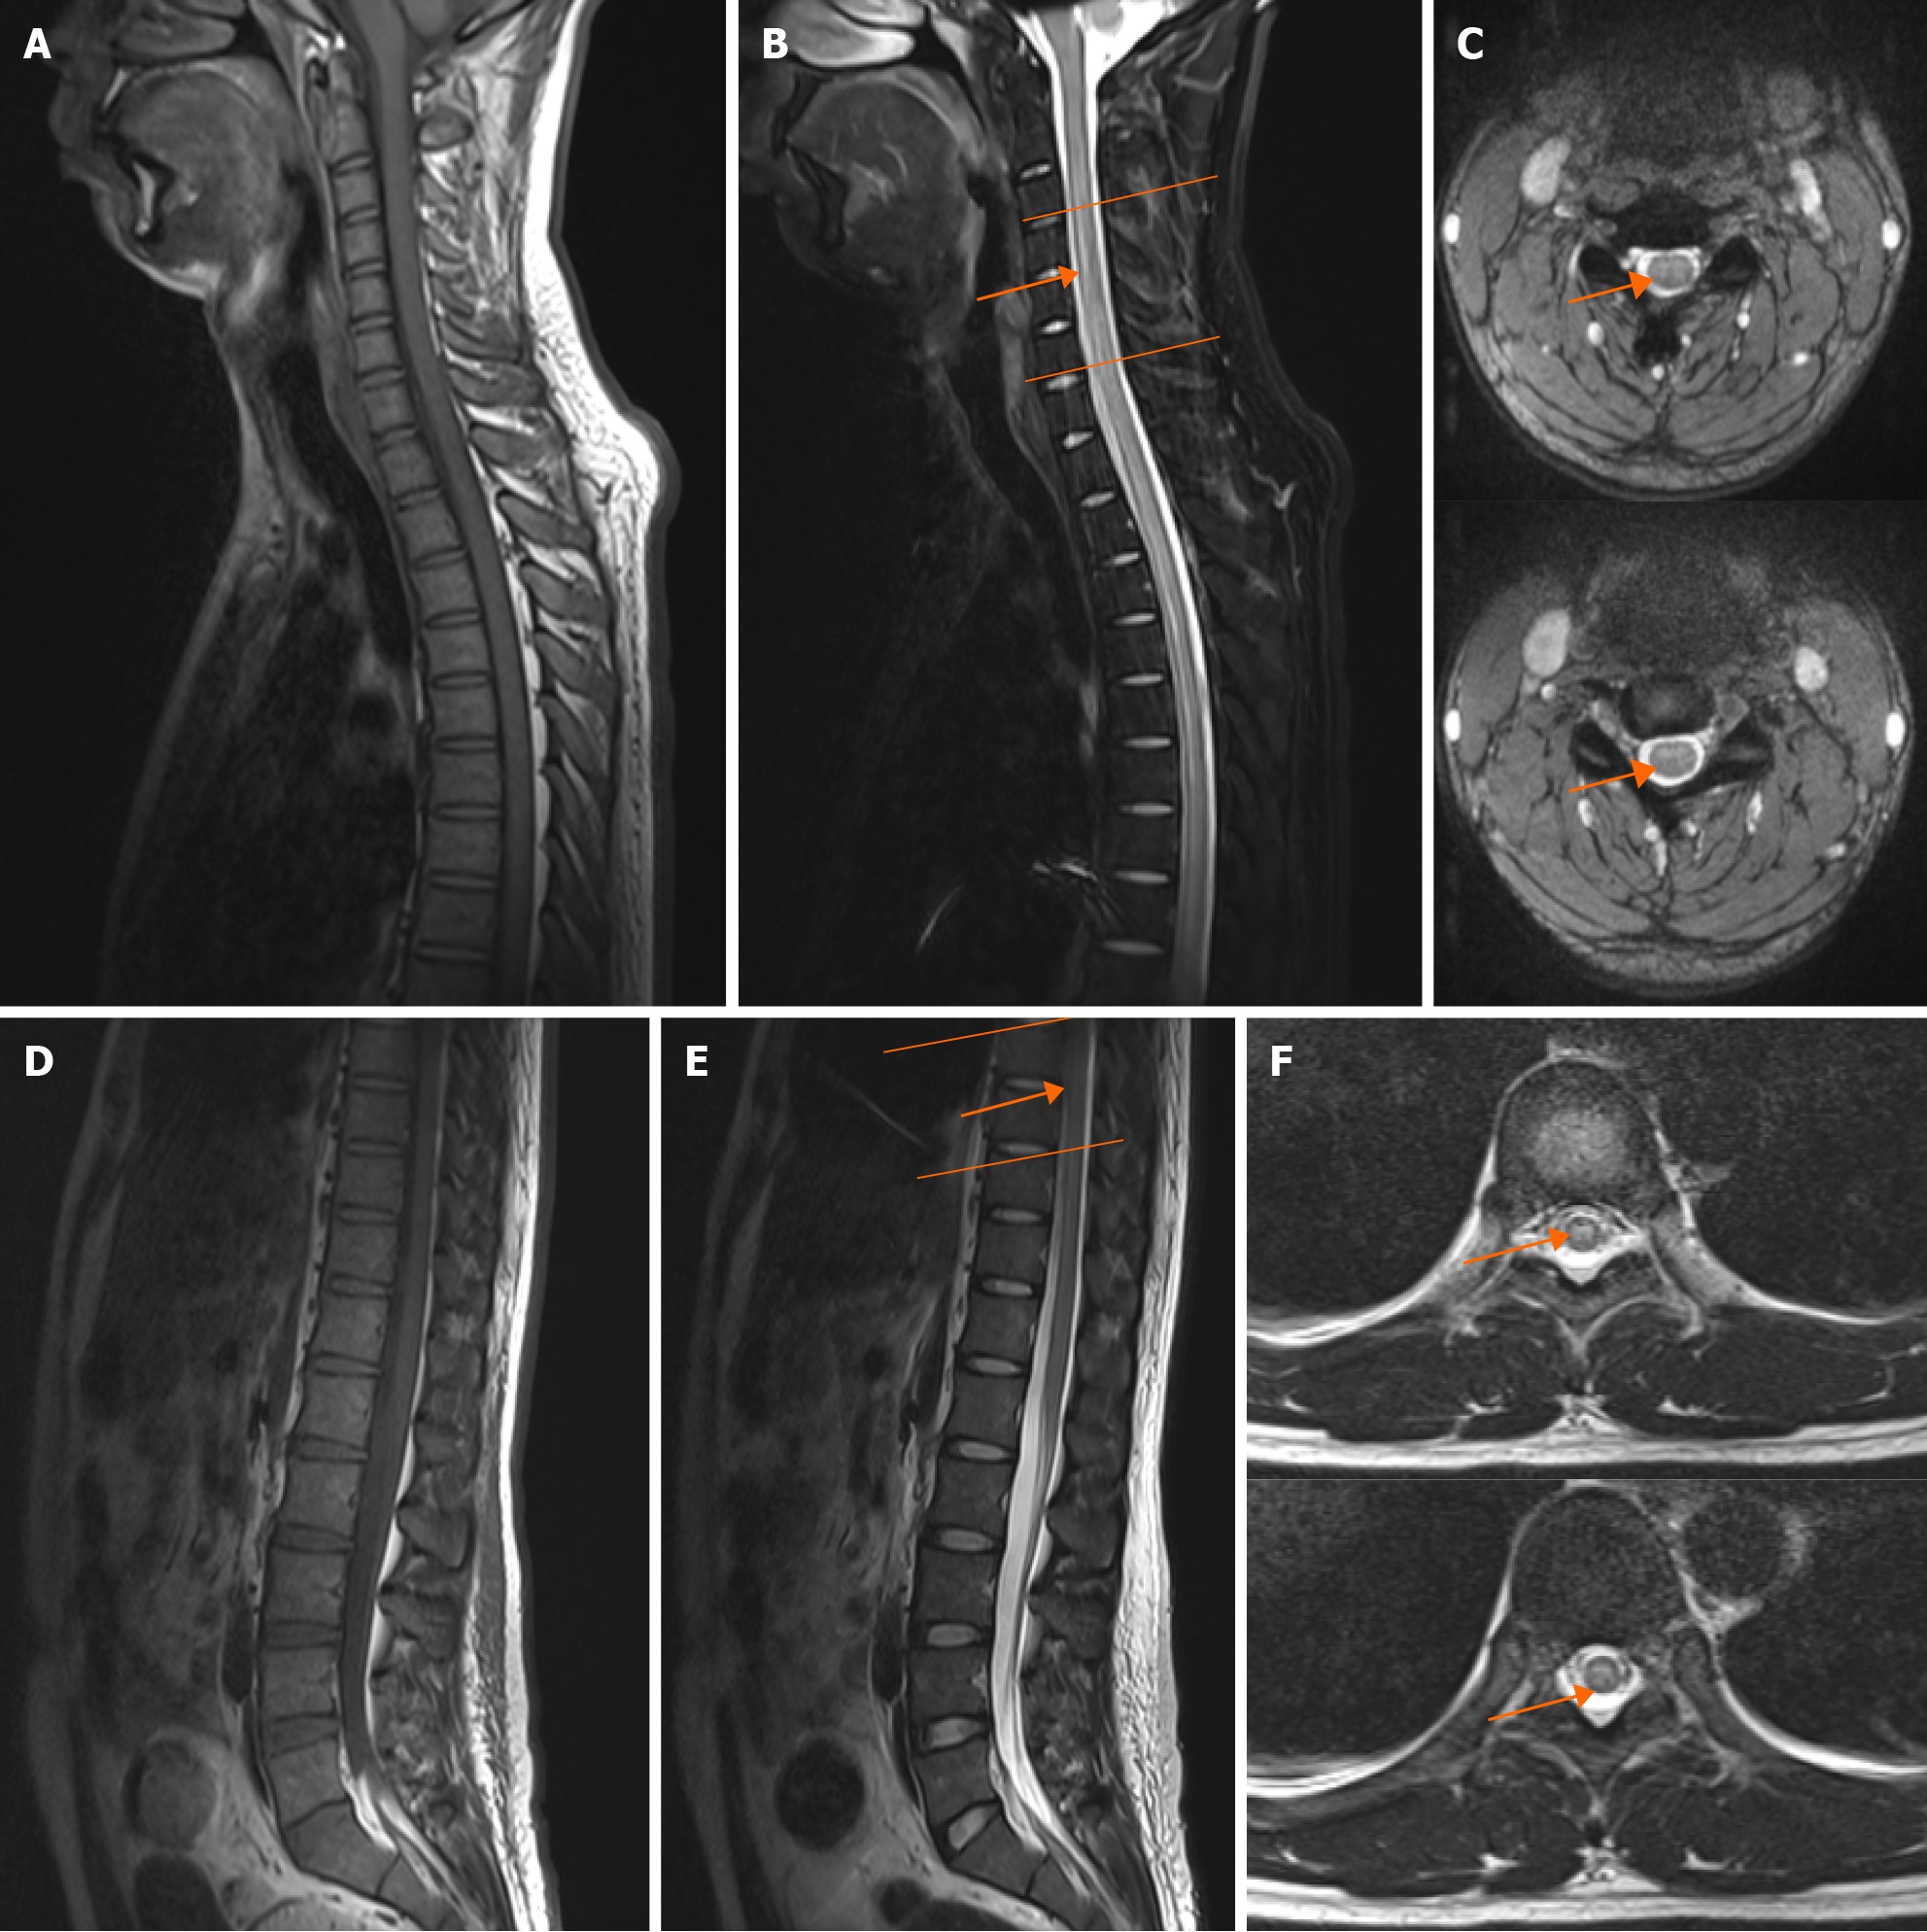
Figure 1 A magnetic resonance imaging scan of the thoracic spinal cord of the patient before treatment.
A: Sagittal T1WI sequence of the cervical spine; B: The sagittal T2WI-FS sequence of the cervical spine shows hyperintensity in the long central segment of the spinal cord C3-C6 (arrow); C: Axial T2WI sequence of the cervical spine shows hyperintensity in the central spinal cord at the C3-C6 level (arrow); D: Sagittal T1WI sequence of the lumbar spine; E: Sagittal T2WI sequence of the lumbar spine shows hyperintensity from the central long segment of the T7-T8 spinal cord (arrow); F: Axial T2WI sequence of the lumbar spine shows hyperintensity at the T7-T8 level (arrow).
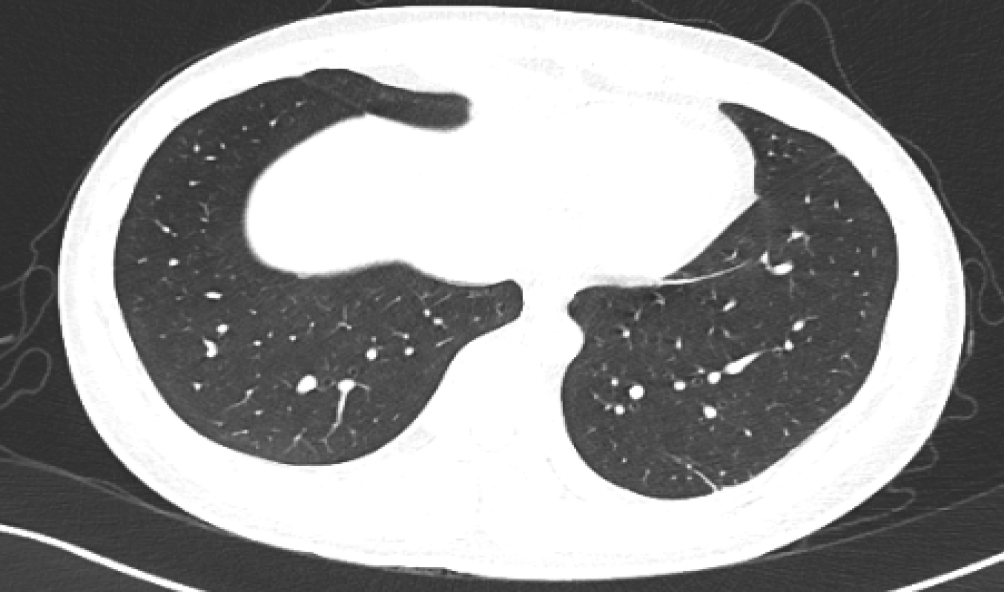
Figure 2 A chest computerized tomography scan of the patient.
Chest computerized tomography showed mild interstitial lesions in both lower lungs without the typical ground glass-like or solid shadows of severe acute respiratory syndrome virus 2 infection.
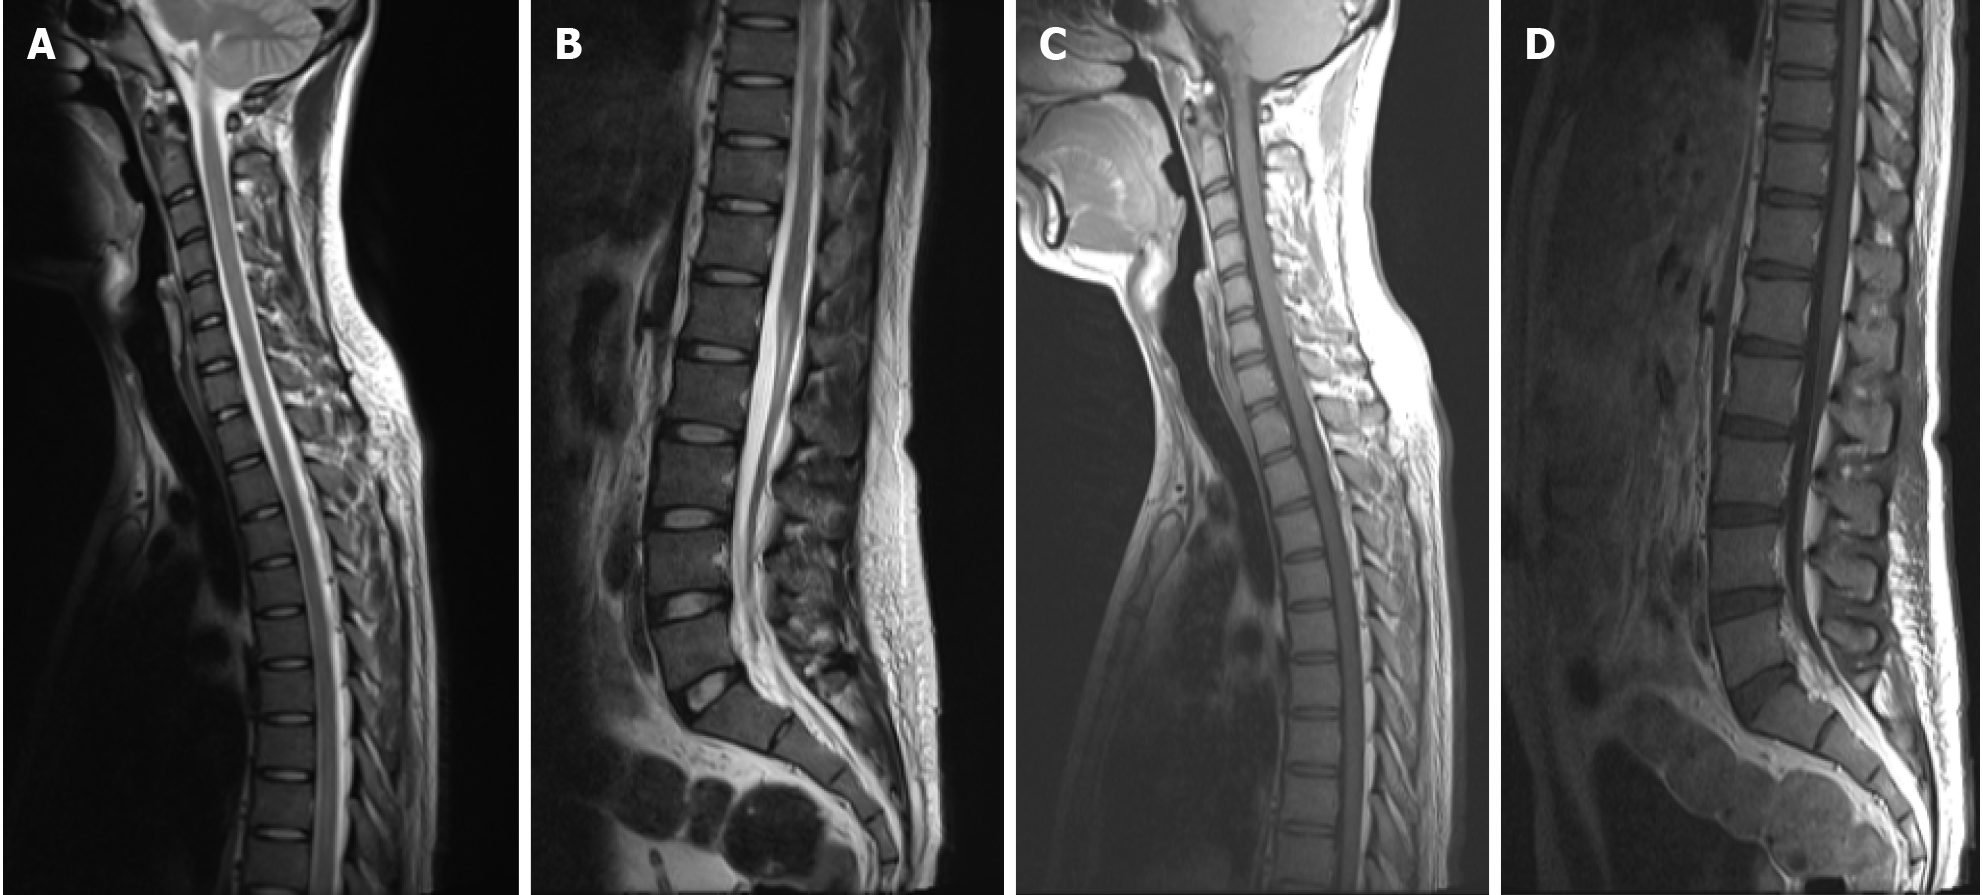
Figure 3 Magnetic resonance imaging scan of spinal cord one week after methylprednisolone treatment.
A: Sagittal T2WI sequence of the cervical spine shows a reduced range of long T2 signals in C3-C6 and T7-T8 segments compared with the previous one (arrows); B: Sagittal T2WI sequence of the lumbar spine: A reduced range of long T2 signals in T7-T8 segments compared with the previous one (arrows); C: Sagittal enhancement sequence of the cervical spine: No abnormal enhancement was seen; D: Sagittal enhancement sequence of the lumbar spine: No abnormal enhancement was seen.
- Citation: Zheng JR, Chang JL, Hu J, Lin ZJ, Lin KH, Lu BH, Chen XH, Liu ZG. Myelin oligodendrocyte glycoprotein-associated transverse myelitis after SARS-CoV-2 infection: A case report. World J Radiol 2024; 16(9): 446-452
- URL: https://www.wjgnet.com/1949-8470/full/v16/i9/446.htm
- DOI: https://dx.doi.org/10.4329/wjr.v16.i9.446


