Copyright
©The Author(s) 2024.
World J Radiol. Sep 28, 2024; 16(9): 407-417
Published online Sep 28, 2024. doi: 10.4329/wjr.v16.i9.407
Published online Sep 28, 2024. doi: 10.4329/wjr.v16.i9.407
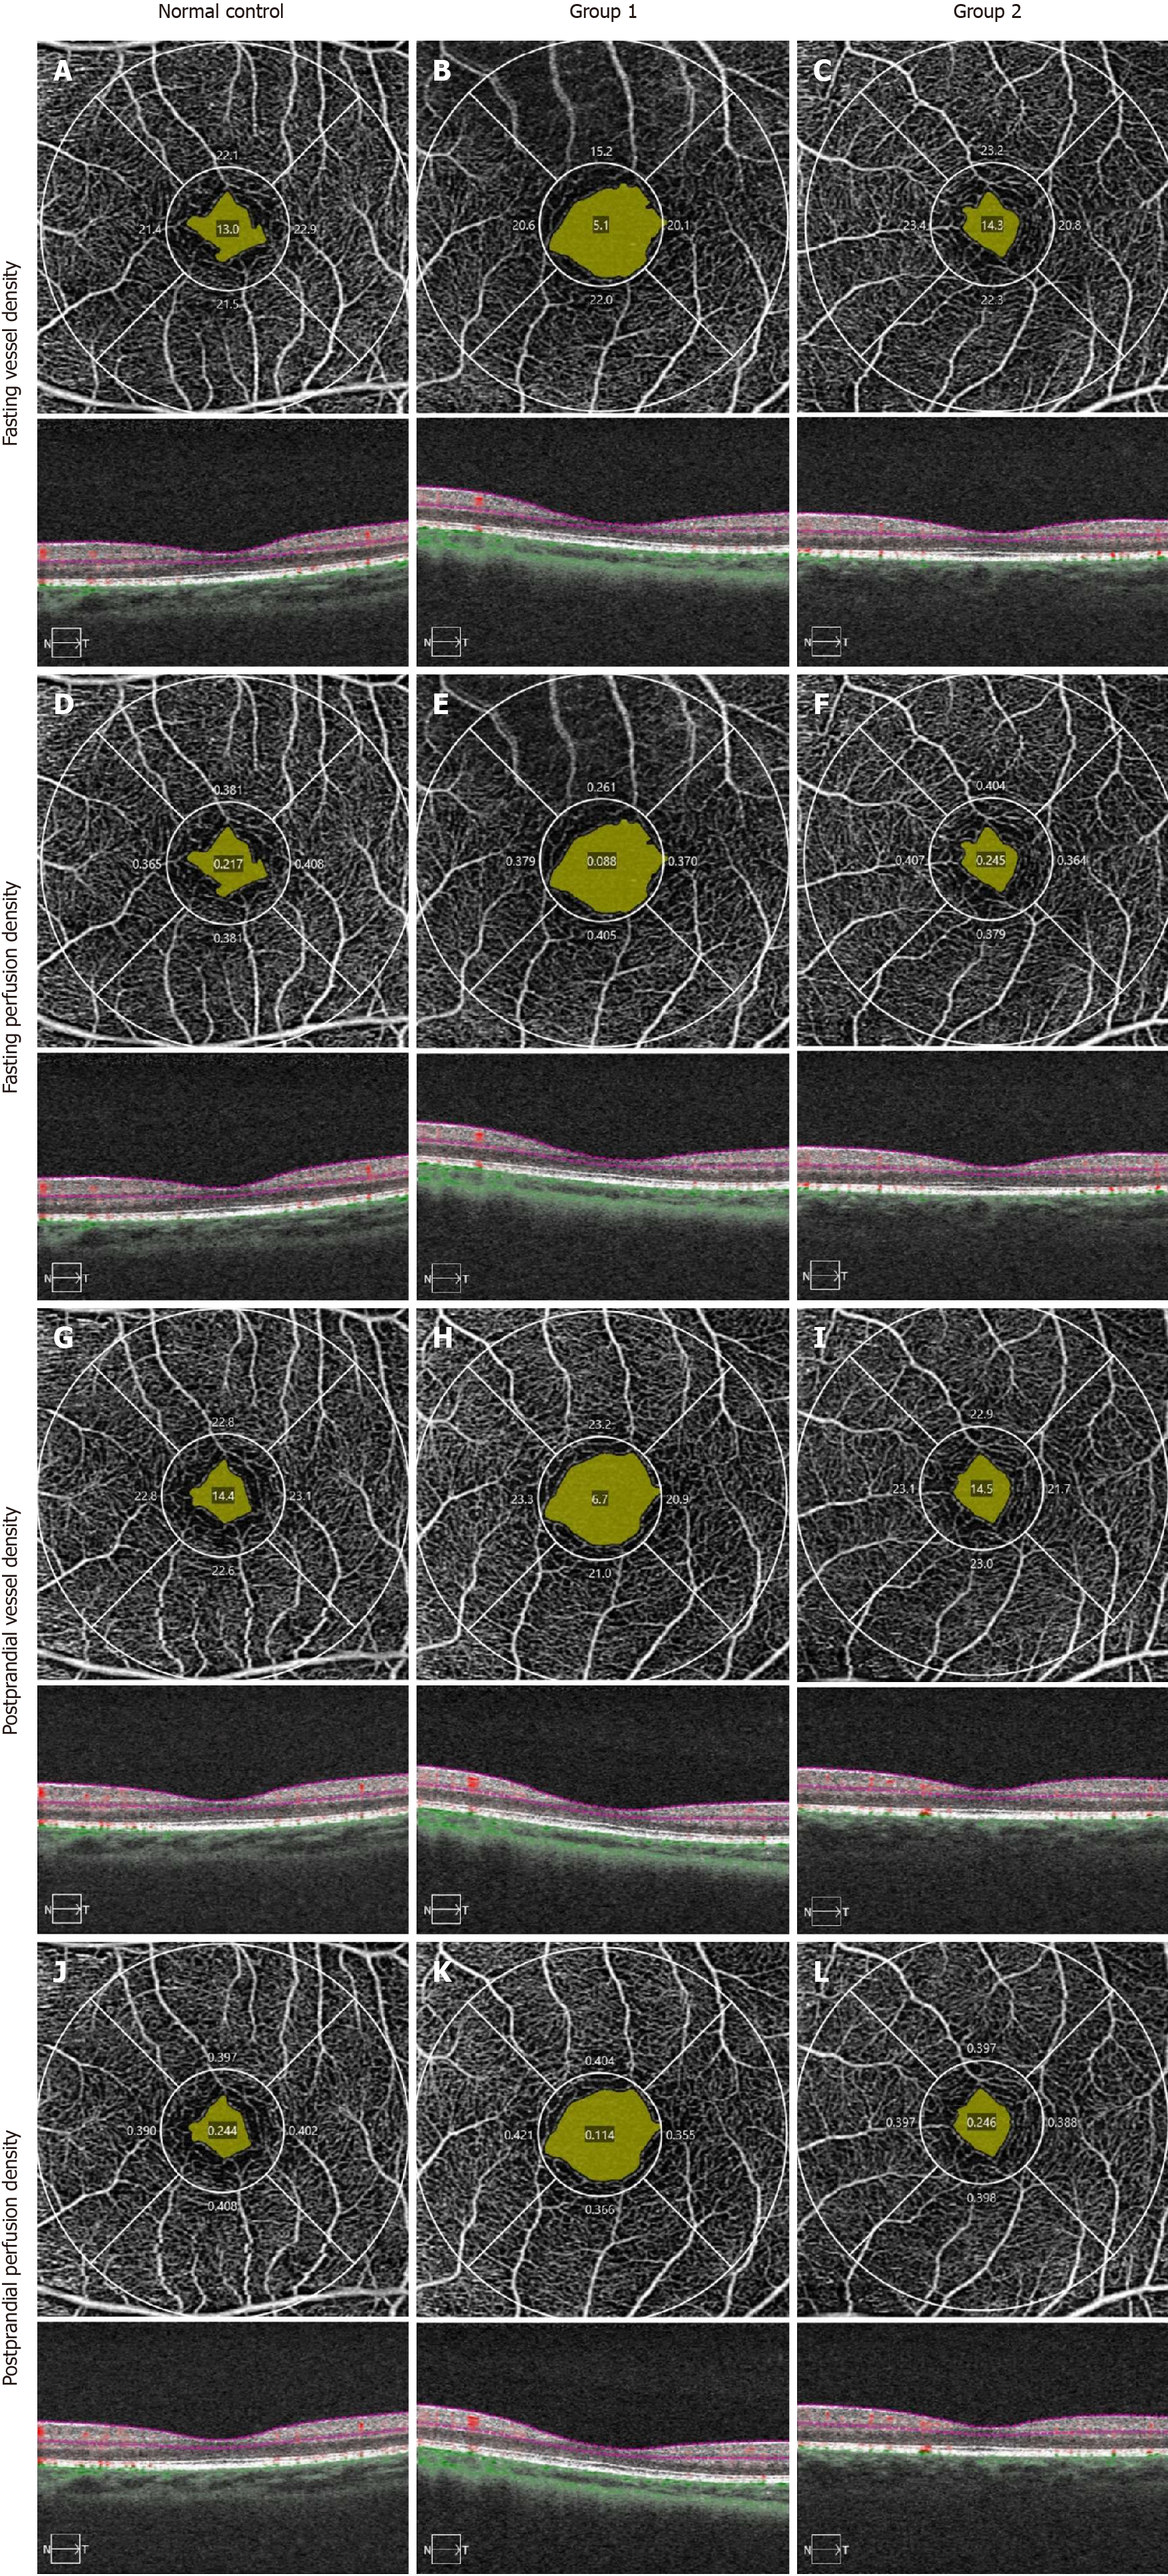
Figure 1 Comparison of central vessel density in fasting state and one hour after oral glucose solution intake across different glycemic groups.
A: The central vessel density (VD) in the fasting state of the normal control group; B: The central VD in the fasting state of the impaired fasting glucose or impaired glucose tolerance group; C: The central VD in the fasting state of the group with both impaired fasting glucose and impaired glucose tolerance; D: The central perfusion density (PD) in the fasting state of the normal control group; E: The central PD in the fasting state of the impaired fasting glucose or impaired glucose tolerance group; F: The central PD in the fasting state of the group with both impaired fasting glucose and impaired glucose tolerance; G: The central VD one hour after oral glucose solution intake in the normal control group; H: The central VD one hour after oral glucose solution intake in the impaired fasting glucose or impaired glucose tolerance group; I: The central VD one hour after oral glucose solution intake in the group with both impaired fasting glucose and impaired glucose tolerance; J: The central PD one hour after oral glucose administration in the normal control group; K: The central PD one hour after oral glucose administration in the impaired fasting glucose or impaired glucose tolerance group; L: The central PD one hour after oral glucose administration in the group with both impaired fasting glucose and impaired glucose tolerance.
- Citation: Lv BJ, Zuo HJ, Li QF, Huang FF, Zhang T, Huang RX, Zheng SJ, Wan WJ, Hu K. Retinal microcirculation changes in prediabetic patients with short-term increased blood glucose using optical coherence tomography angiography. World J Radiol 2024; 16(9): 407-417
- URL: https://www.wjgnet.com/1949-8470/full/v16/i9/407.htm
- DOI: https://dx.doi.org/10.4329/wjr.v16.i9.407


