Copyright
©The Author(s) 2024.
World J Radiol. Aug 28, 2024; 16(8): 348-355
Published online Aug 28, 2024. doi: 10.4329/wjr.v16.i8.348
Published online Aug 28, 2024. doi: 10.4329/wjr.v16.i8.348
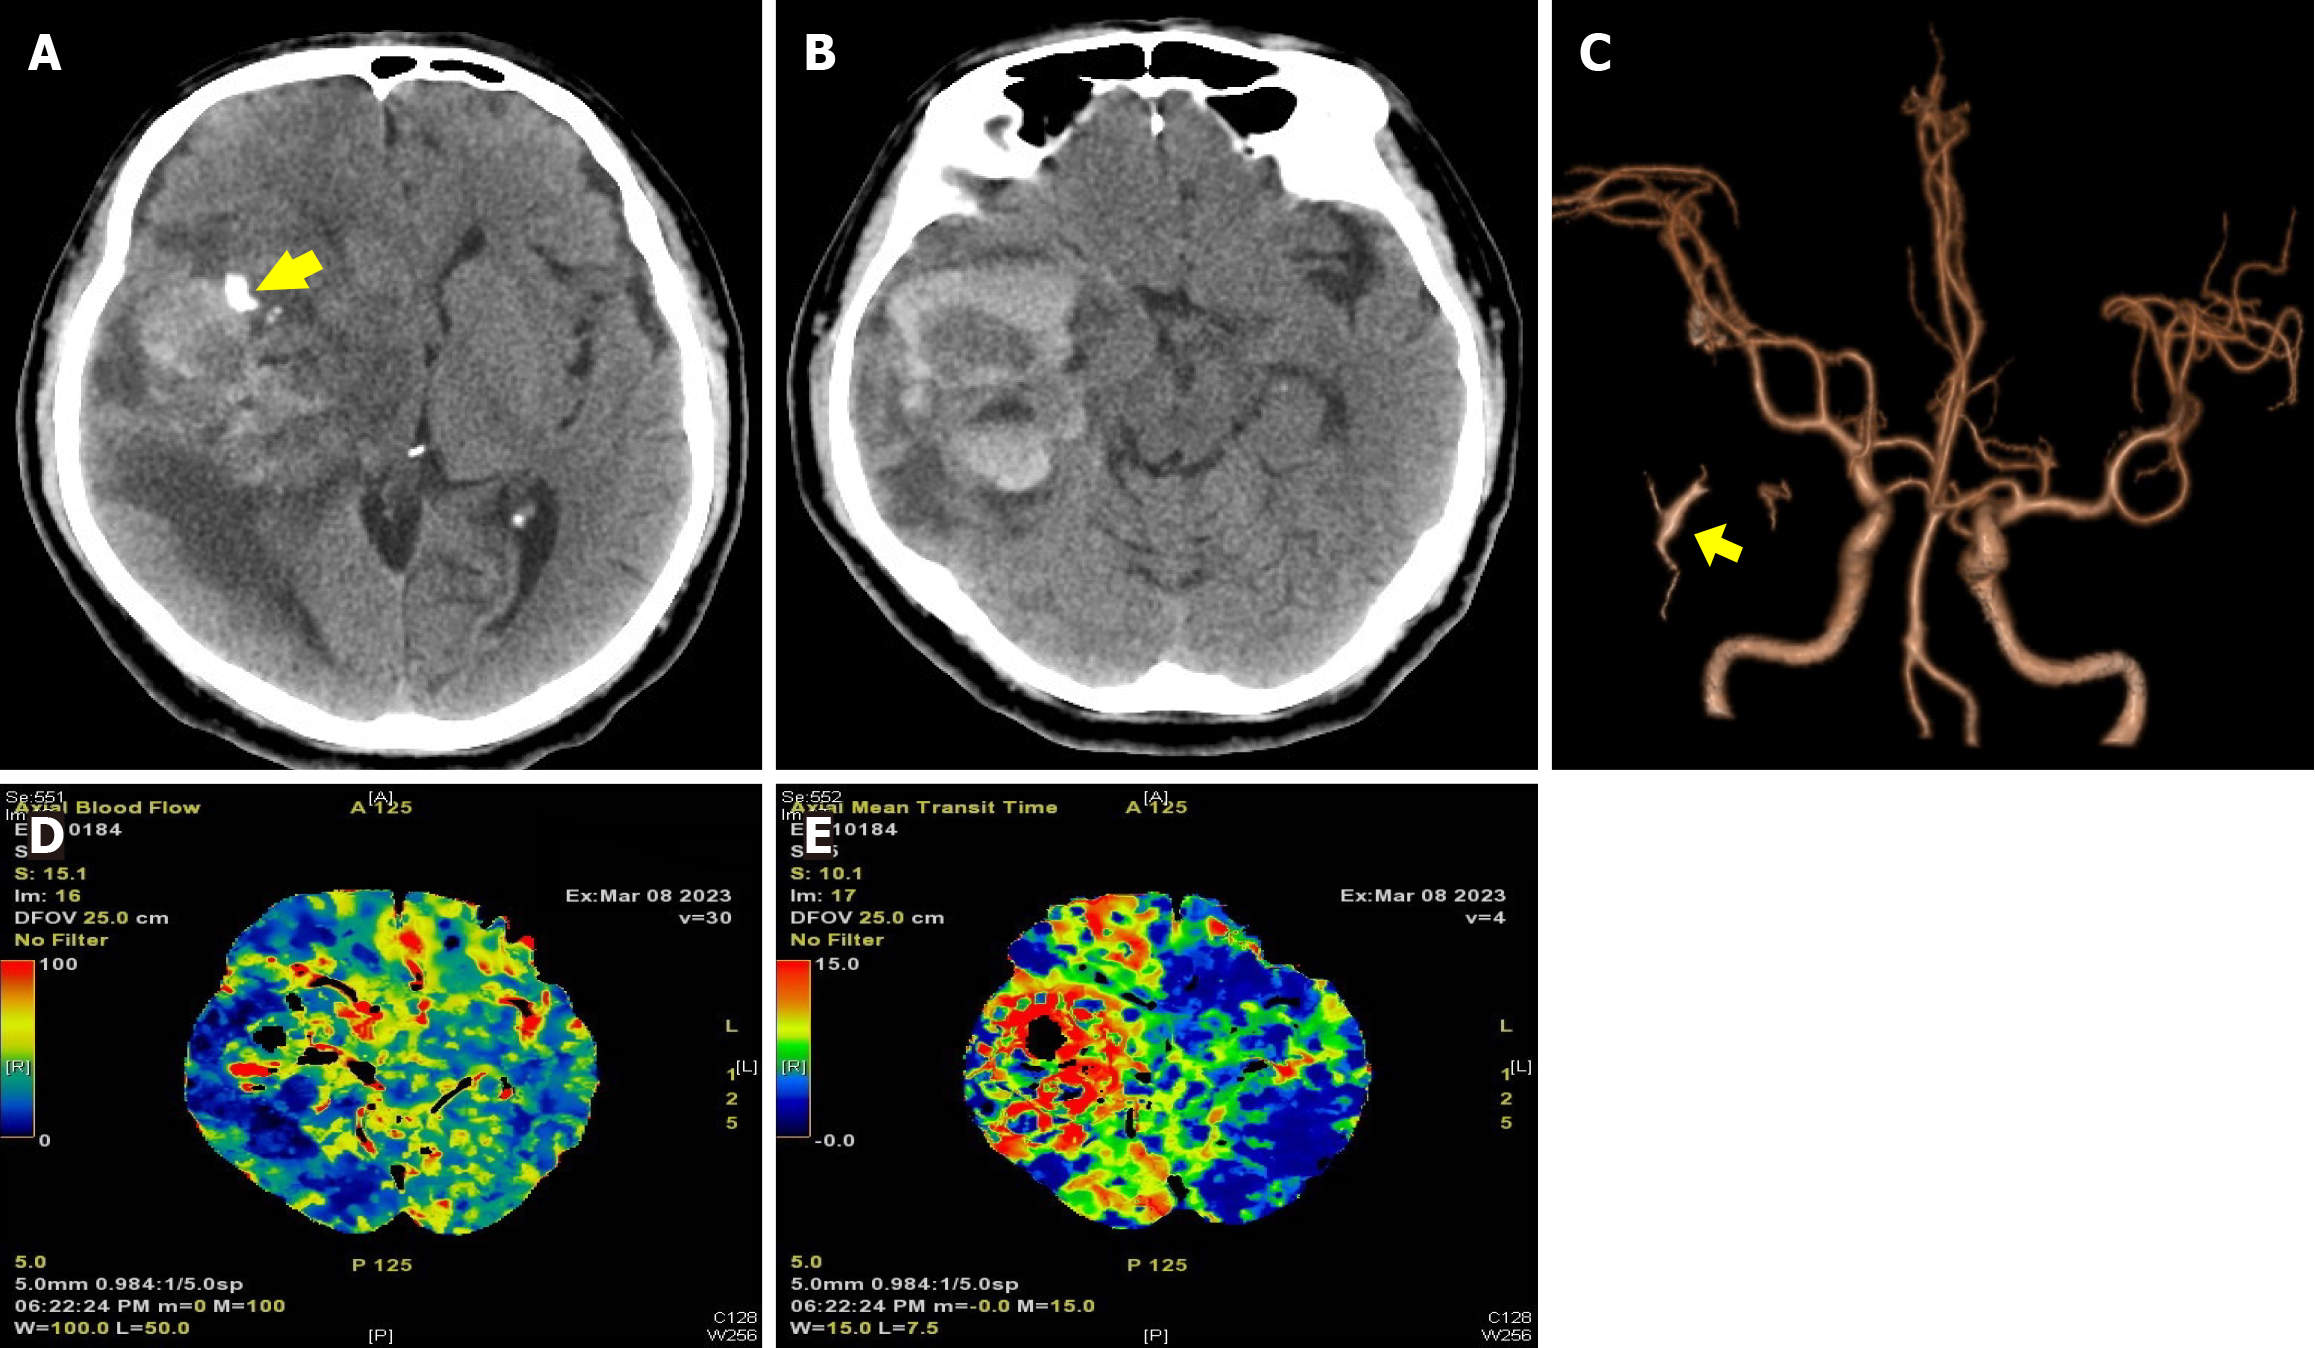
Figure 1 Preoperative neuroimaging.
A and B: Cranial computed tomography revealed hemorrhage and edema in the right temporal lobe, calcification in the anterior portion of the mass (arrow), and a midline shift to the left; C: Computed tomography angiography revealed right middle cerebral artery elevation and an early drainage vein (arrow); D and E: Computed tomography perfusion imaging showed increased cerebral blood flow and mean transit time in the lesion area.
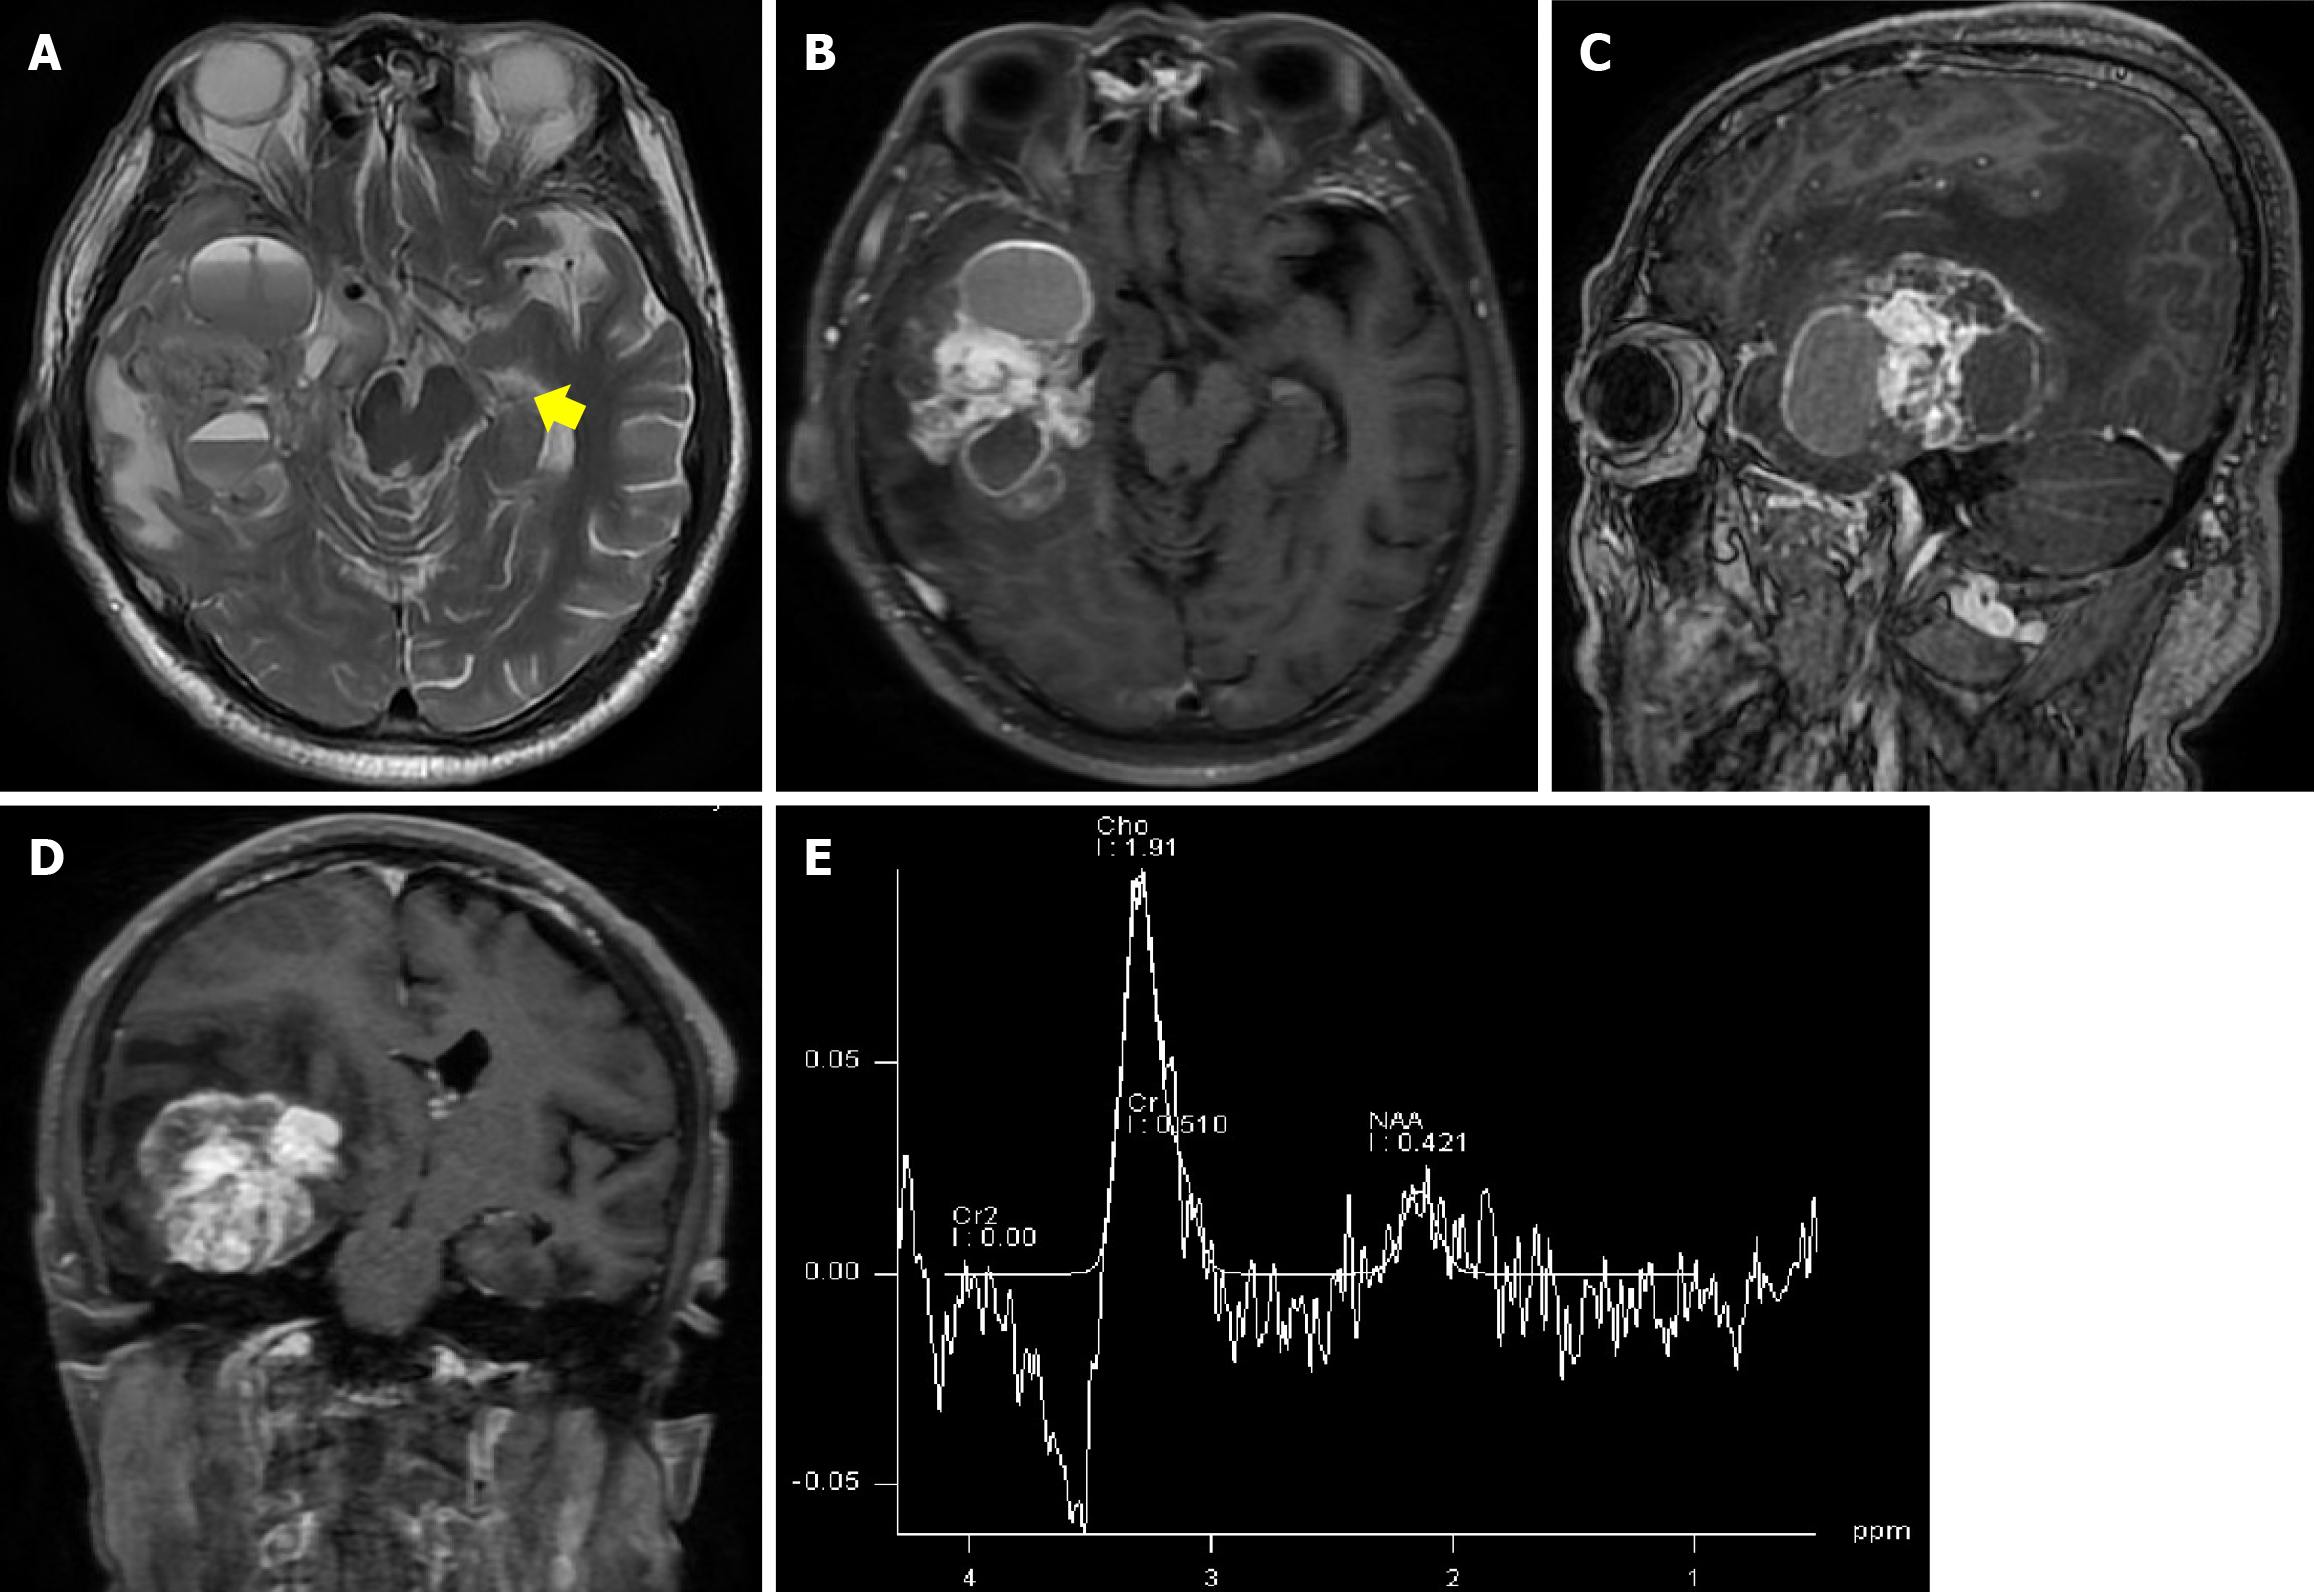
Figure 2 Preoperative neuroimaging.
A: T2-weighted axial magnetic resonance imaging demonstrated cystic and solid space-occupying lesions, a visible air-fluid level in the cyst, and flow void signs within the lesion (arrow); B–D: Gadolinium-enhanced T1-weighted magnetic resonance imaging of the brain revealed a 4.5 cm × 6.3 cm × 4.6 cm necrotic cystic lesion with heterogeneous enhancement involving the basal ganglia, with a midline shift and uncal herniation; E: Magnetic resonance spectroscopy revealed aberrant metabolic function. An increased choline/creatine (Cr) peak ratio and a decreased N-acetyl aspartate/Cr ratio, matching the metabolic signature of glioma, were detected within the lesion.
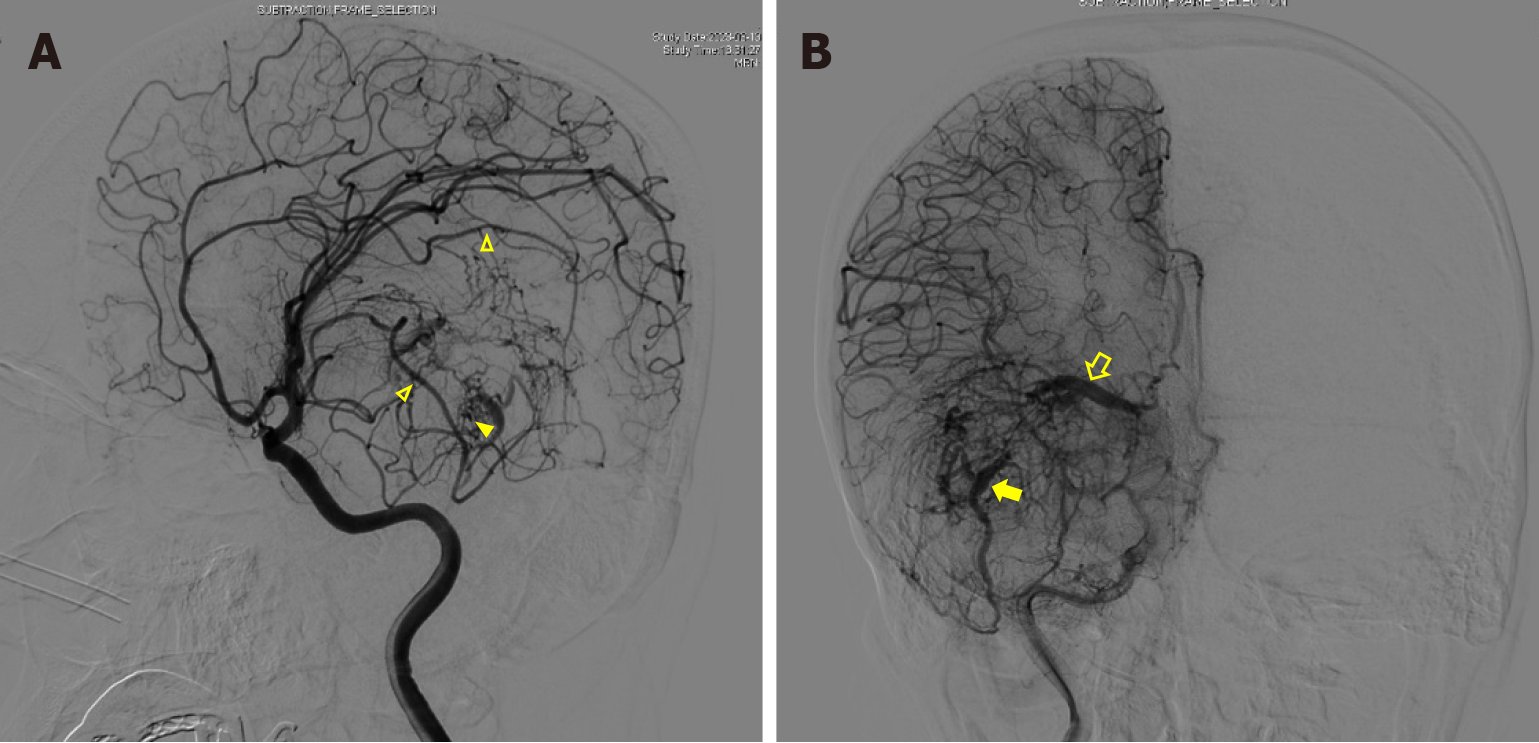
Figure 3 Preoperative cerebral angiography.
A: Two feeding vessels originating from the branches of the right middle artery (open triangles) and two large draining veins were seen in the early arterial phase. Numerous small tortuous blood vessels were observed to form a nidus between the feeding artery and the draining vein (solid triangle); B: In the late arterial phase, both draining veins exhibited a caput medusae distribution consistent with a developmental venous anomaly; one drained into the great cerebral vein and to the sinuses rectus (open arrow), and the other drained through the superior petrosal sinus to the ipsilateral transverse sinus (solid arrow).
Figure 4 Histological findings.
A: Examination of the neoplastic glial cells revealed a single-cell morphology, round nuclei, clear borders, moderate atypia, perinuclear haloes, rare mitotic figures (solid arrow), endothelial cell hyperplasia (open arrow), focal calcification, and patchy hemorrhage [hematoxylin and eosin (HE) stain, magnification 400 ×]; B: The tumor contained a large number of blood vessels of various sizes (asterisks; HE stain, magnification 40 ×); C: Immunohistochemical analysis showed strong cytoplasm staining for glial fibrillary acidic protein (magnification 100 ×).
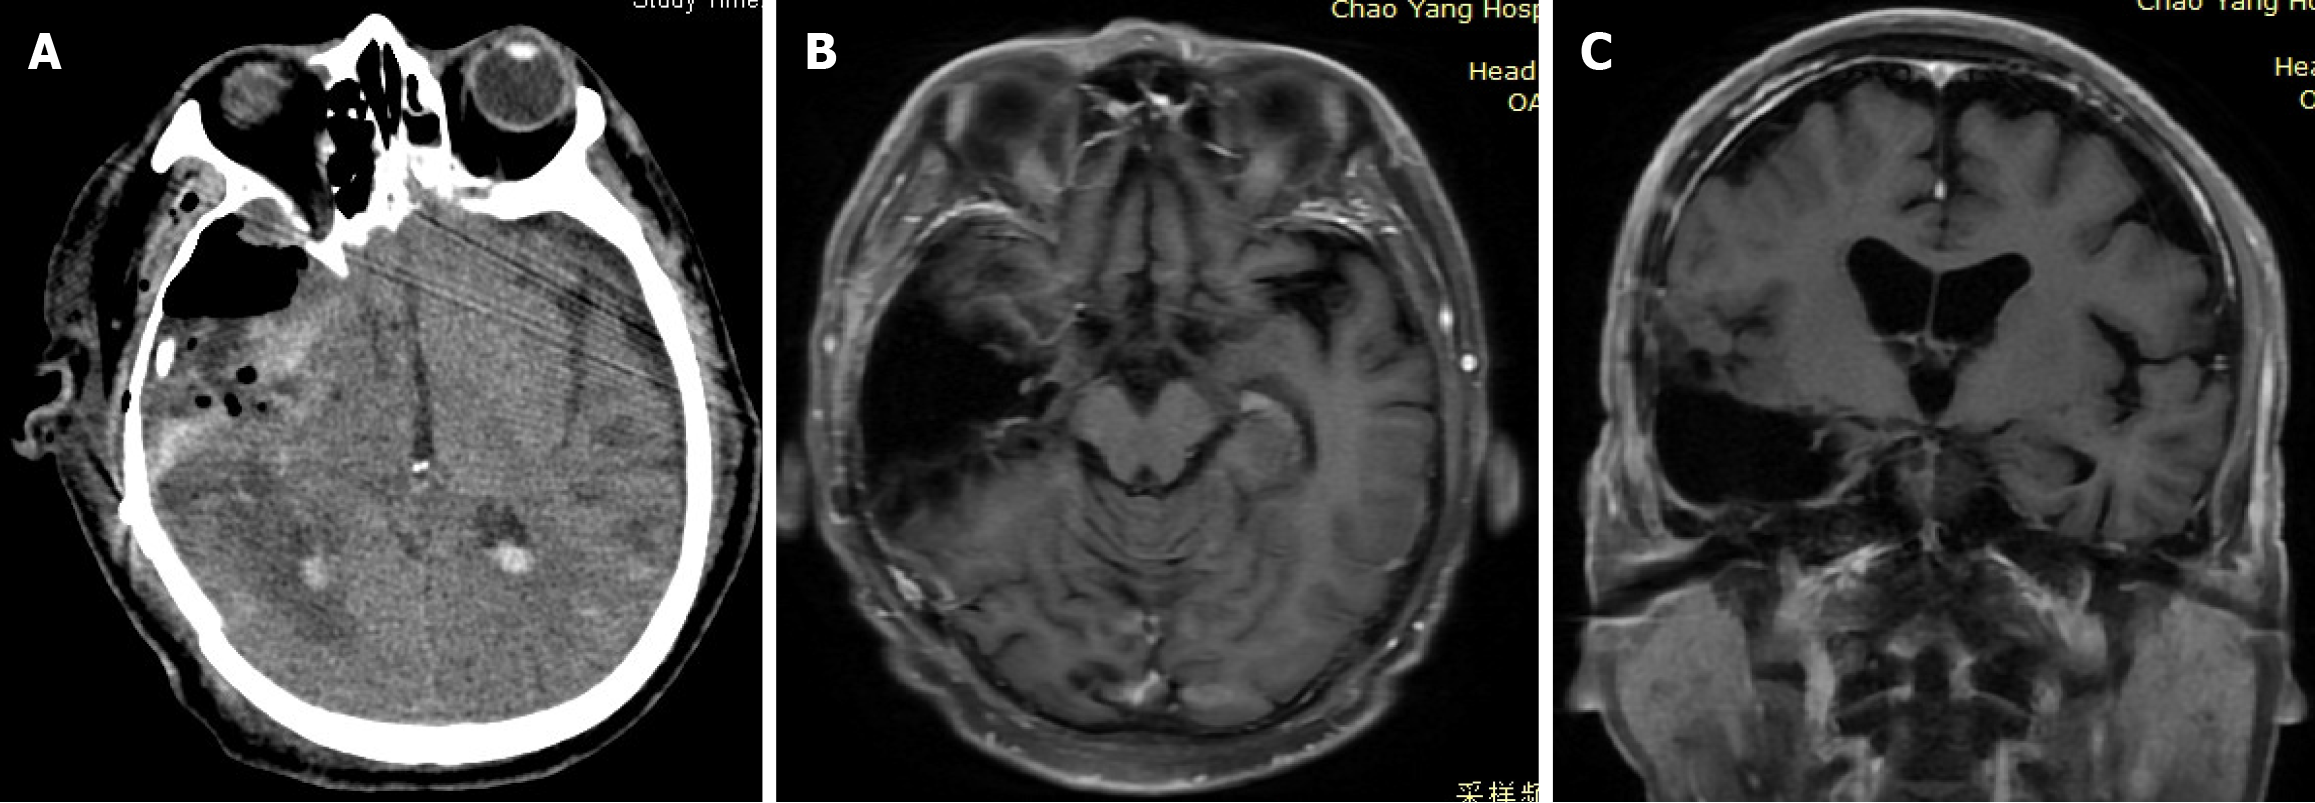
Figure 5 Postoperative neuroimaging.
A: Postoperative head computed tomography showed a small amount of bleeding in the surgical cavity and the midline return; B and C: Enhanced magnetic resonance imaging performed at 6 months postoperatively revealed no definitive sign of recurrence.
- Citation: Guo P, Sun W, Song LX, Cao WY, Li JP. Multimodal imaging for the diagnosis of oligodendroglioma associated with arteriovenous malformation: A case report. World J Radiol 2024; 16(8): 348-355
- URL: https://www.wjgnet.com/1949-8470/full/v16/i8/348.htm
- DOI: https://dx.doi.org/10.4329/wjr.v16.i8.348


