Copyright
©The Author(s) 2024.
World J Radiol. Aug 28, 2024; 16(8): 329-336
Published online Aug 28, 2024. doi: 10.4329/wjr.v16.i8.329
Published online Aug 28, 2024. doi: 10.4329/wjr.v16.i8.329
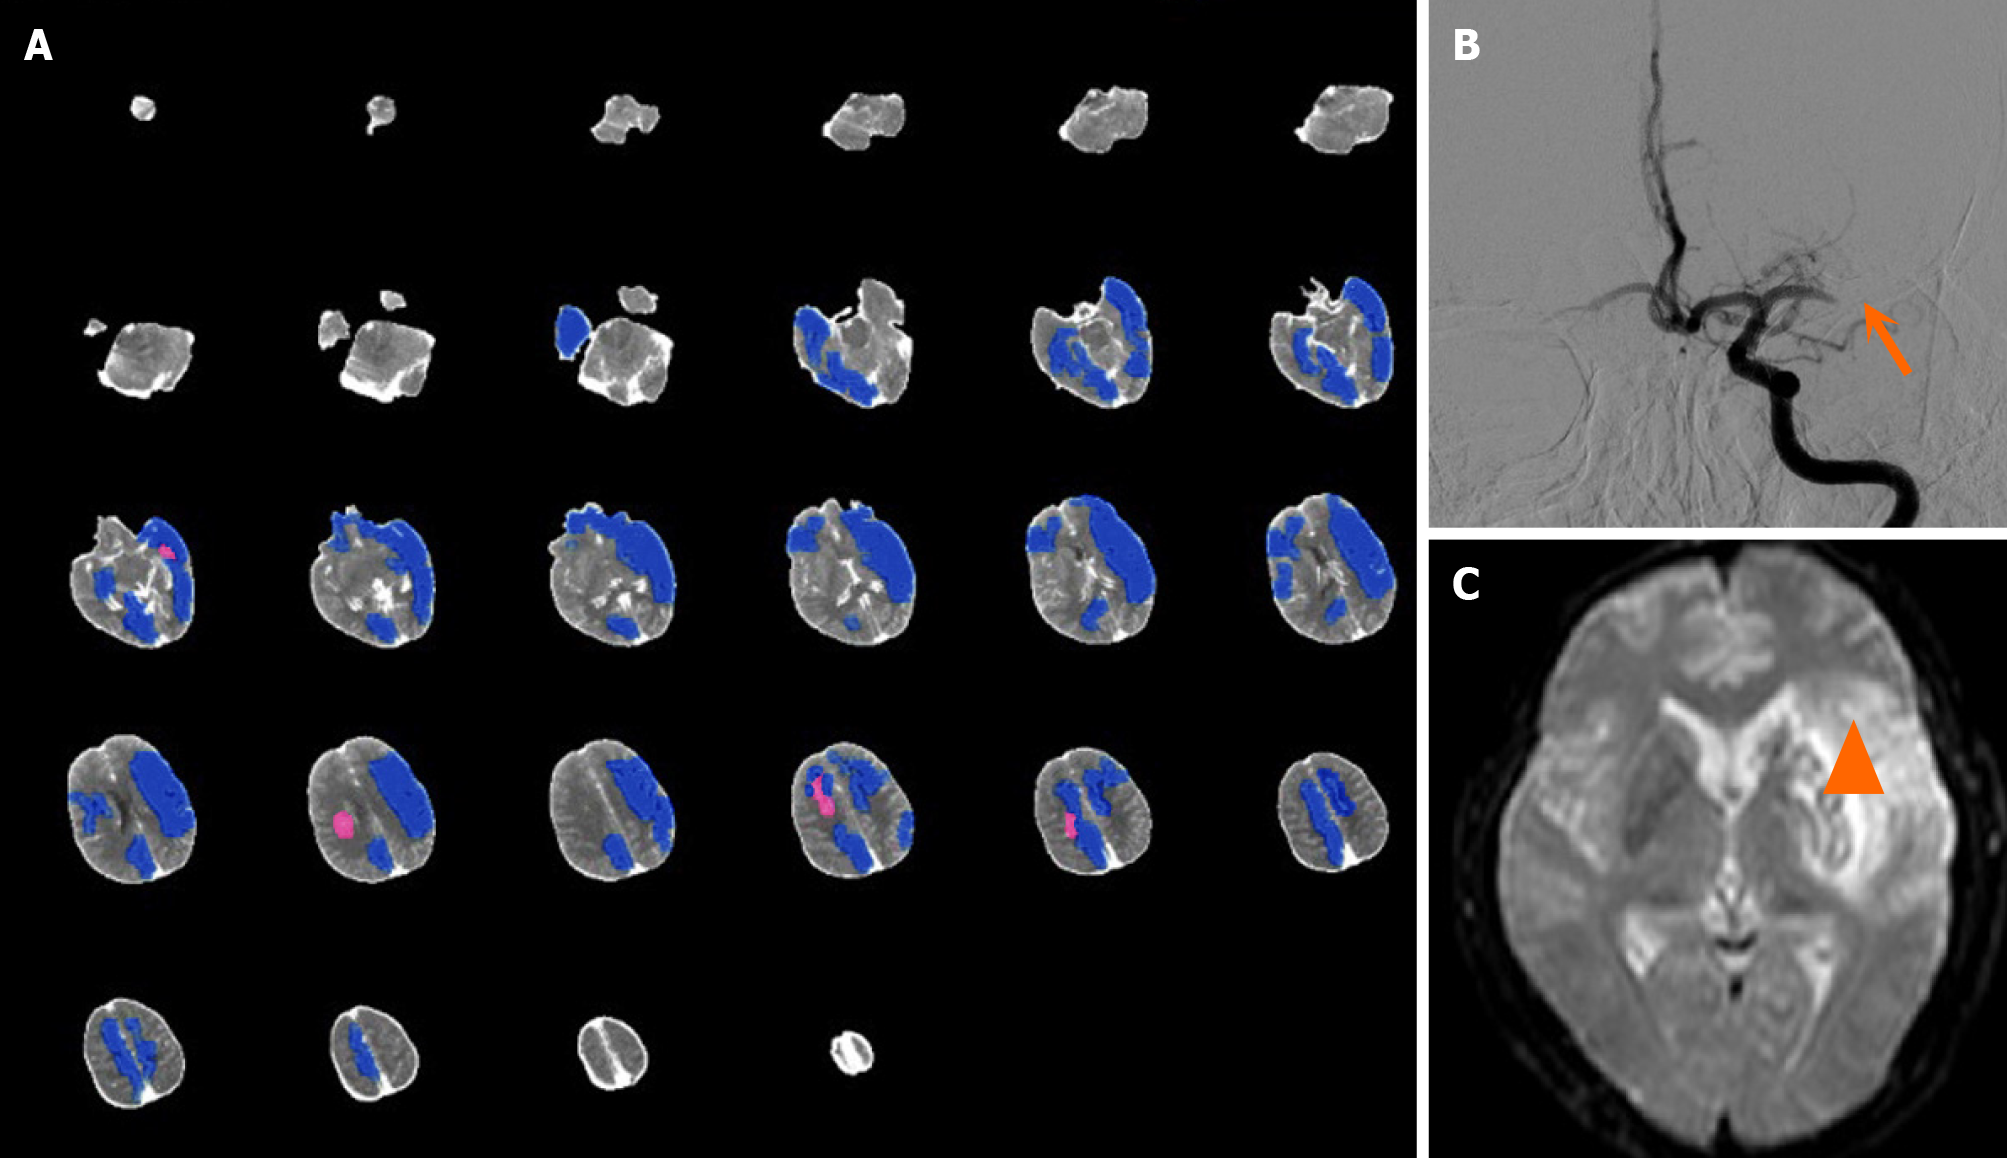
Figure 1 Imaging findings regarding cerebral perfusion, core infarction, and cerebral arteries of case 1.
A: Shukun brain perfusion computed tomography image processing software suggested that the core infarction volume was 4 mL located in the right cerebral hemisphere (pink area), and the low perfusion volume of 246.1 mL mainly in the left hemisphere (blue area); B: Digital subtraction angiography revealed M1 segment occlusion of the left middle cerebral artery (arrow); C: Diffusion-weighted imaging revealed infarction in the left cerebral hemisphere 14 days after mechanical thrombectomy (triangle).
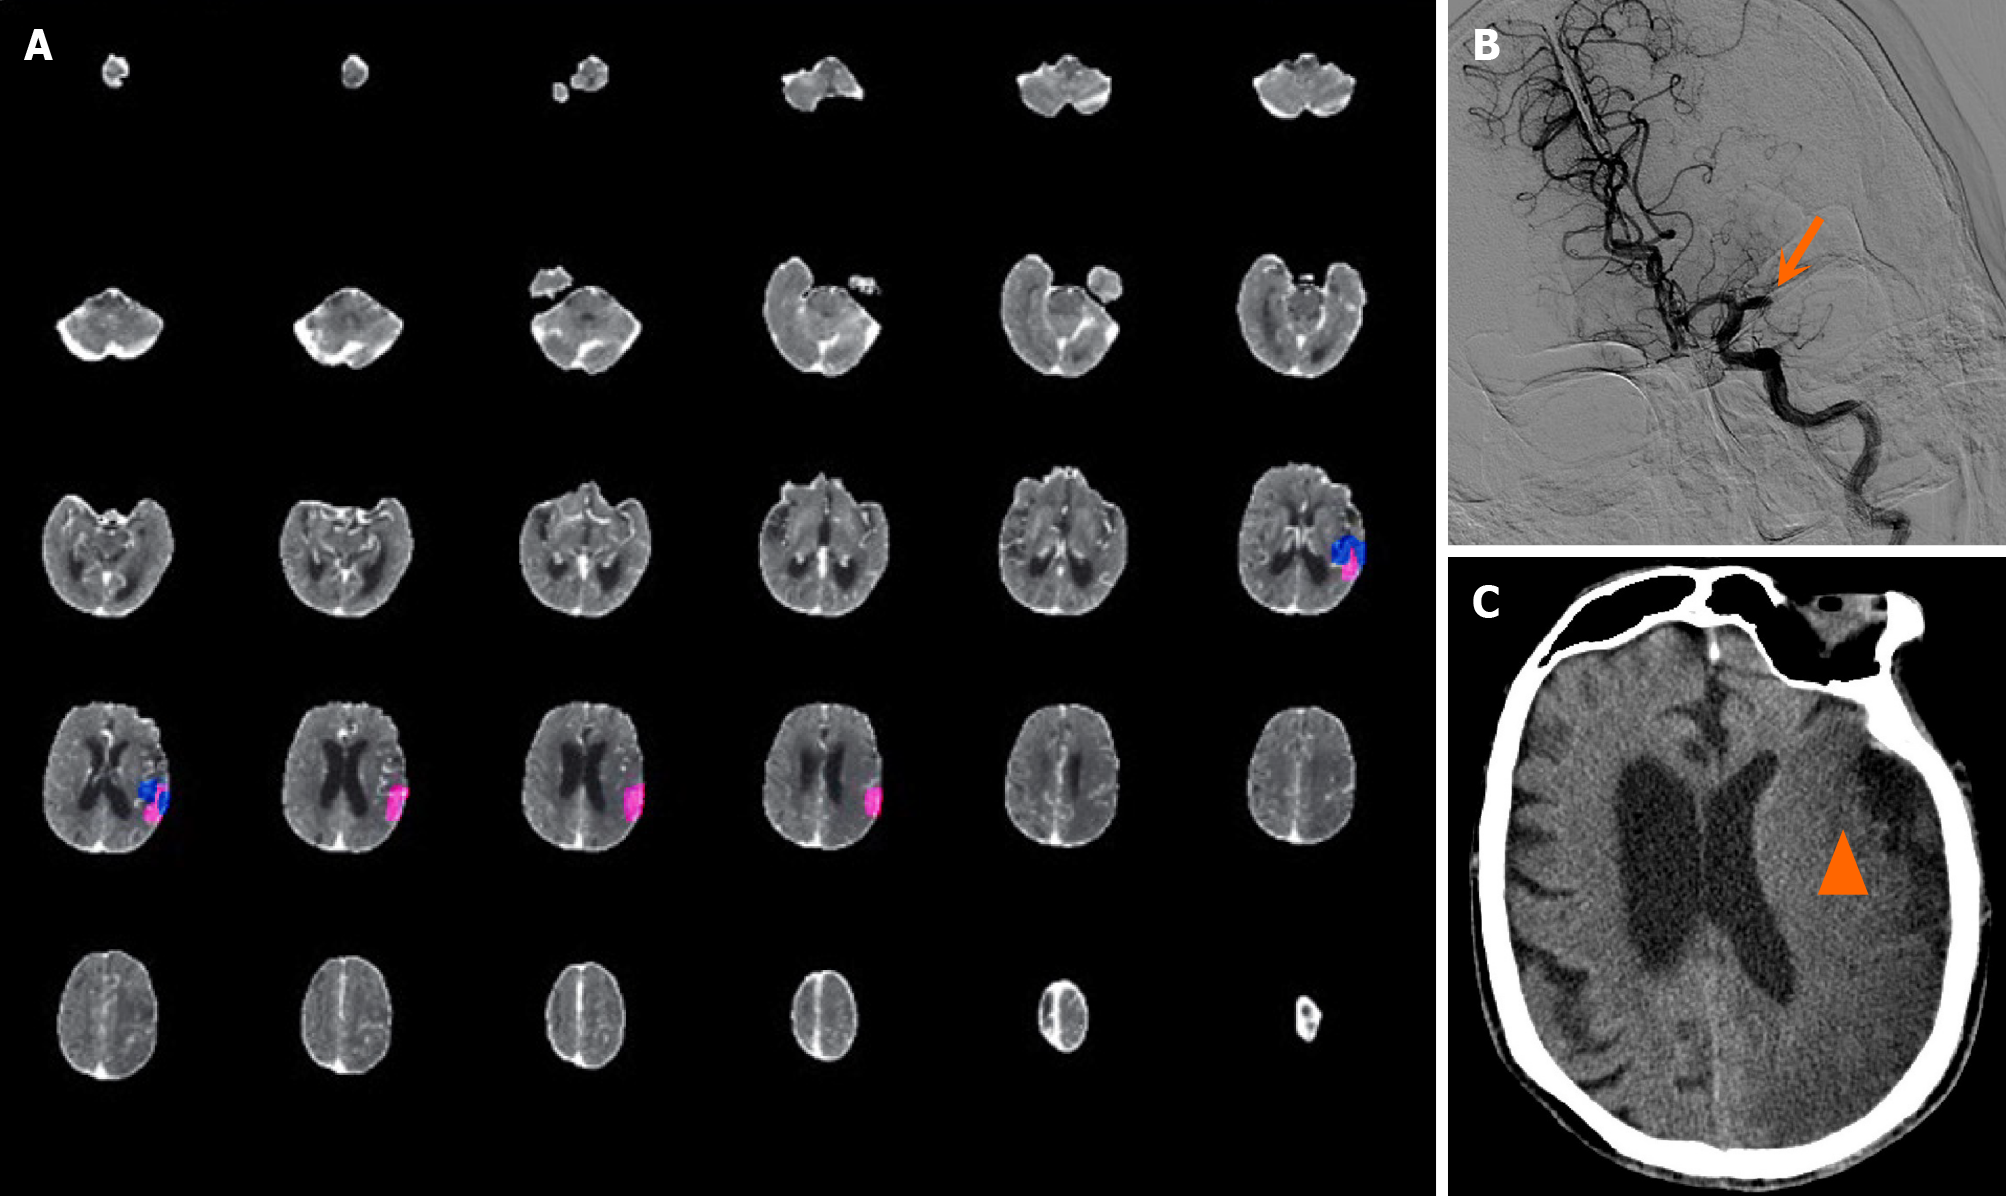
Figure 2 Imaging findings regarding cerebral perfusion, core infarction, and cerebral arteries of case 2.
A: Shukun brain perfusion computed tomography (CT) image processing software suggested that the core infarction volume was 5.7 mL (pink area), the low perfusion volume was 4.2 mL (blue area), and the mismatch volume was negative; B: Digital subtraction angiography of the head and neck indicated M1 segment occlusion of the left middle cerebral artery (arrow); C: Cranial CT image showing a large area of cerebral infarction in the left hemisphere 7 days after mechanical thrombectomy (triangle).
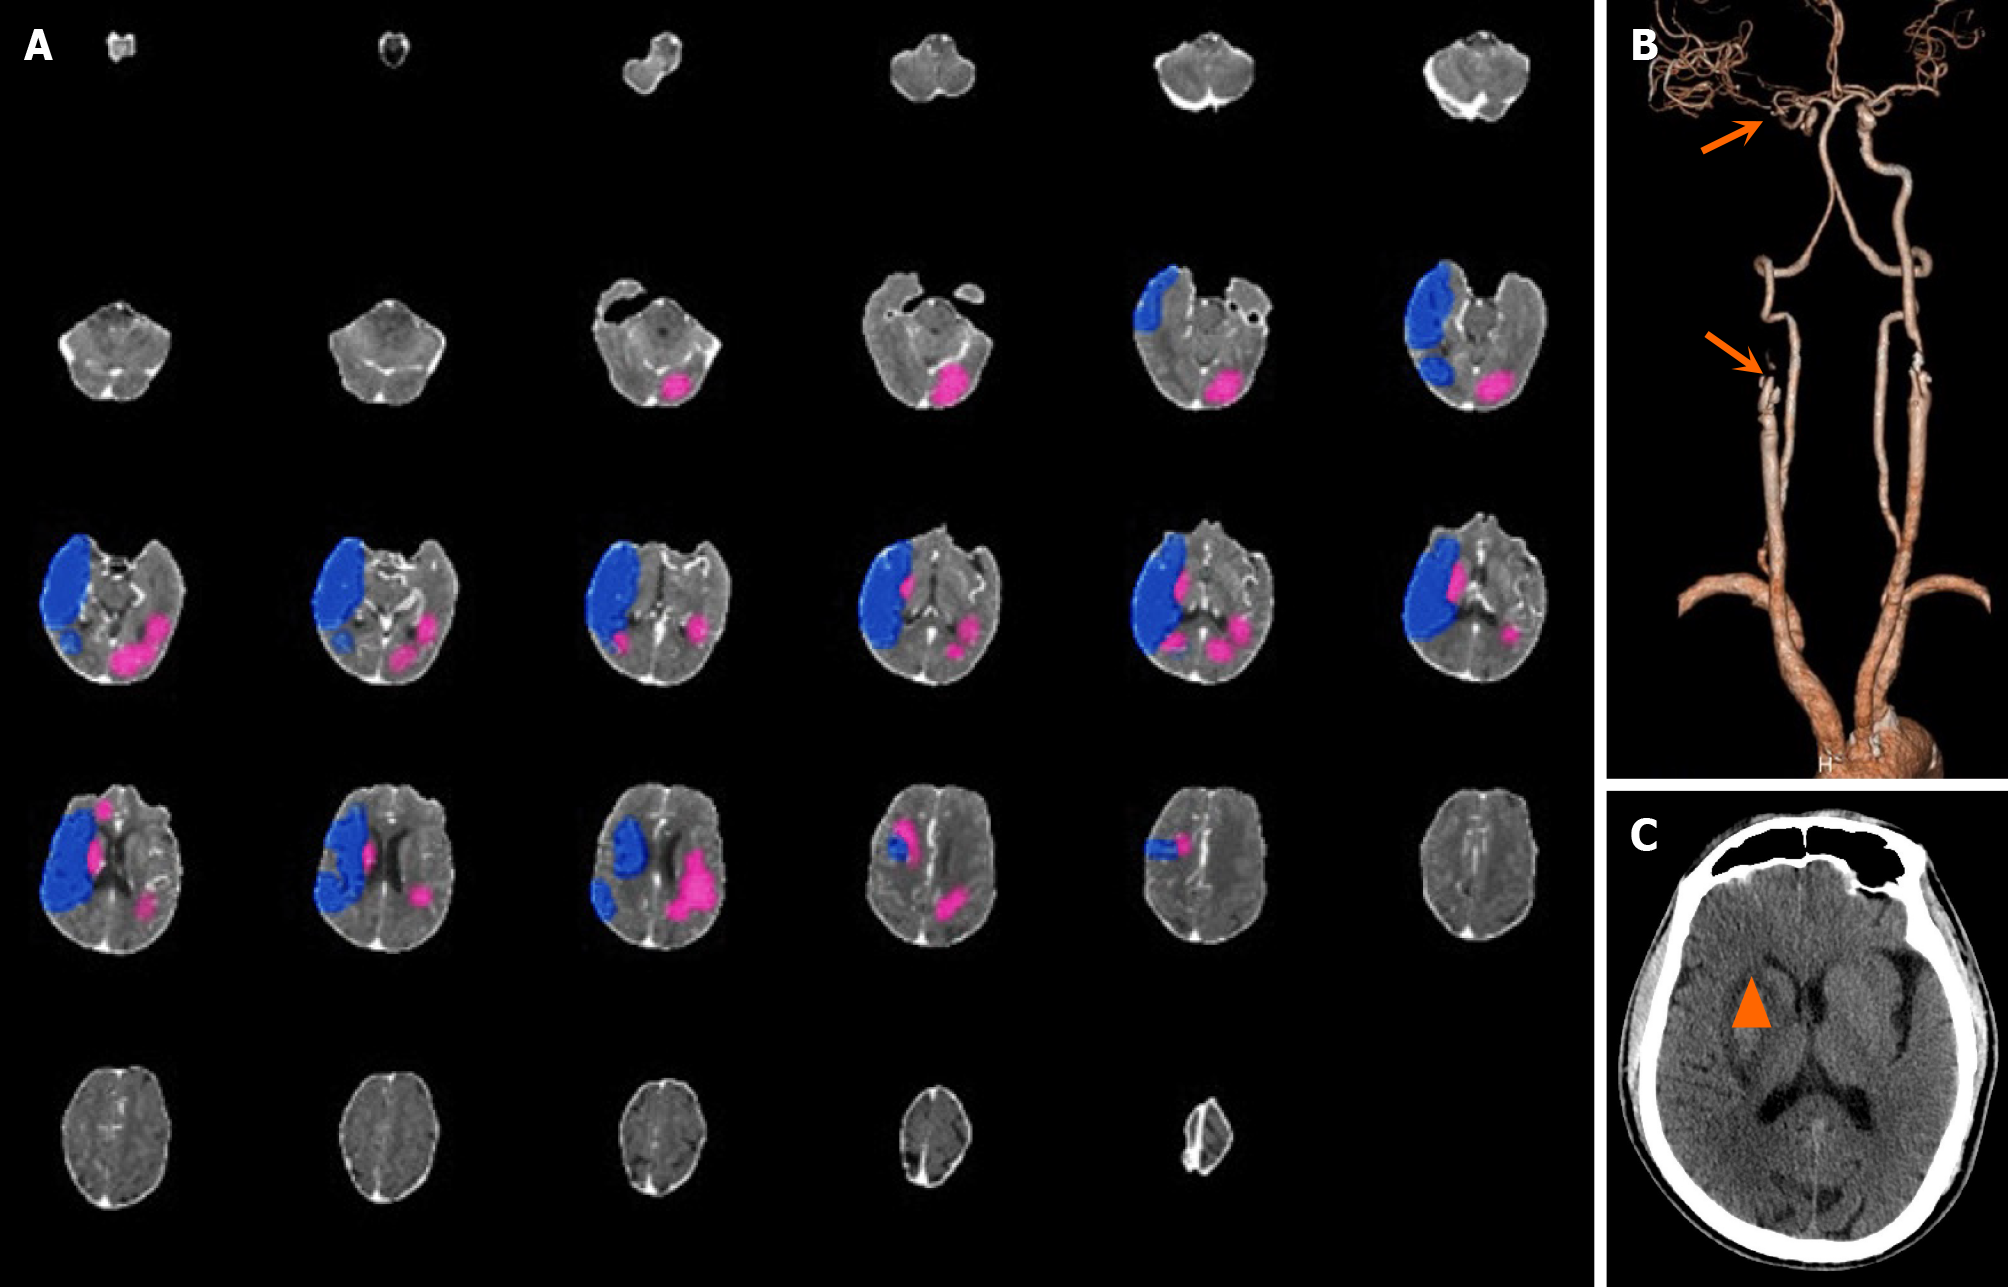
Figure 3 Imaging findings regarding cerebral perfusion, core infarction, and cerebral arteries of case 3.
A: Computed tomography (CT) image of brain perfusion (Shukun) suggested that the core infarction volume was 30.4 mL mainly in the left cerebral hemisphere (pink area), but a low perfusion volume of 119.3 mL in the right hemisphere (blue area); B: Head and neck CT angiography indicated right internal carotid artery occlusion and right middle cerebral artery occlusion (arrow); C: Brain CT image showing right basal ganglia infarction 5 days after mechanical thrombectomy (triangle).
- Citation: Li ZQ, Liu W, Luo WL, Chen SQ, Deng YP. Artificial intelligence software for assessing brain ischemic penumbra/core infarction on computed tomography perfusion: A real-world accuracy study. World J Radiol 2024; 16(8): 329-336
- URL: https://www.wjgnet.com/1949-8470/full/v16/i8/329.htm
- DOI: https://dx.doi.org/10.4329/wjr.v16.i8.329


