Copyright
©The Author(s) 2024.
World J Radiol. Dec 28, 2024; 16(12): 794-805
Published online Dec 28, 2024. doi: 10.4329/wjr.v16.i12.794
Published online Dec 28, 2024. doi: 10.4329/wjr.v16.i12.794
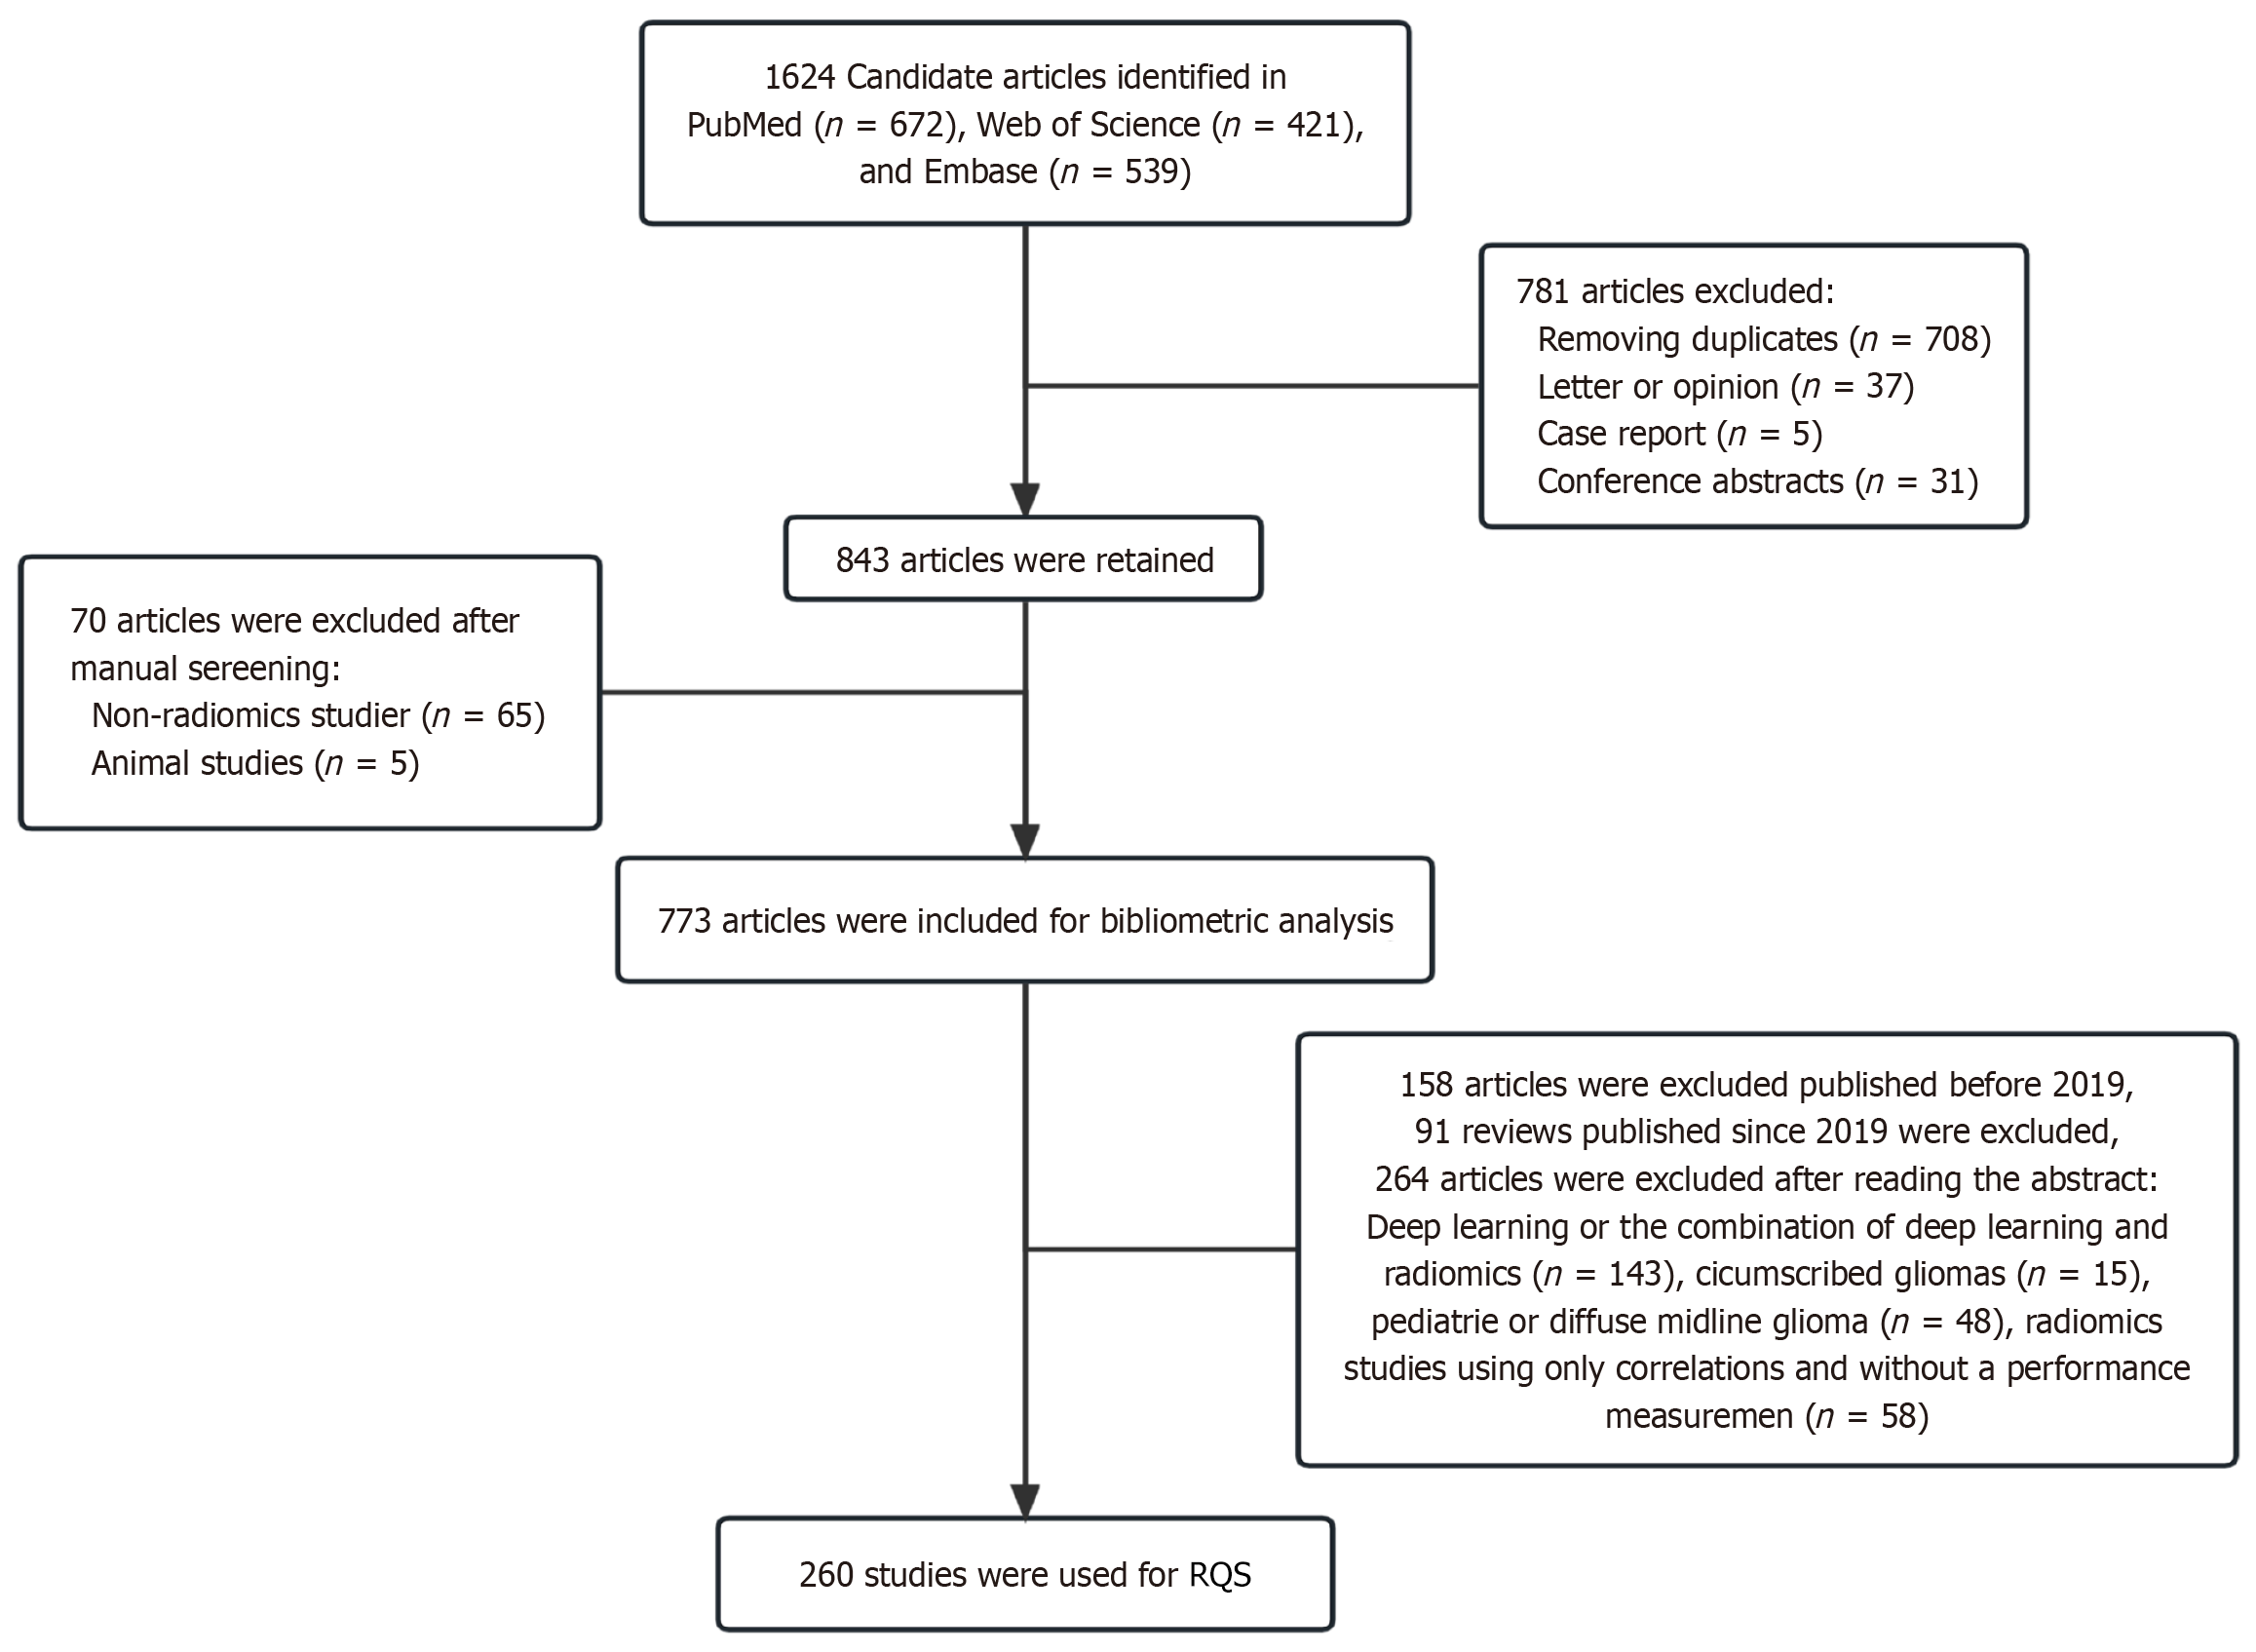
Figure 1
Flow chart of inclusion and exclusion criteria for bibliometrics and Radiomics Quality Score analyses.
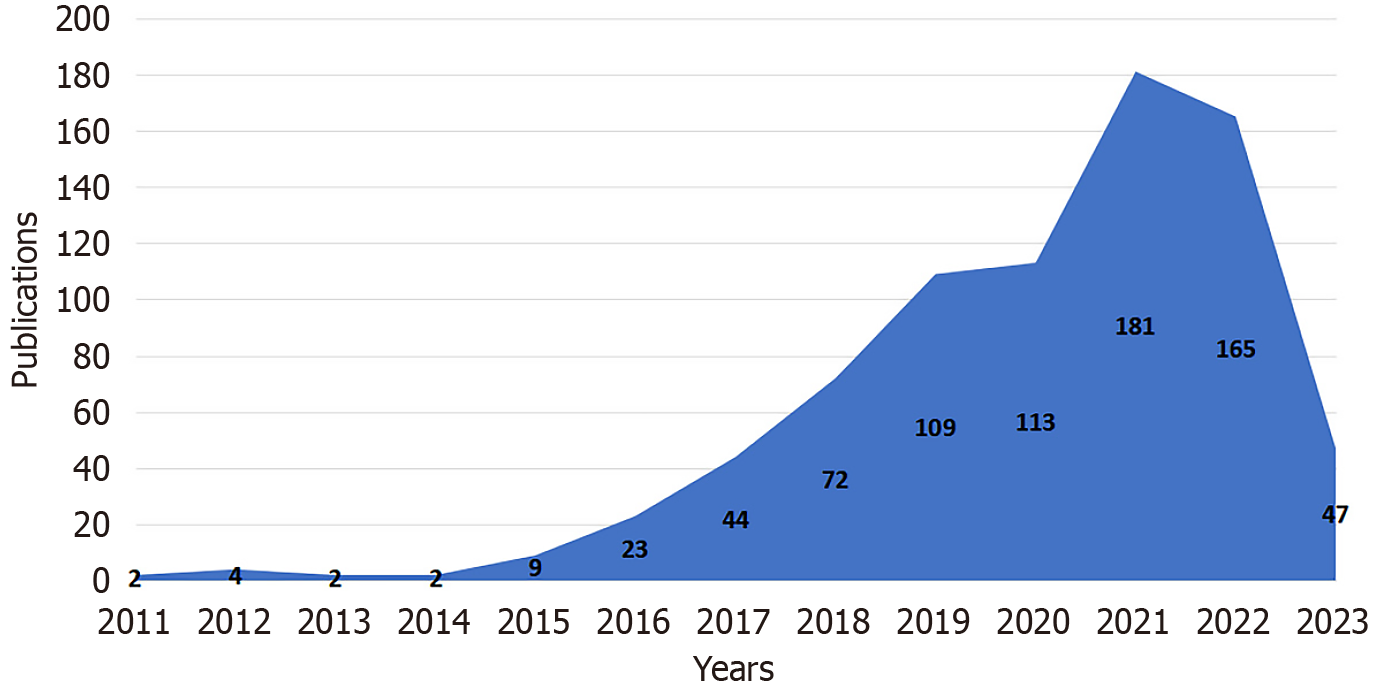
Figure 2
Global trend of publications on glioma radiomics from 2011 to 2023.
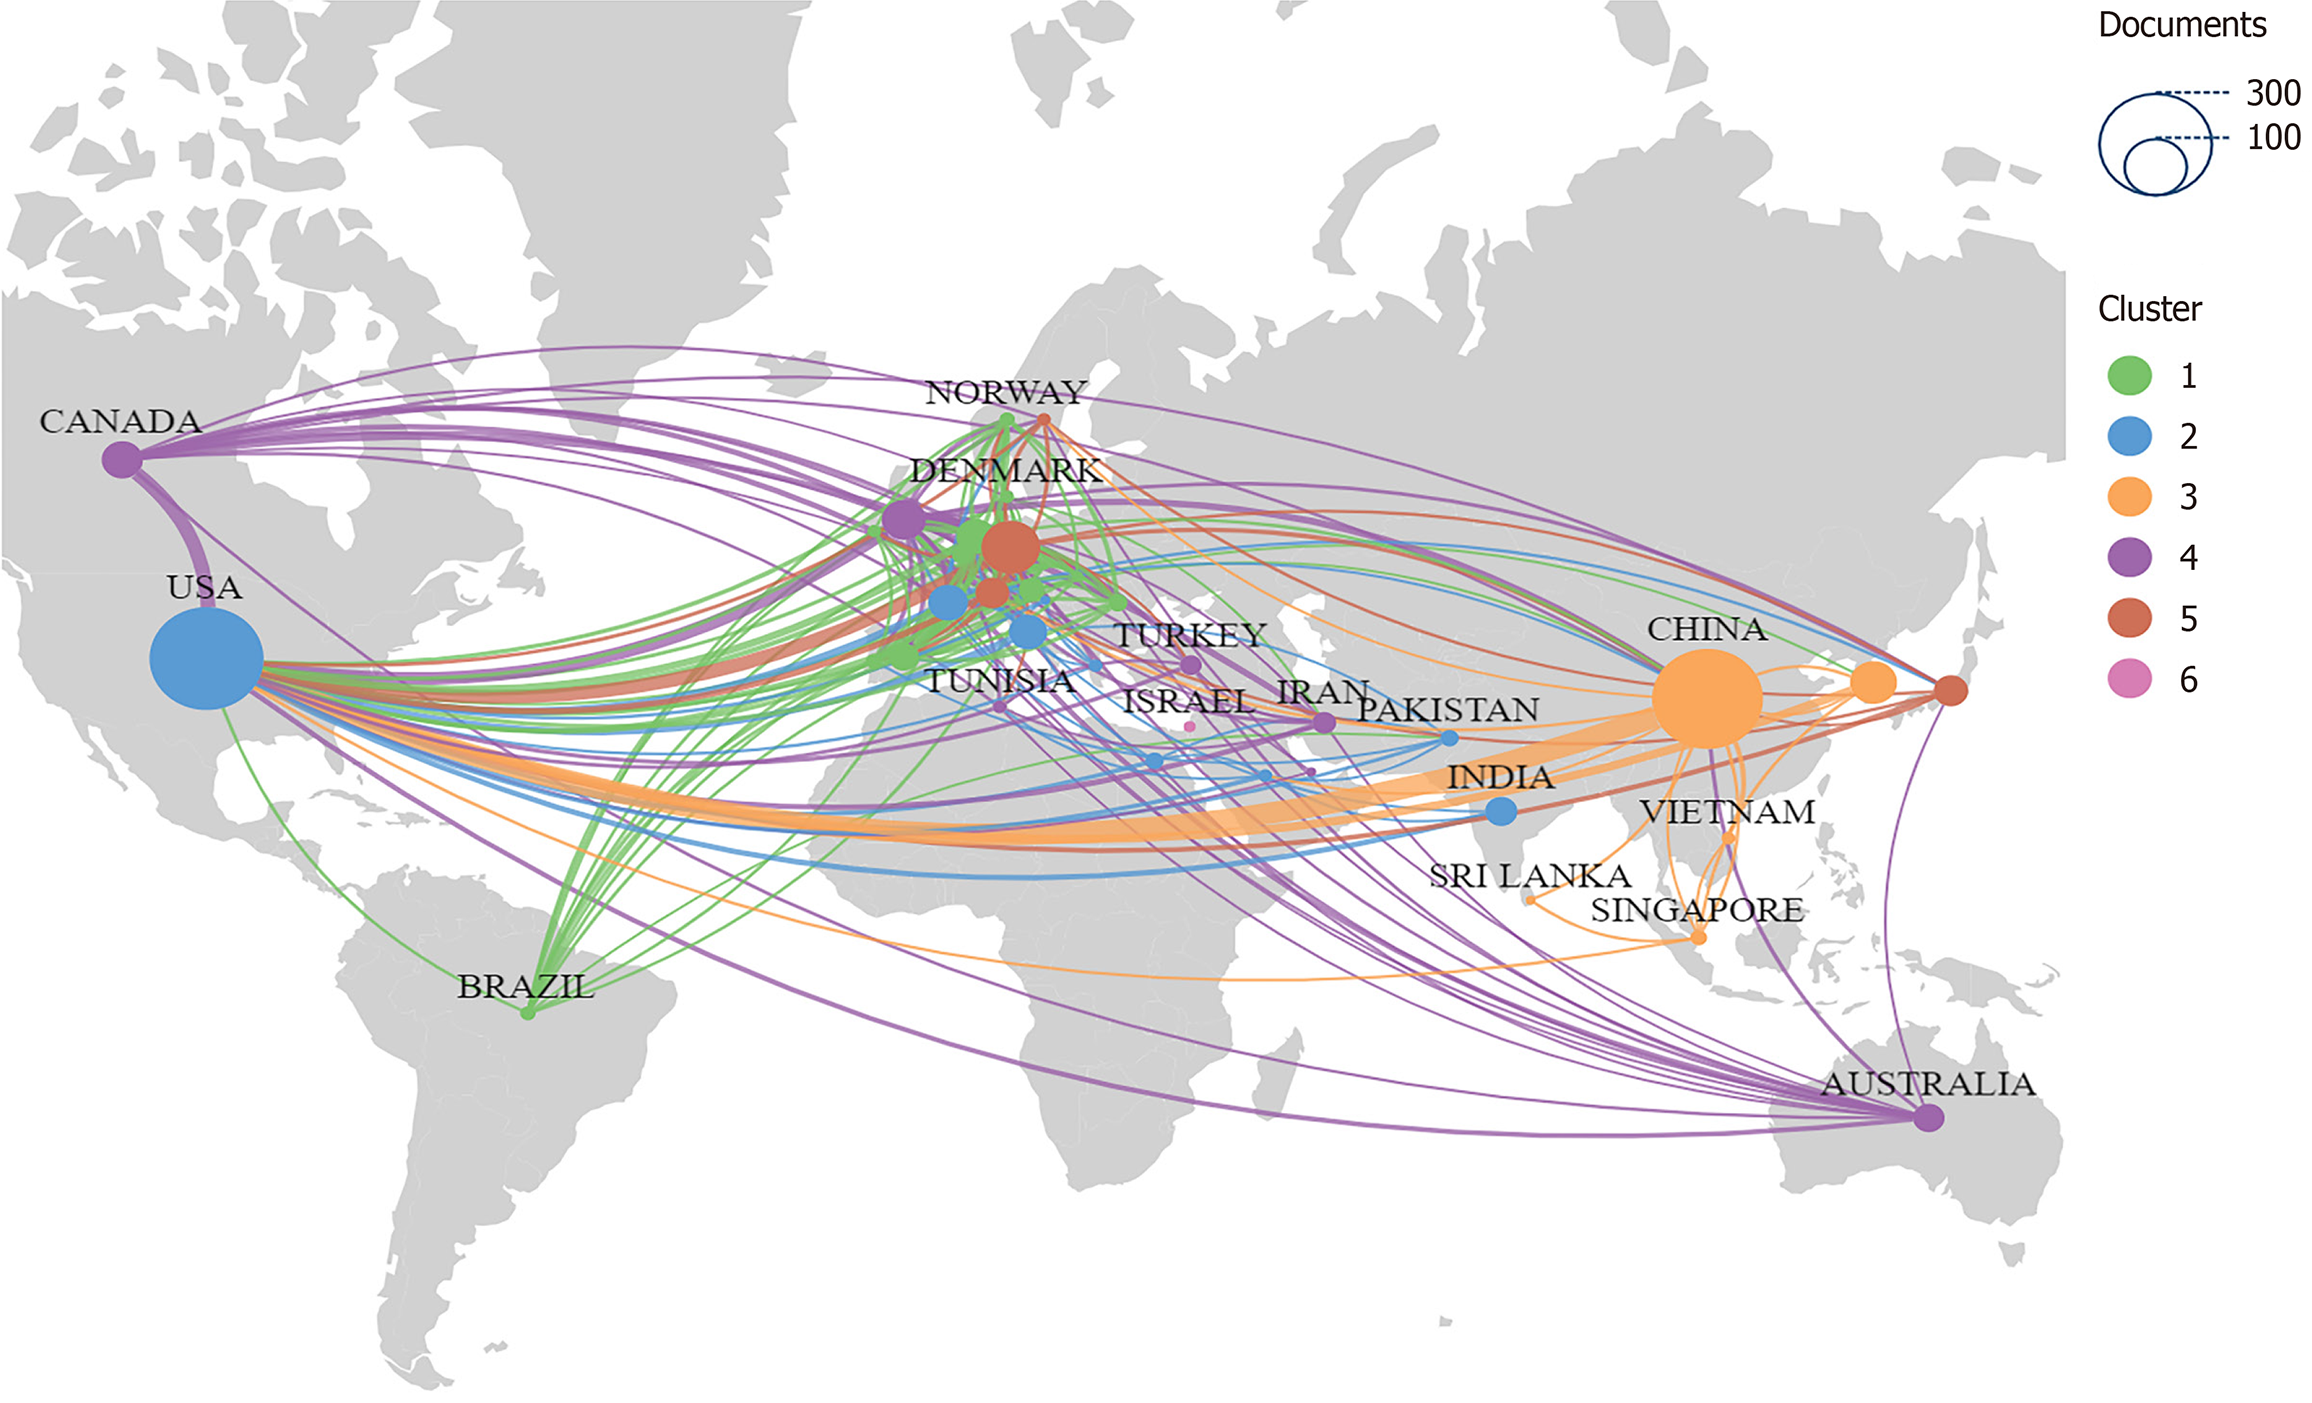
Figure 3 Inter-country cooperation network map.
The size of the nodes indicates the amount of publications, and the thickness of the lines represents the intensity of cooperation.
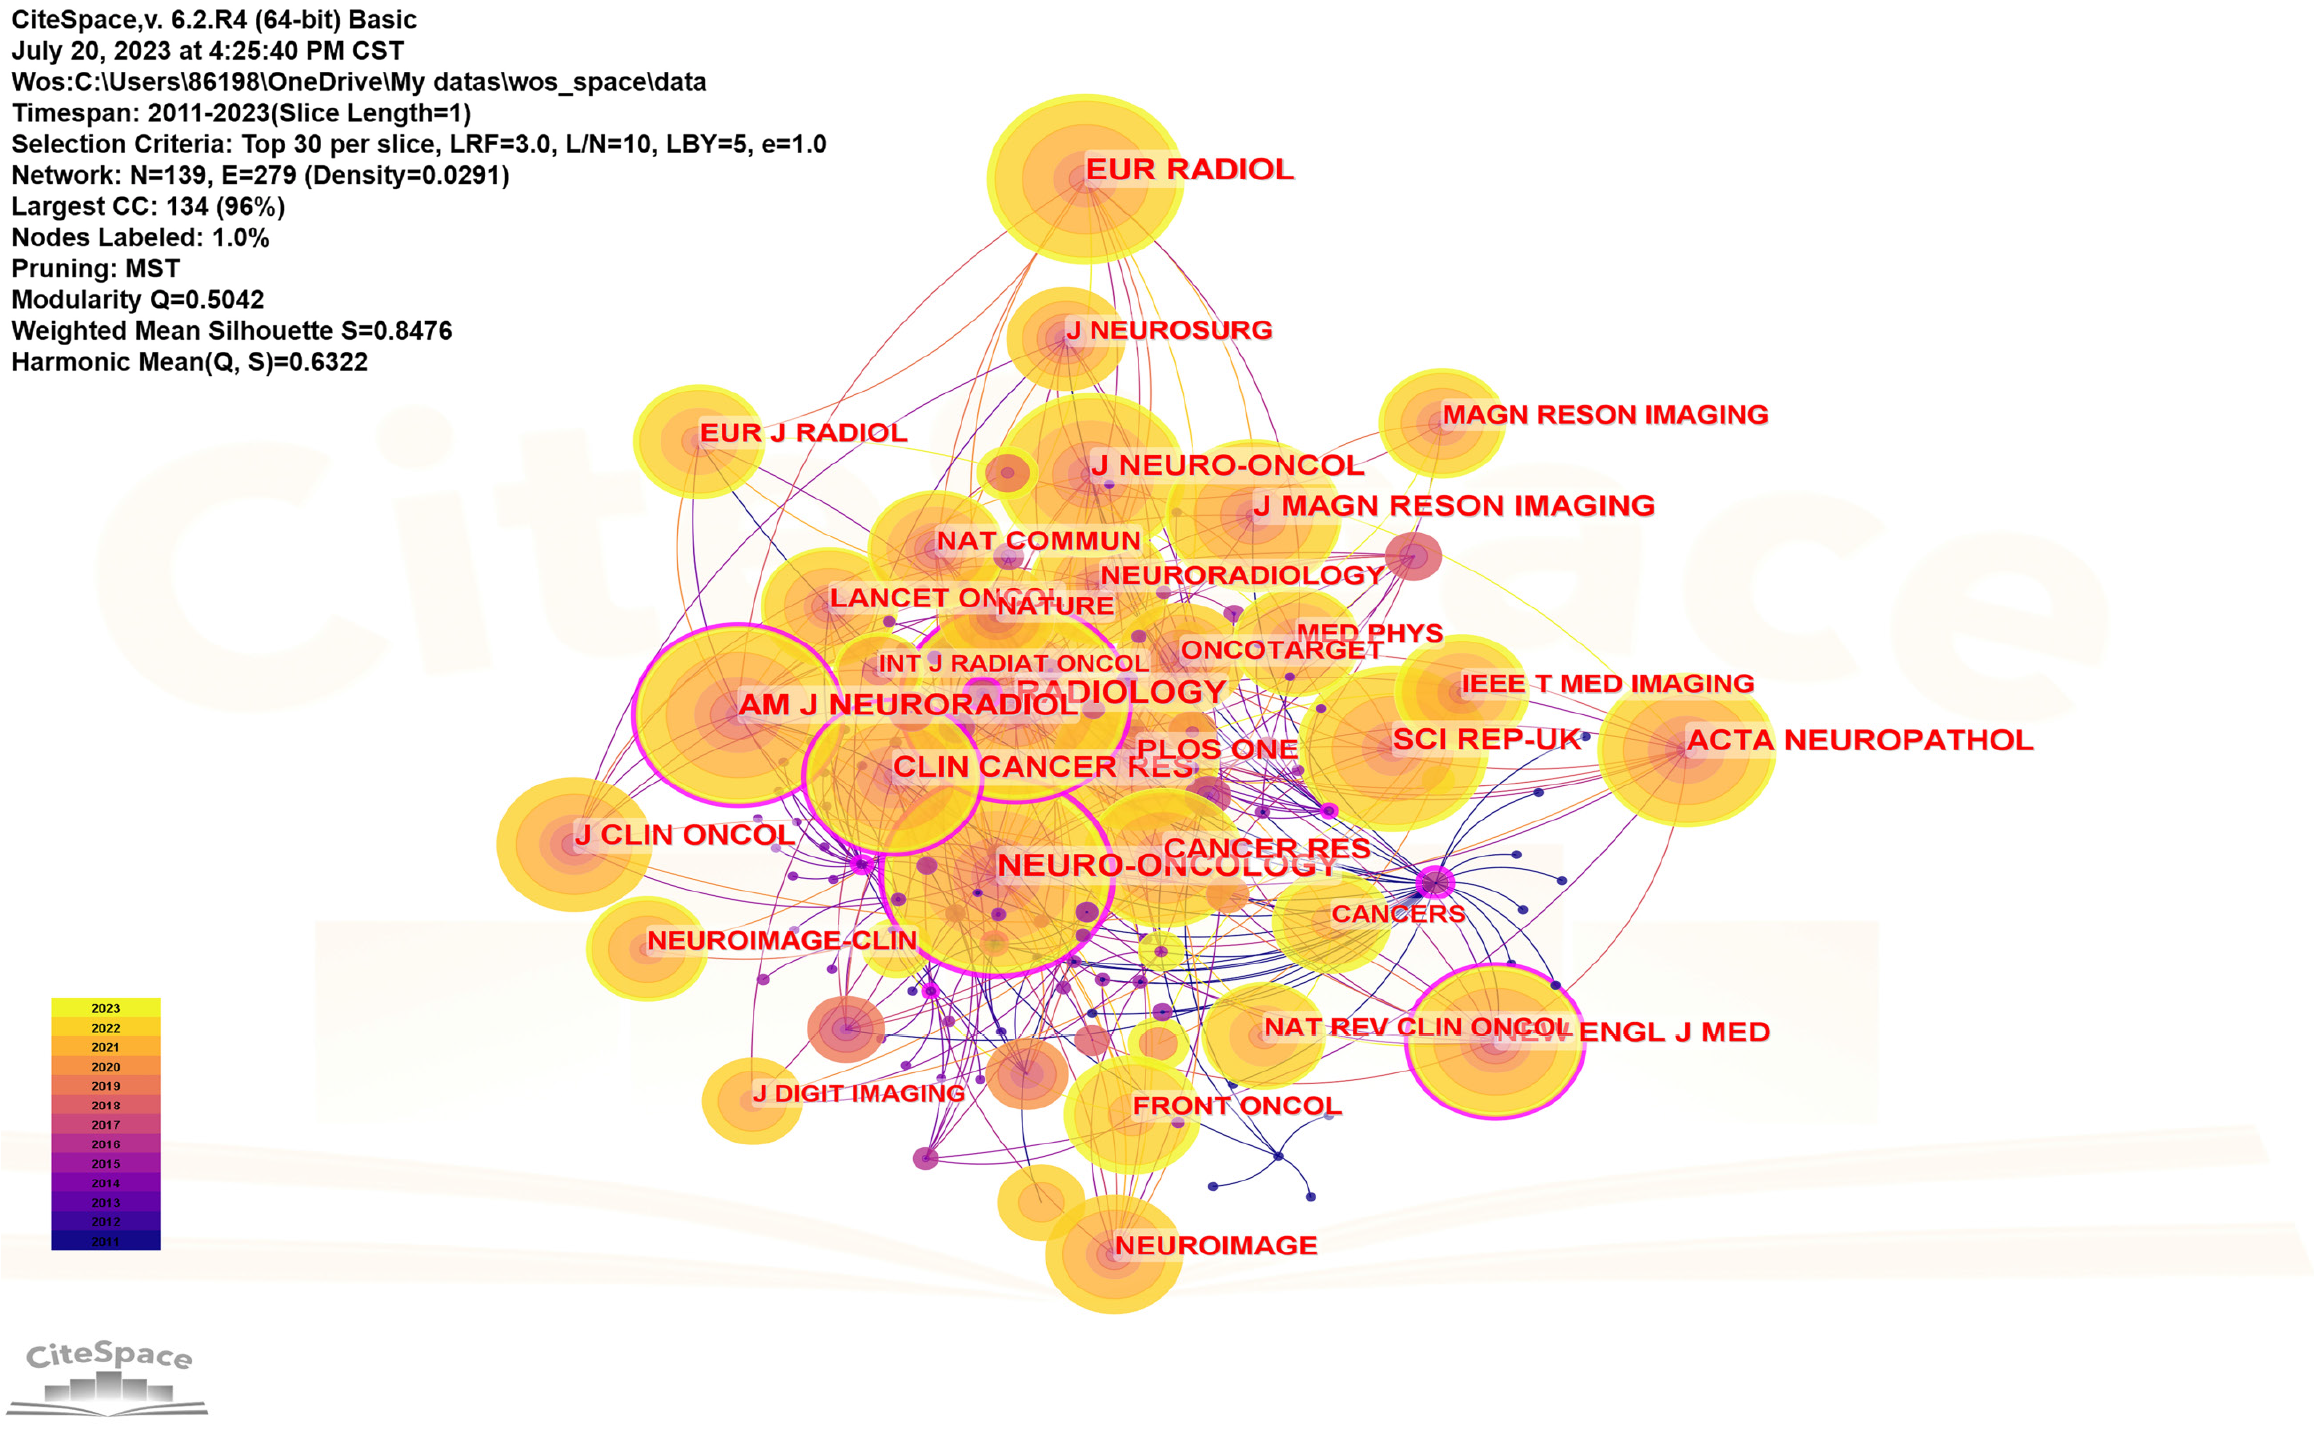
Figure 4 Co-occurrence network analysis of top journals.
The lines represent partnerships, and different colors represent different years of cooperation. Larger circles mean more publications.
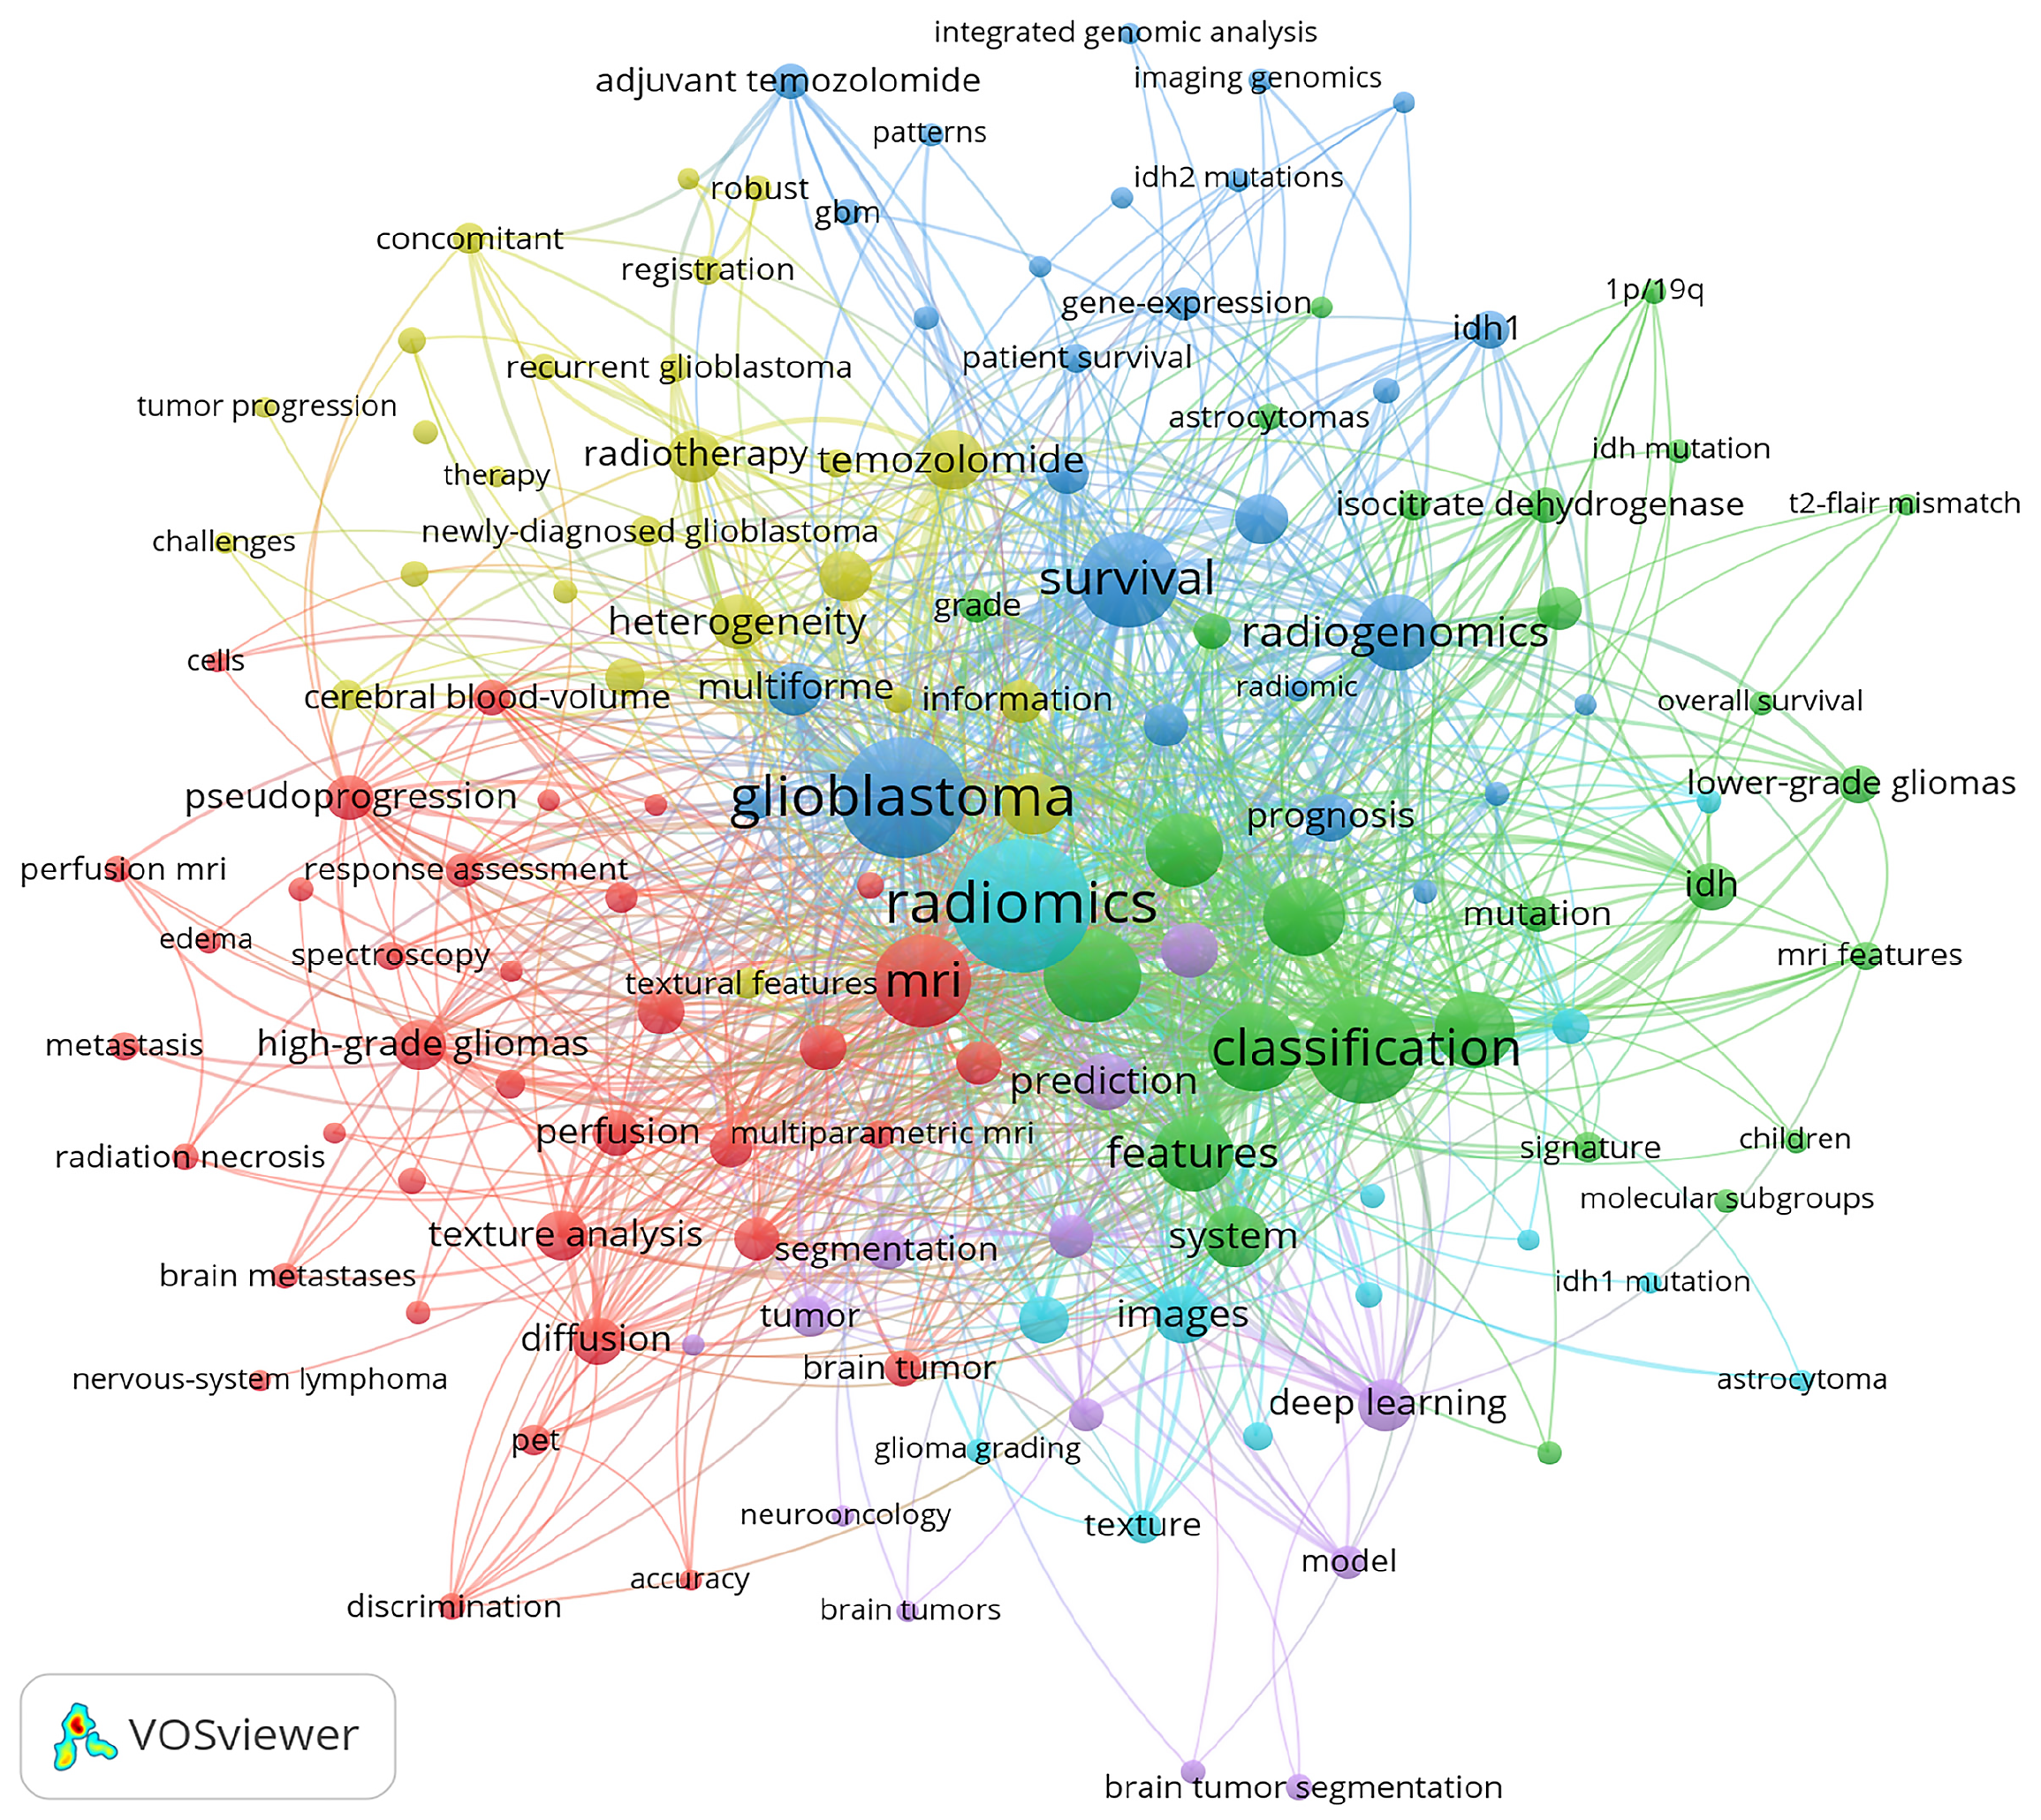
Figure 5
Co-occurrence network analysis of keywords regarding radiomics in glioma.
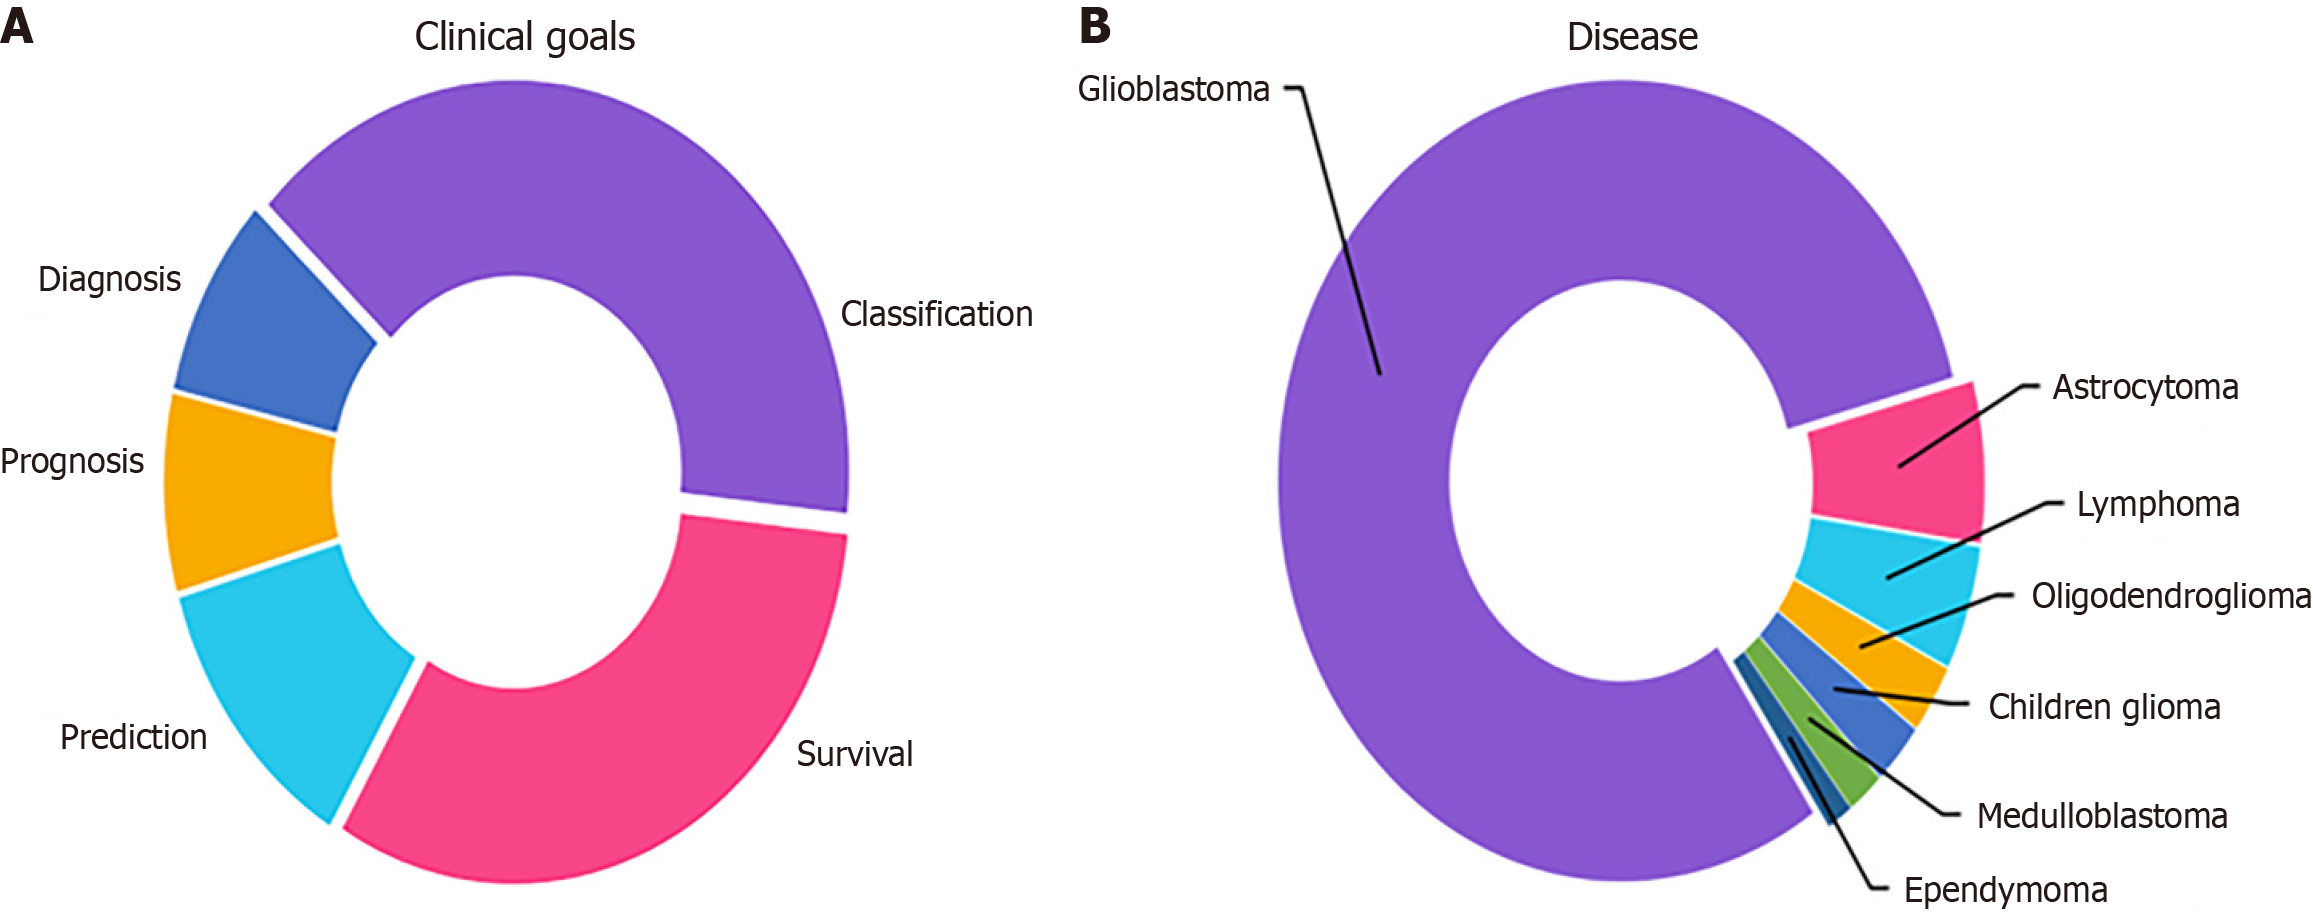
Figure 6 Analysis of keywords from clinical goals and disease types.
A: Distribution of publications by goal; B: Distribution of publications by disease category.
- Citation: Cao X, Xiong M, Liu Z, Yang J, Kan YB, Zhang LQ, Liu YH, Xie MG, Hu XF. Update report on the quality of gliomas radiomics: An integration of bibliometric and radiomics quality score. World J Radiol 2024; 16(12): 794-805
- URL: https://www.wjgnet.com/1949-8470/full/v16/i12/794.htm
- DOI: https://dx.doi.org/10.4329/wjr.v16.i12.794


