Copyright
©The Author(s) 2024.
World J Radiol. Dec 28, 2024; 16(12): 722-748
Published online Dec 28, 2024. doi: 10.4329/wjr.v16.i12.722
Published online Dec 28, 2024. doi: 10.4329/wjr.v16.i12.722
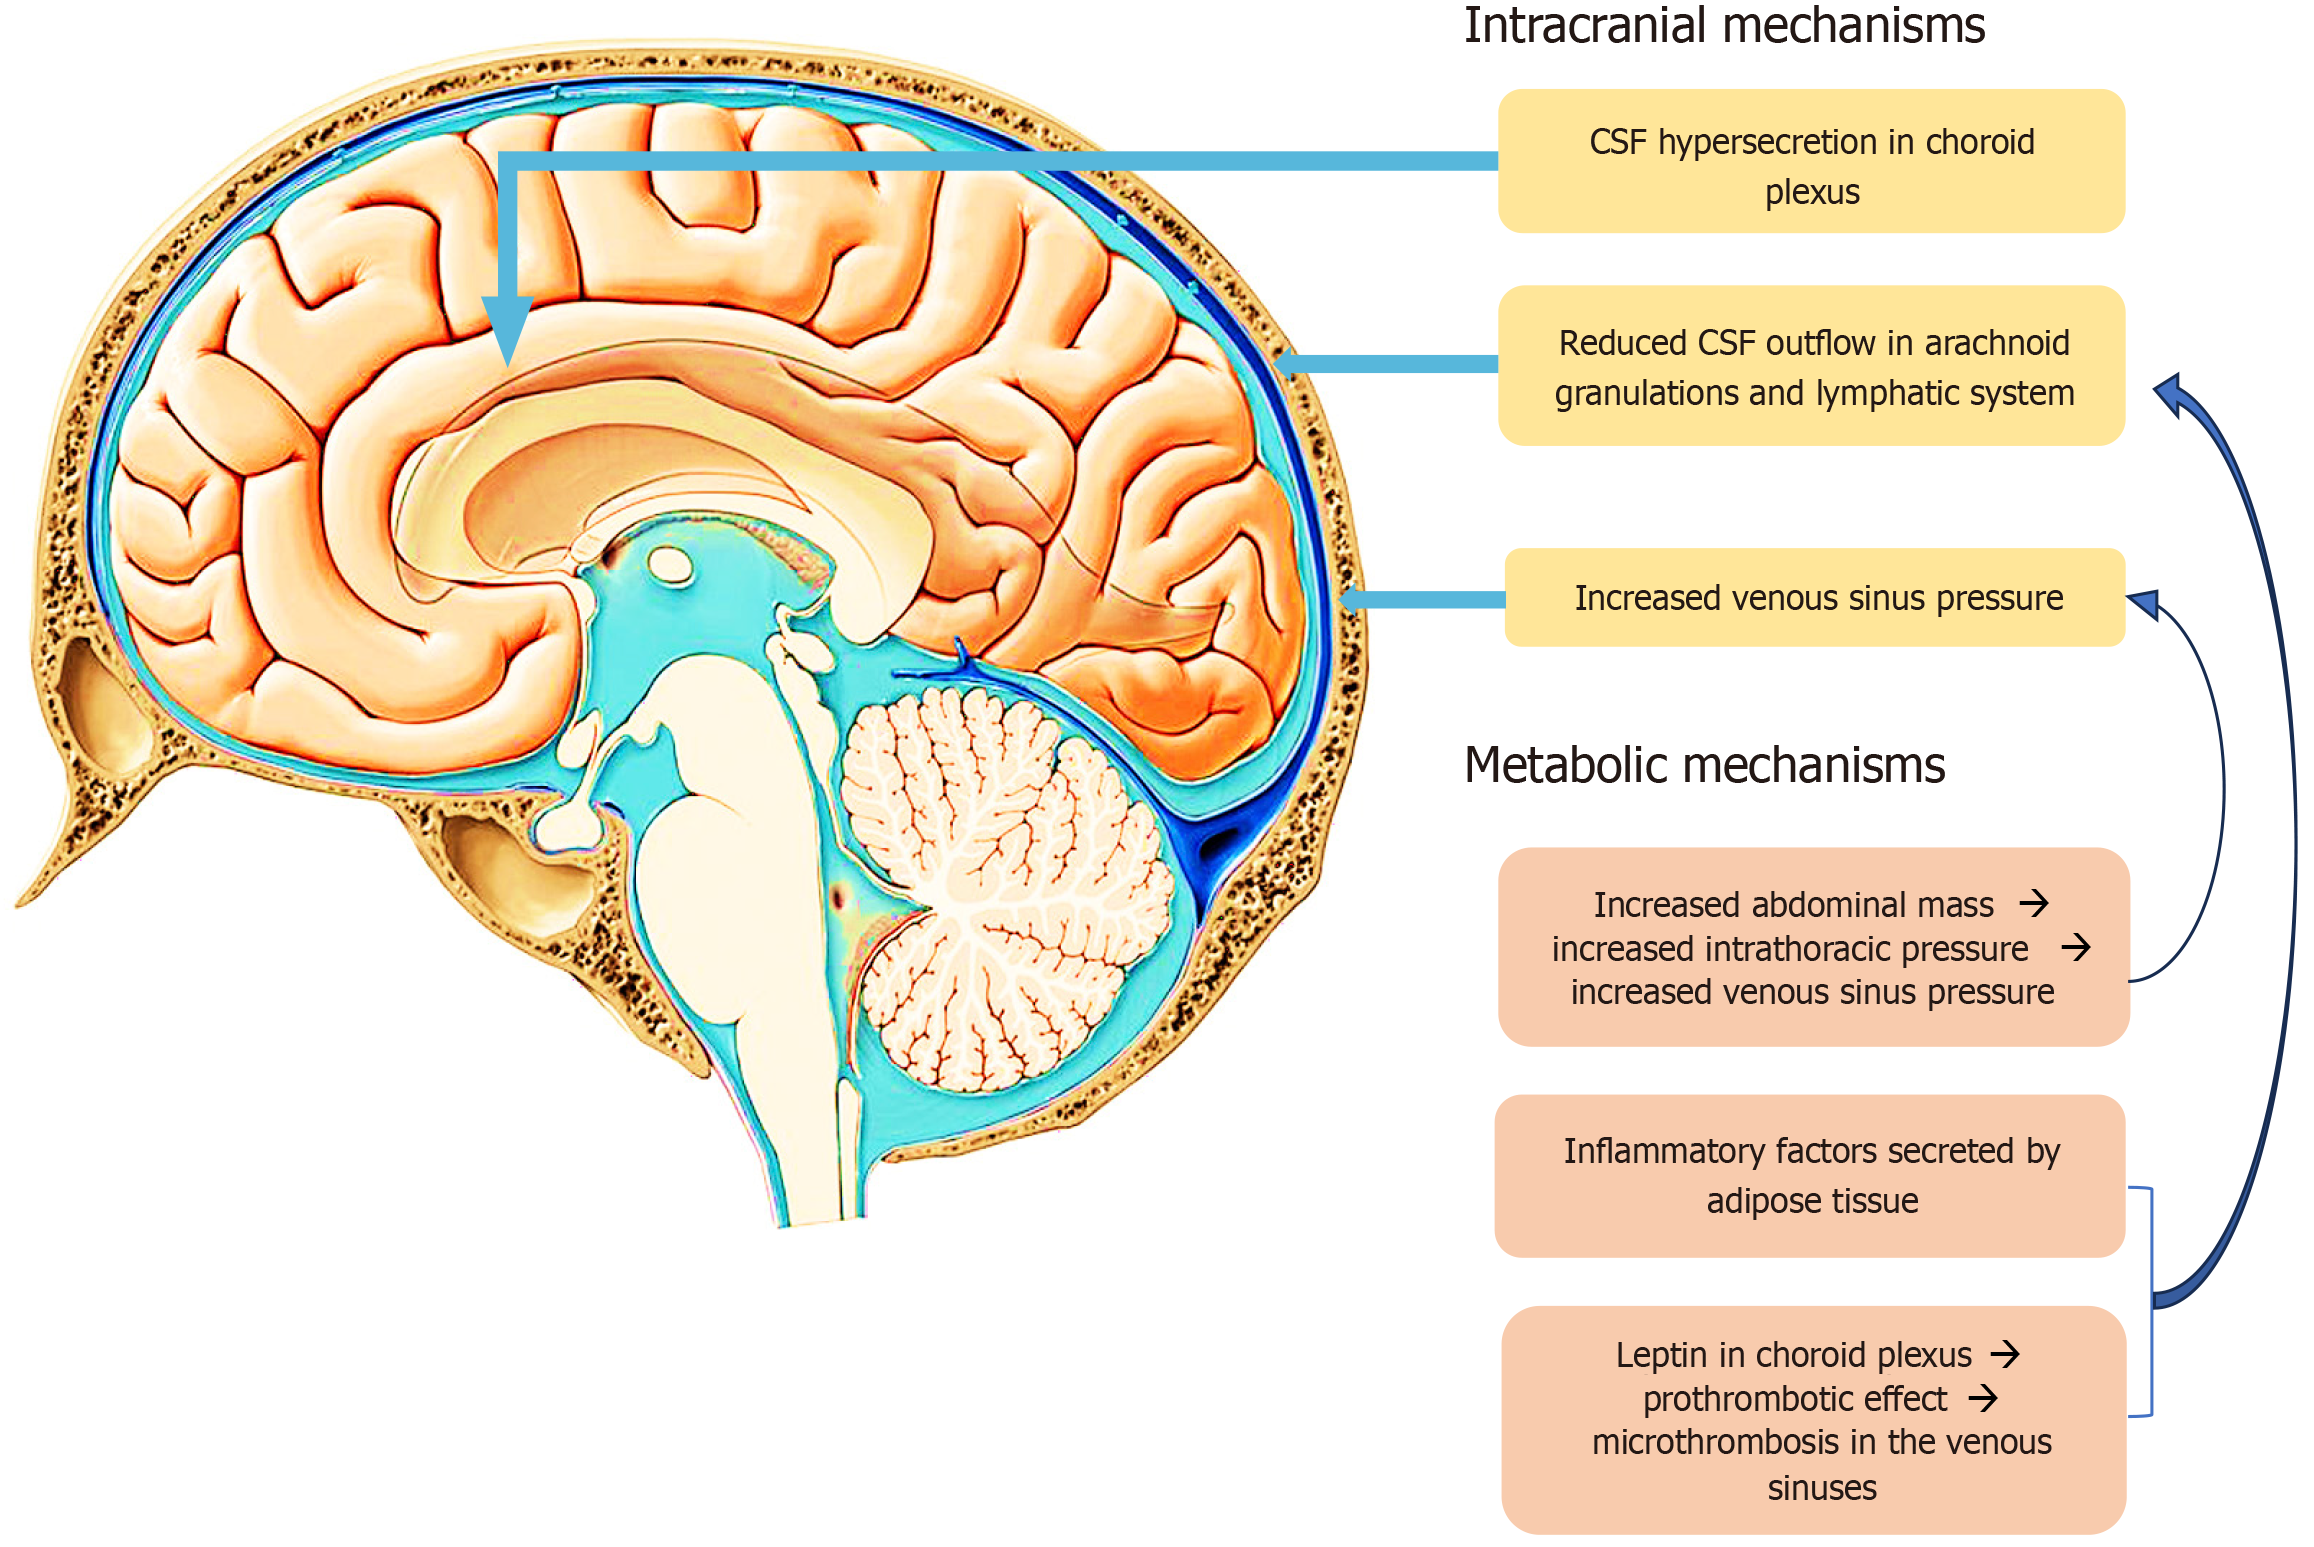
Figure 1 Intracranial and metabolic mechanisms, considered to cause elevated intracranial pressure.
CSF: Cerebrospinal fluid.
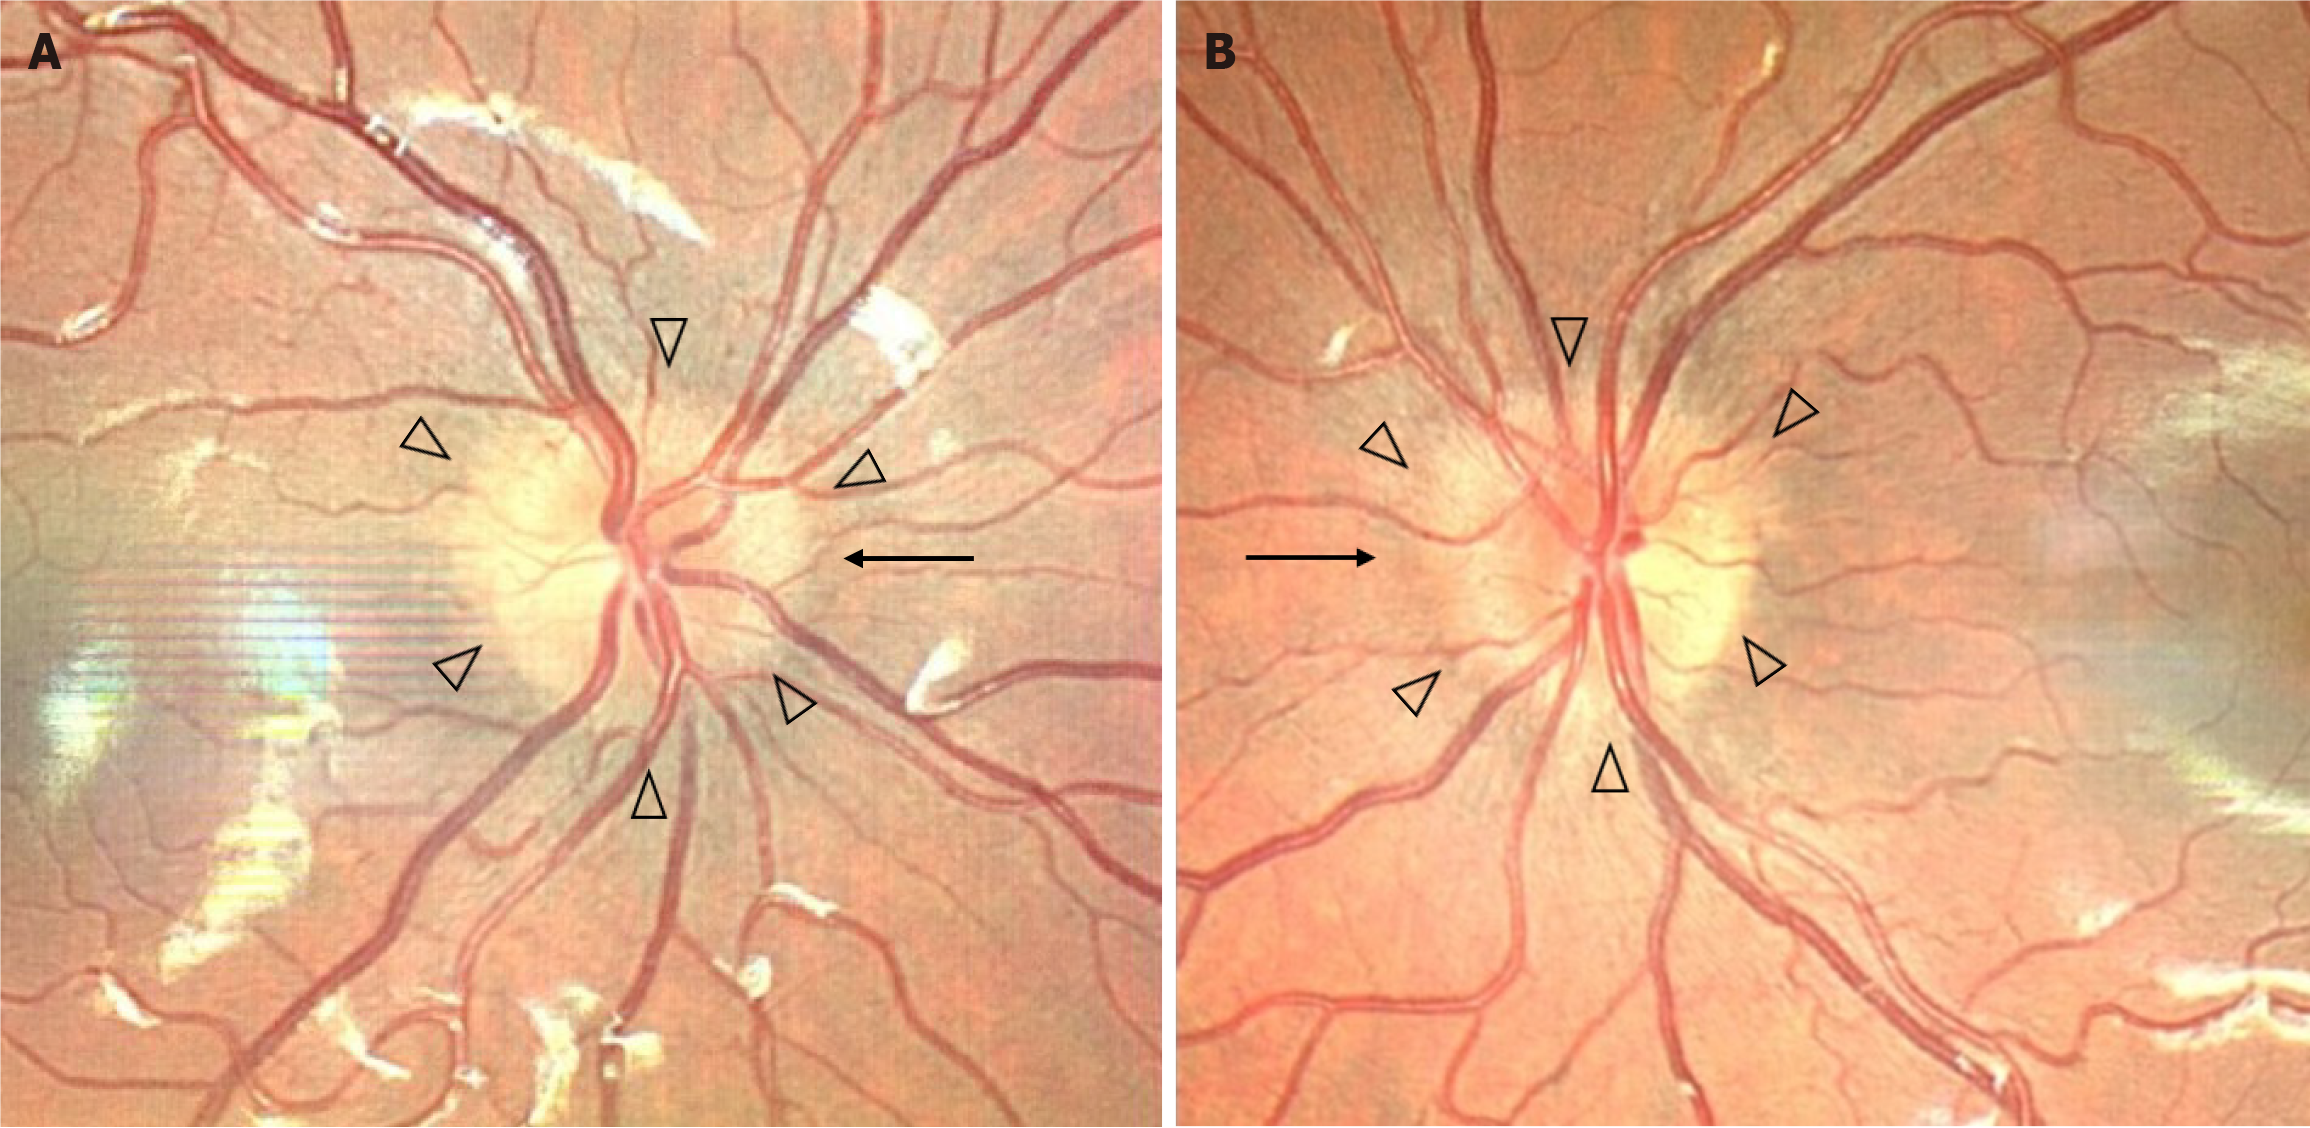
Figure 2 Photos of the A: right and B: left optic nerve heads of a patient suffering from papilledema due to idiopathic intracranial hypertension.
A: Photos of the right optic nerve heads; B: Photos of the left optic nerve heads. Elevation of the disc borders is noted (black arrowheads) as well as obscuration of the nasal optic disc border (black arrow). A circumferential halo is also present in both eyes. A diagnosis of early papilledema was set.
Figure 3 Partially empty sella and empty sella.
The figure displays T2-weighted sagittal images from magnetic resonance scans of different patients. A: A normal pituitary gland with normal height and a convex upper border is presented for reference (dashed circle); B: A pituitary gland with partial height loss, indicating a partially empty sella; C: An almost complete height loss of the pituitary gland, indicating an empty sella, are shown in patients with idiopathic intracranial hypertension (dashed circle). Note how the increased intracranial pressure forces appear to stretch the pituitary gland onto the sella turcica (arrows).
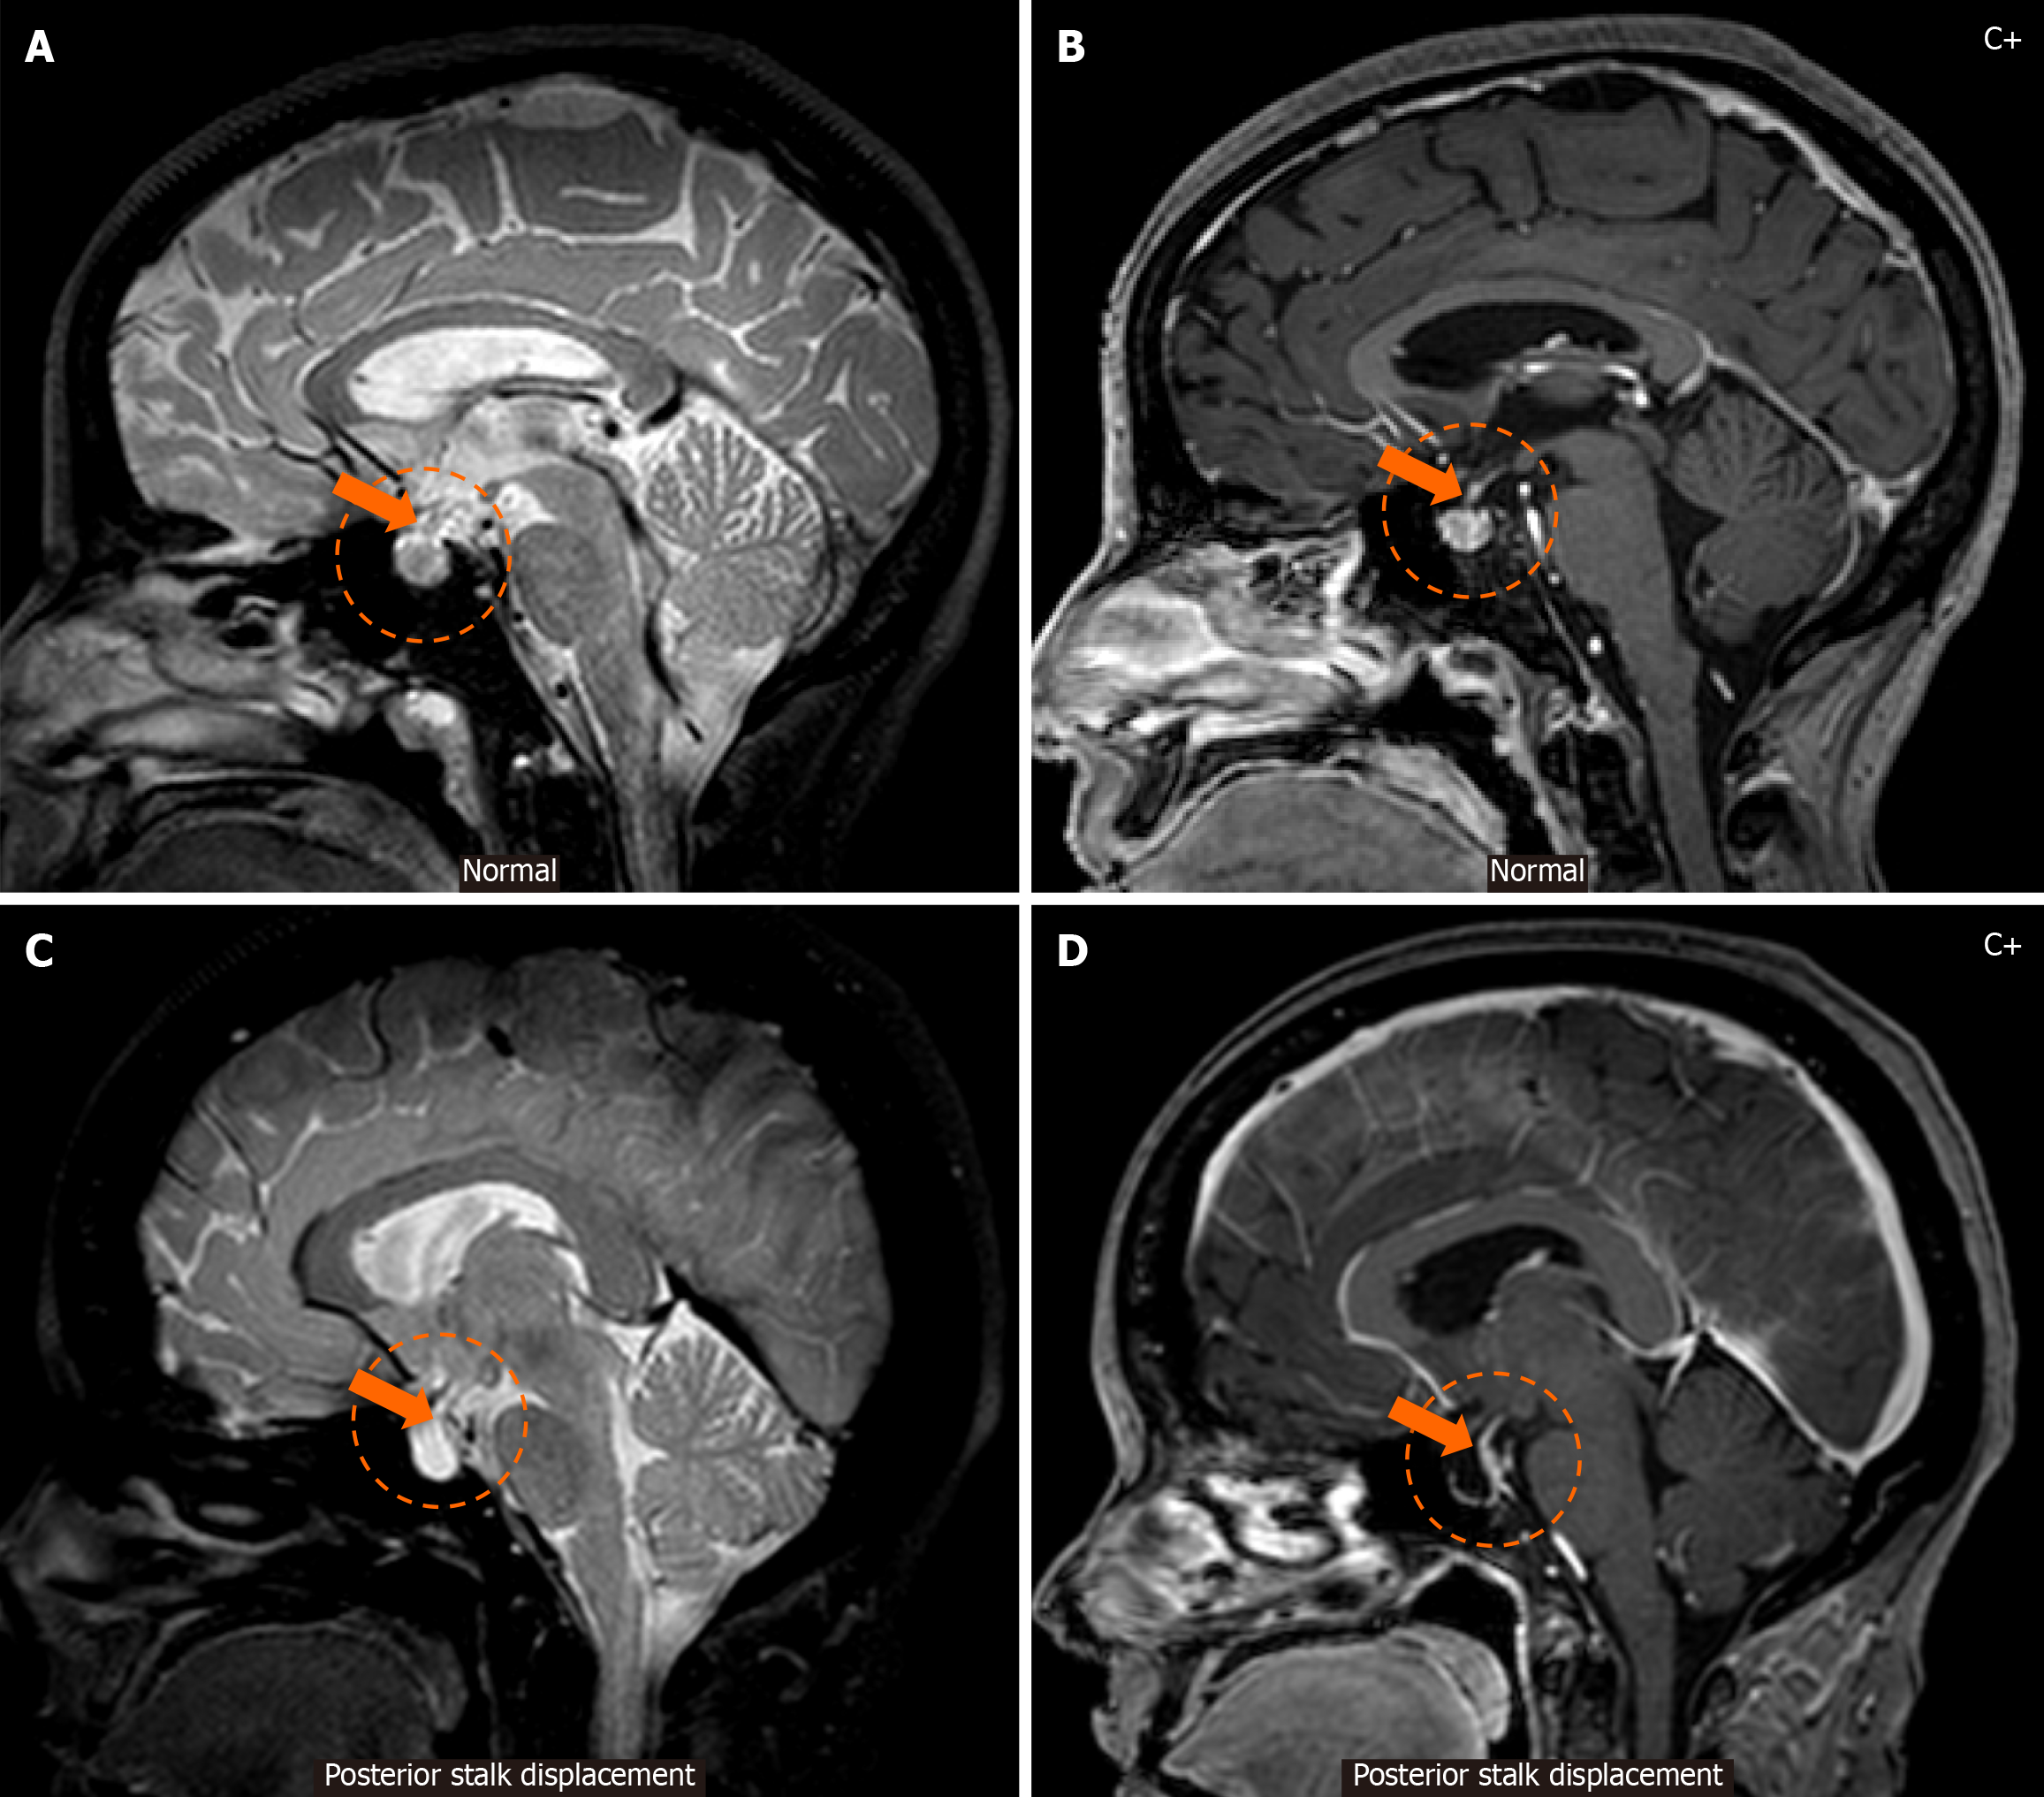
Figure 4 Posterior displacement of the pituitary stalk.
A and B: Sagittal T2-weighted (A) and contrast-enhanced T1-weighted (B) magnetic resonance images display a pituitary gland of normal dimensions and shape (dashed circle) and a pituitary stalk with normal positioning (arrow); C and D: Sagittal T2-weighted (C) and contrast-enhanced T1-weighted (D) magnetic resonance images of a patient with idiopathic intracranial hypertension display an empty sella (dashed circle) and posterior displacement of the pituitary stalk (arrow), which appears to be pressed against the dorsum sellae as a result of the increased intracranial pressure forces.
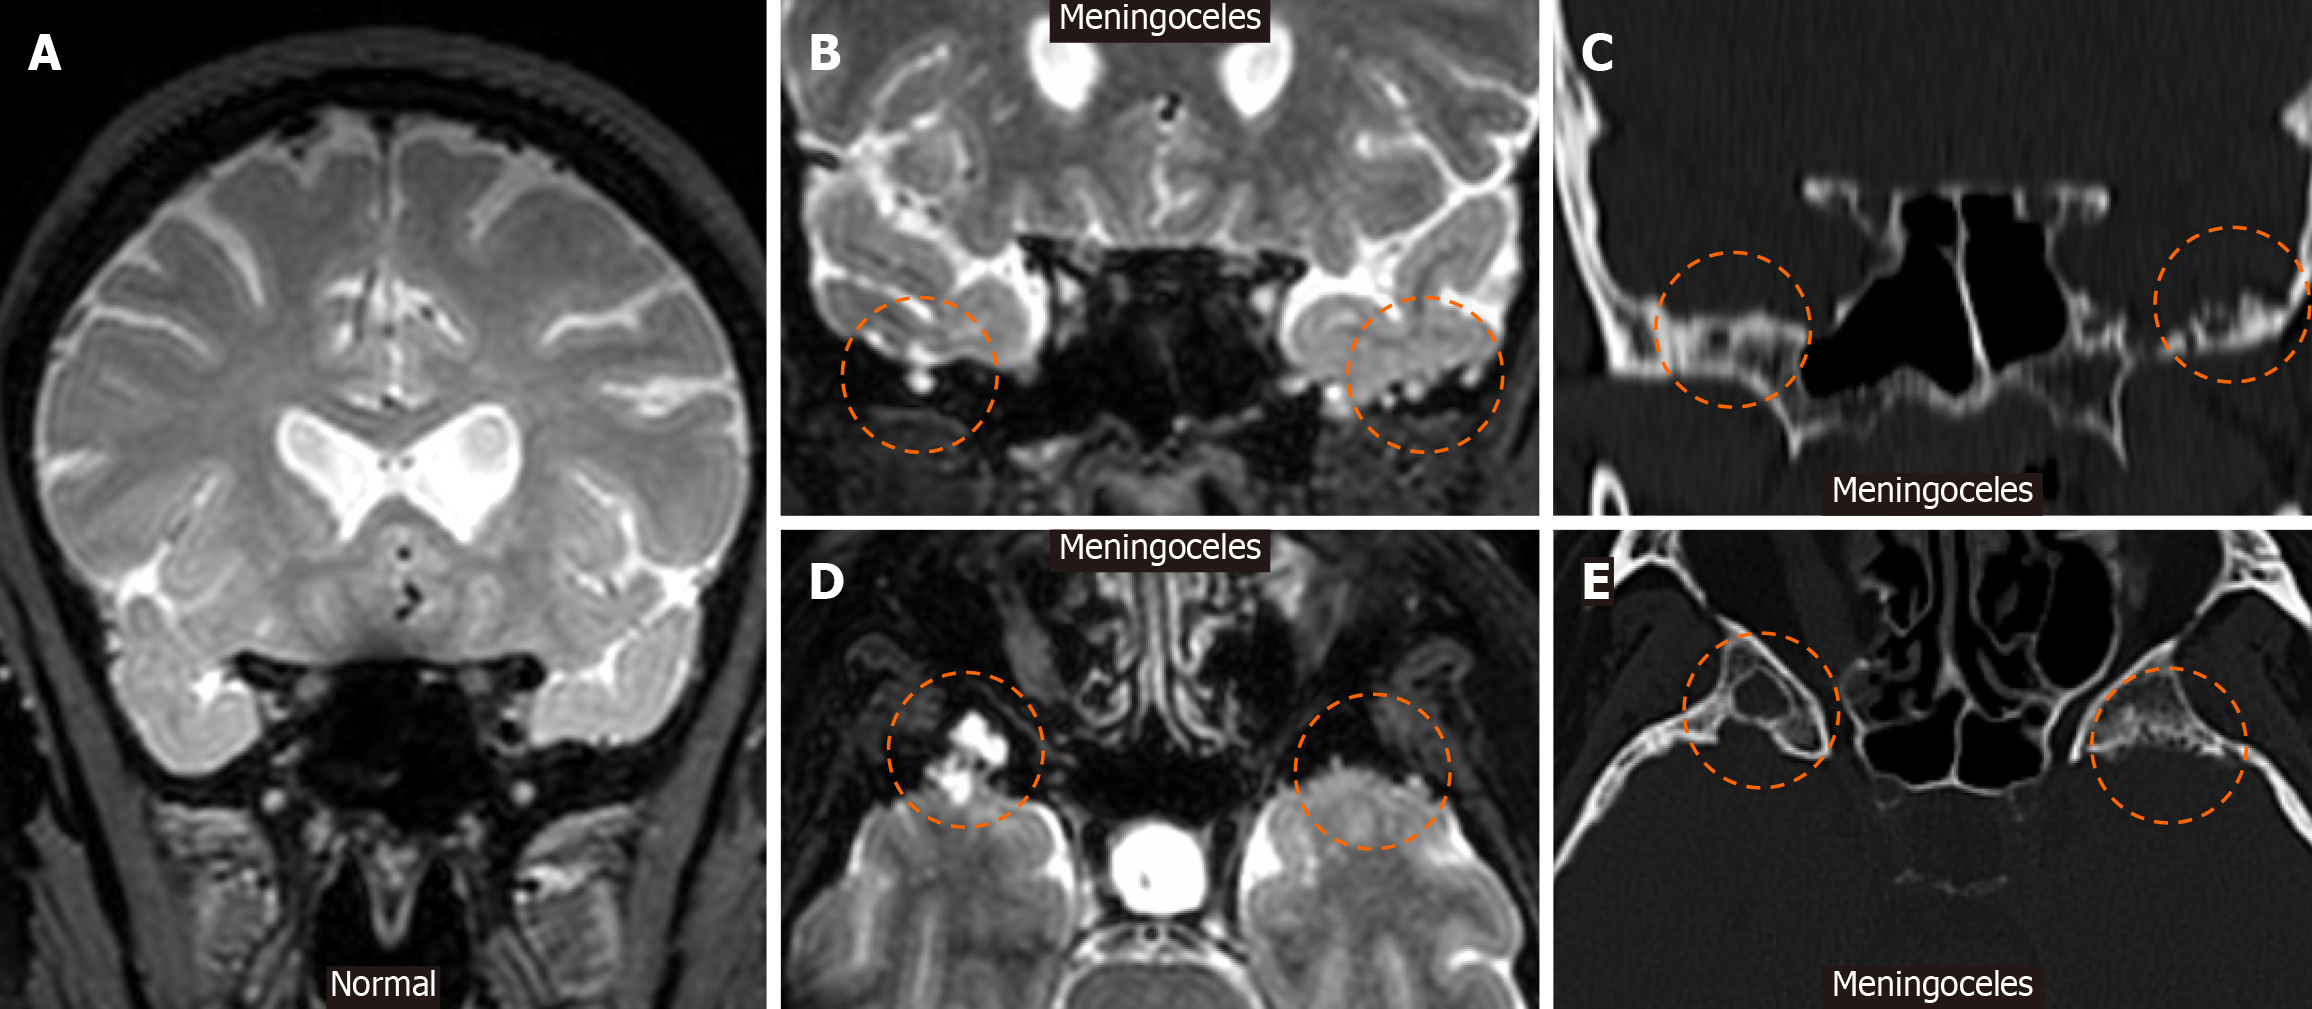
Figure 5 Meningoceles.
A: Coronal T2-weighted magnetic resonance image is shown displaying a normal temporal bone; B and C: A coronal T2-weighted image (B) and corresponding coronal computed tomography (CT) image (C) of a patient with idiopathic intracranial hypertension demonstrates meningeal protrusions in the sphenoid wings, bilaterally (dashed circles), consistent with meningoceles; D and E: An axial T2-weighted image (D) and corresponding axial CT image (E) of a different patient with idiopathic intracranial hypertension also demonstrate meningeal protrusions (dashed circles), most evidently on the right sphenoid wing than on the left, findings that are consistent with meningoceles.
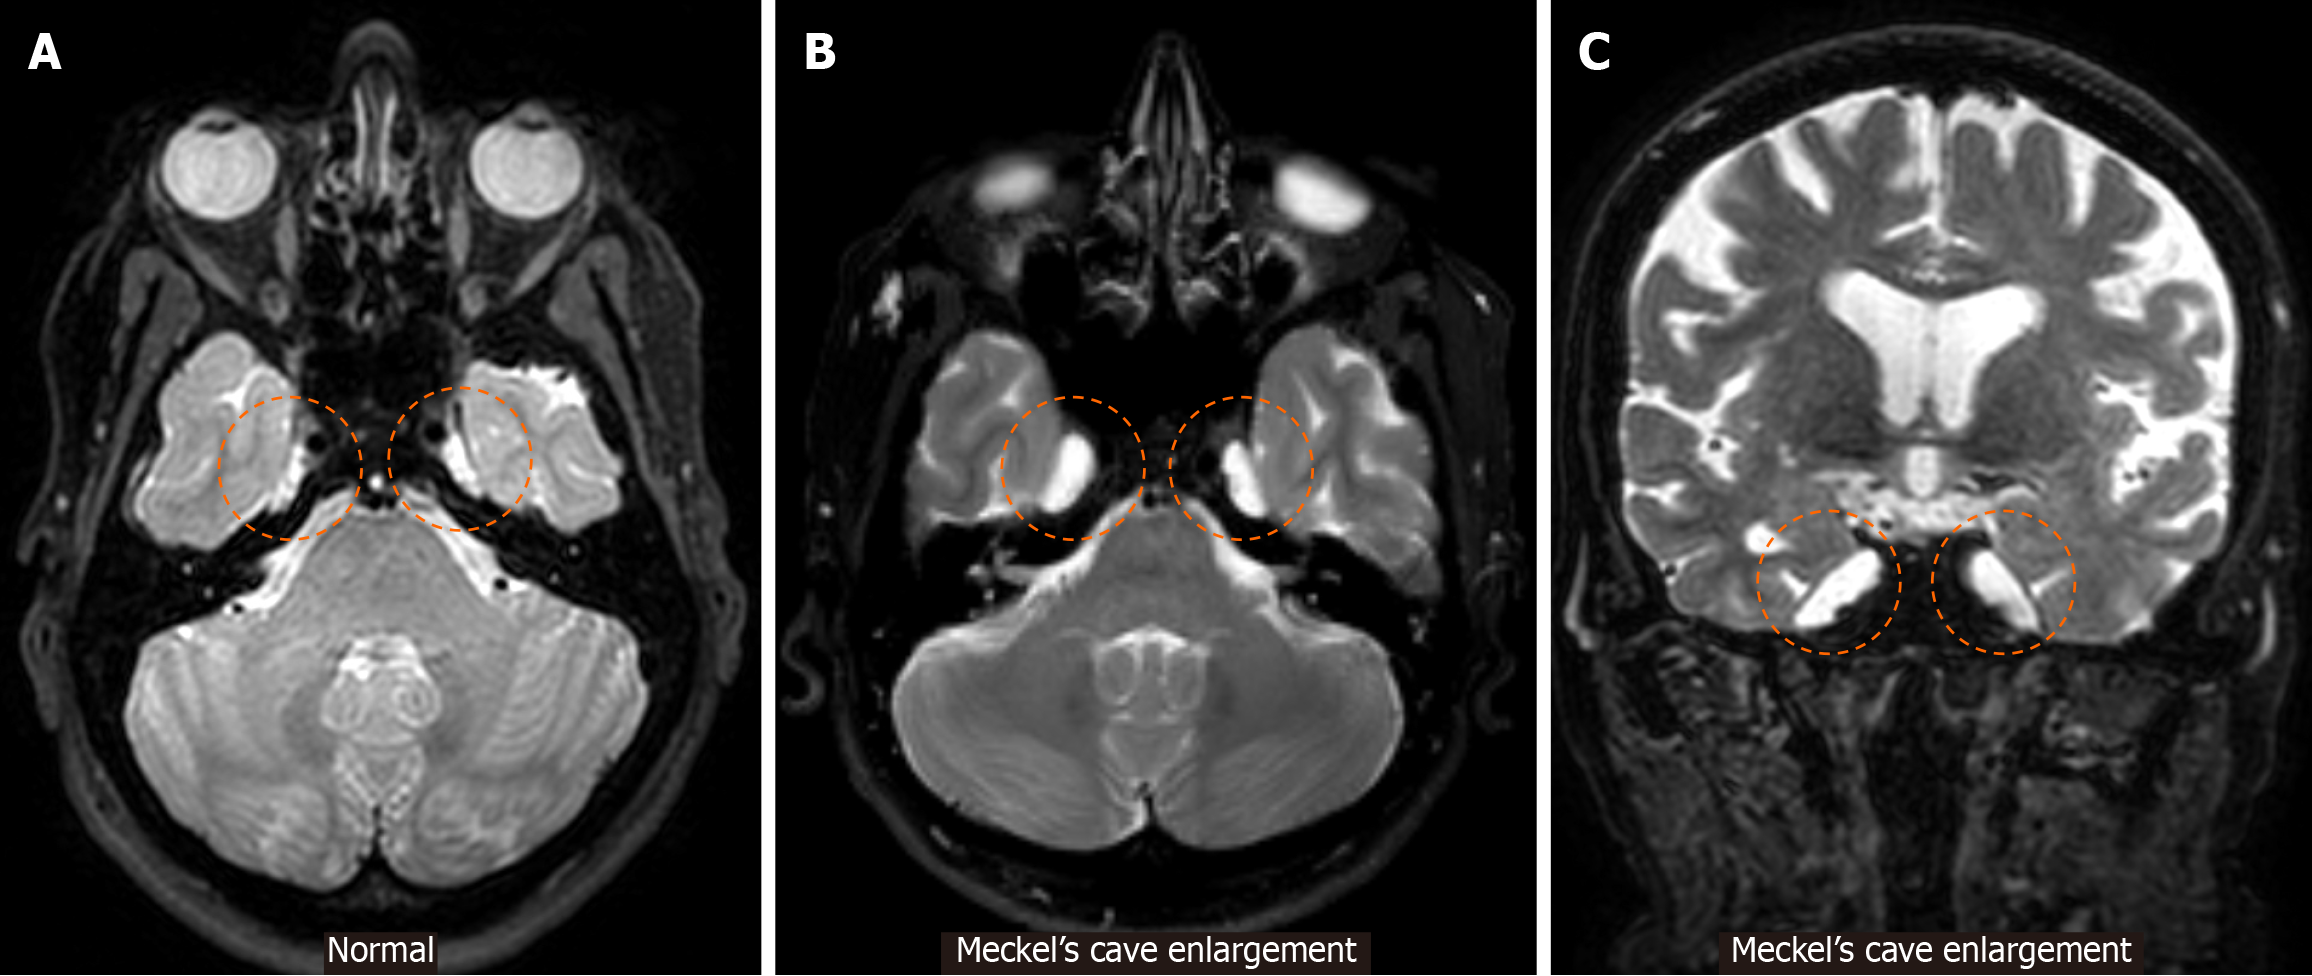
Figure 6 Meckel’s cave enlargement.
A: An axial T2-weighted magnetic resonance image demonstrating Meckel’s caves of normal caliber (dashed circles) is provided for reference; B: Axial; C: Coronal T2-weighted magnetic resonance images displaying bilaterally enlarged Meckel’s caves in different patients with idiopathic intracranial hypertension (dashed circles) are provided.
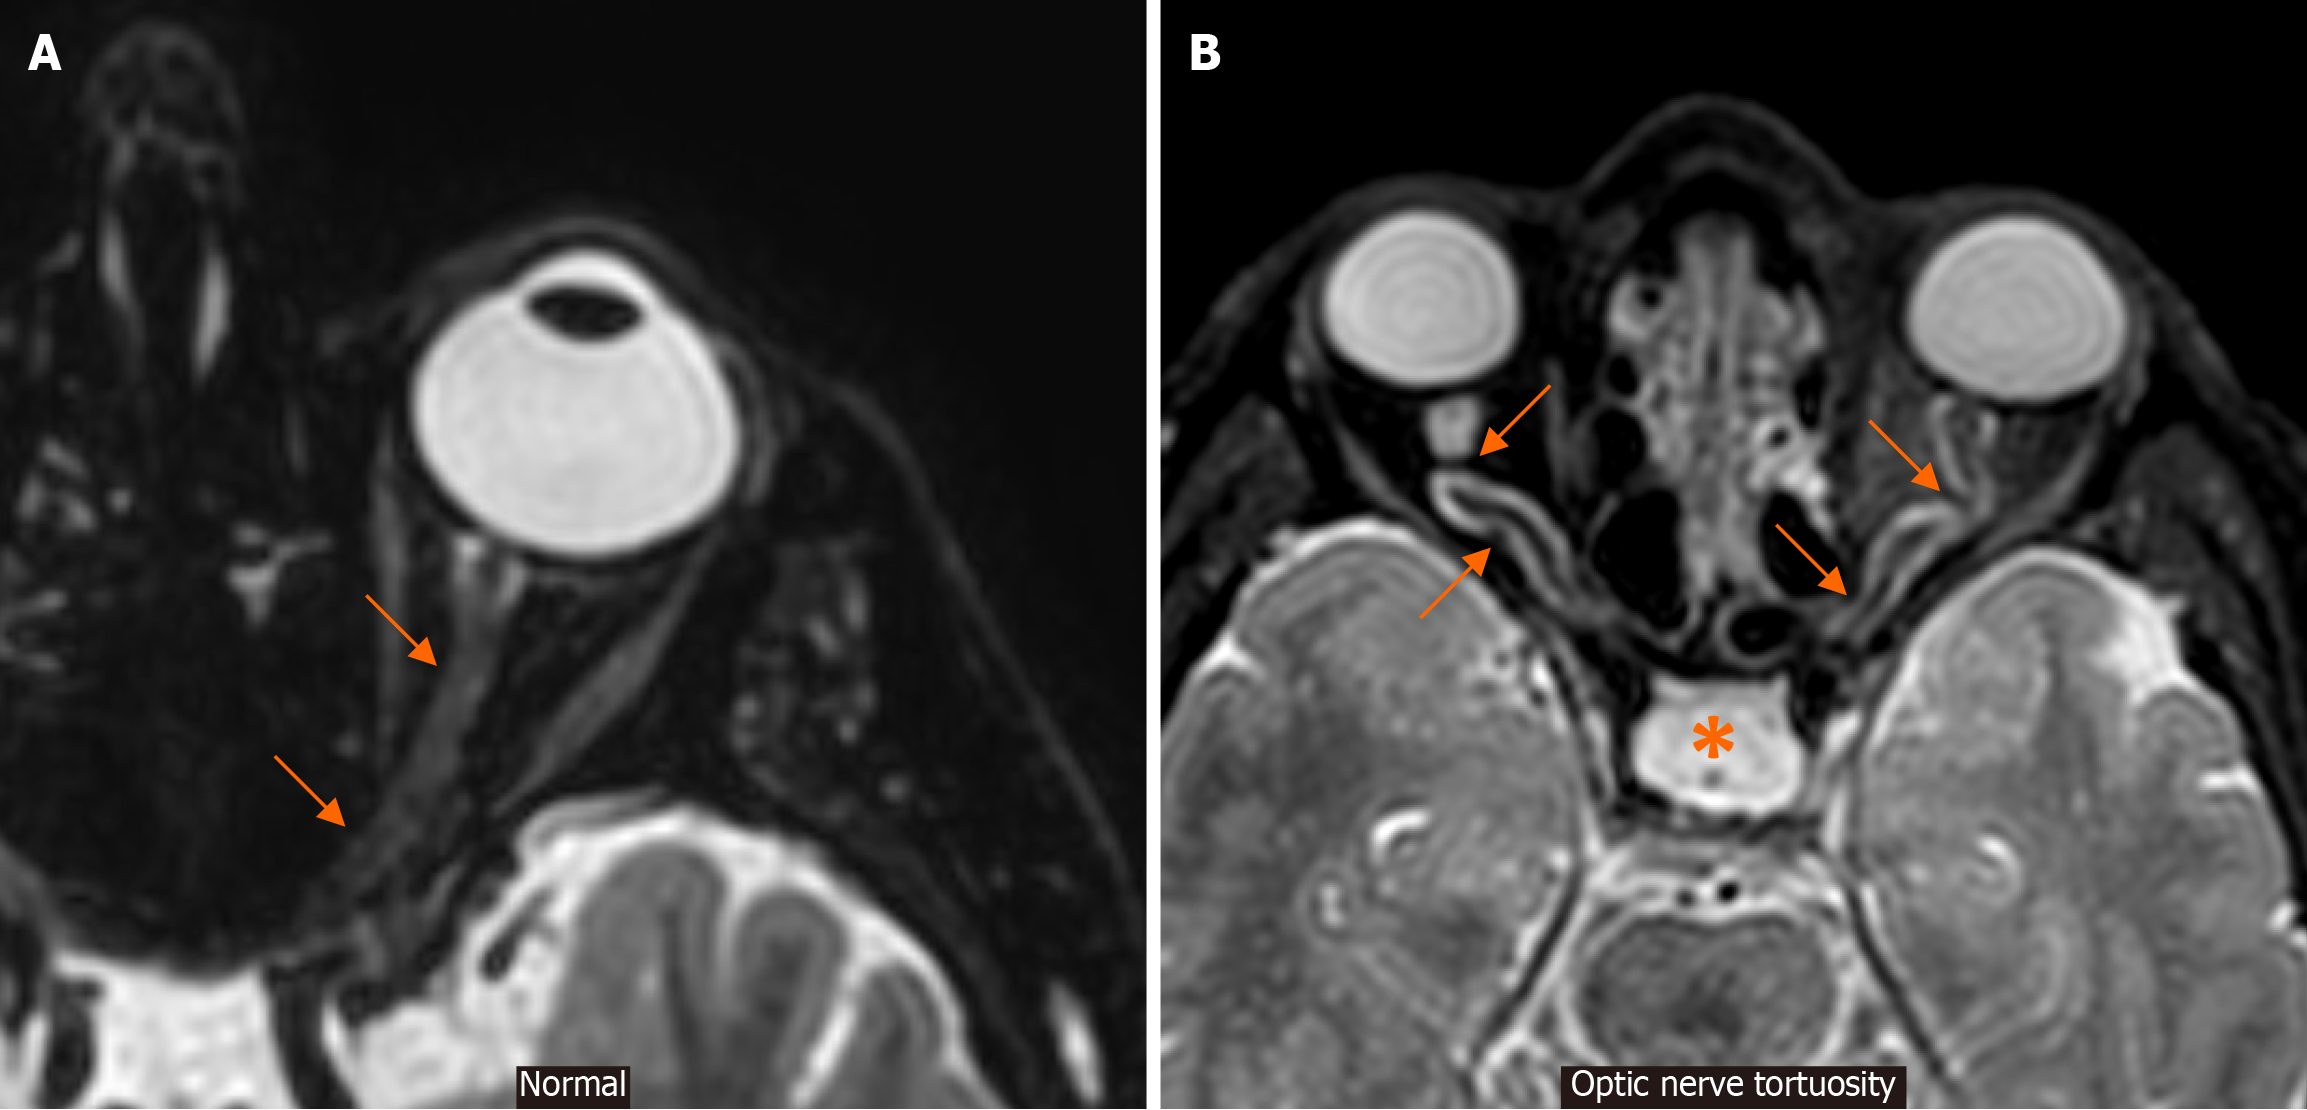
Figure 7 Optic nerve tortuosity.
A: An axial T2-weighted magnetic resonance image at the level of the globe and optic nerve in a patient with no intracranial hypertension signs or symptoms is provided for reference. Note the course of this normal-appearing optic nerve (arrows); B: An axial T2-weighted magnetic resonance image at the level of the globe and optic nerve in a patient with signs and symptoms of idiopathic intracranial hypertension demonstrates obvious tortuosity of the optic nerves in their intraorbital segments (arrows). Also note an empty sella appearance (*) and optic nerve sheath distension, representing additional signs supporting this diagnosis.
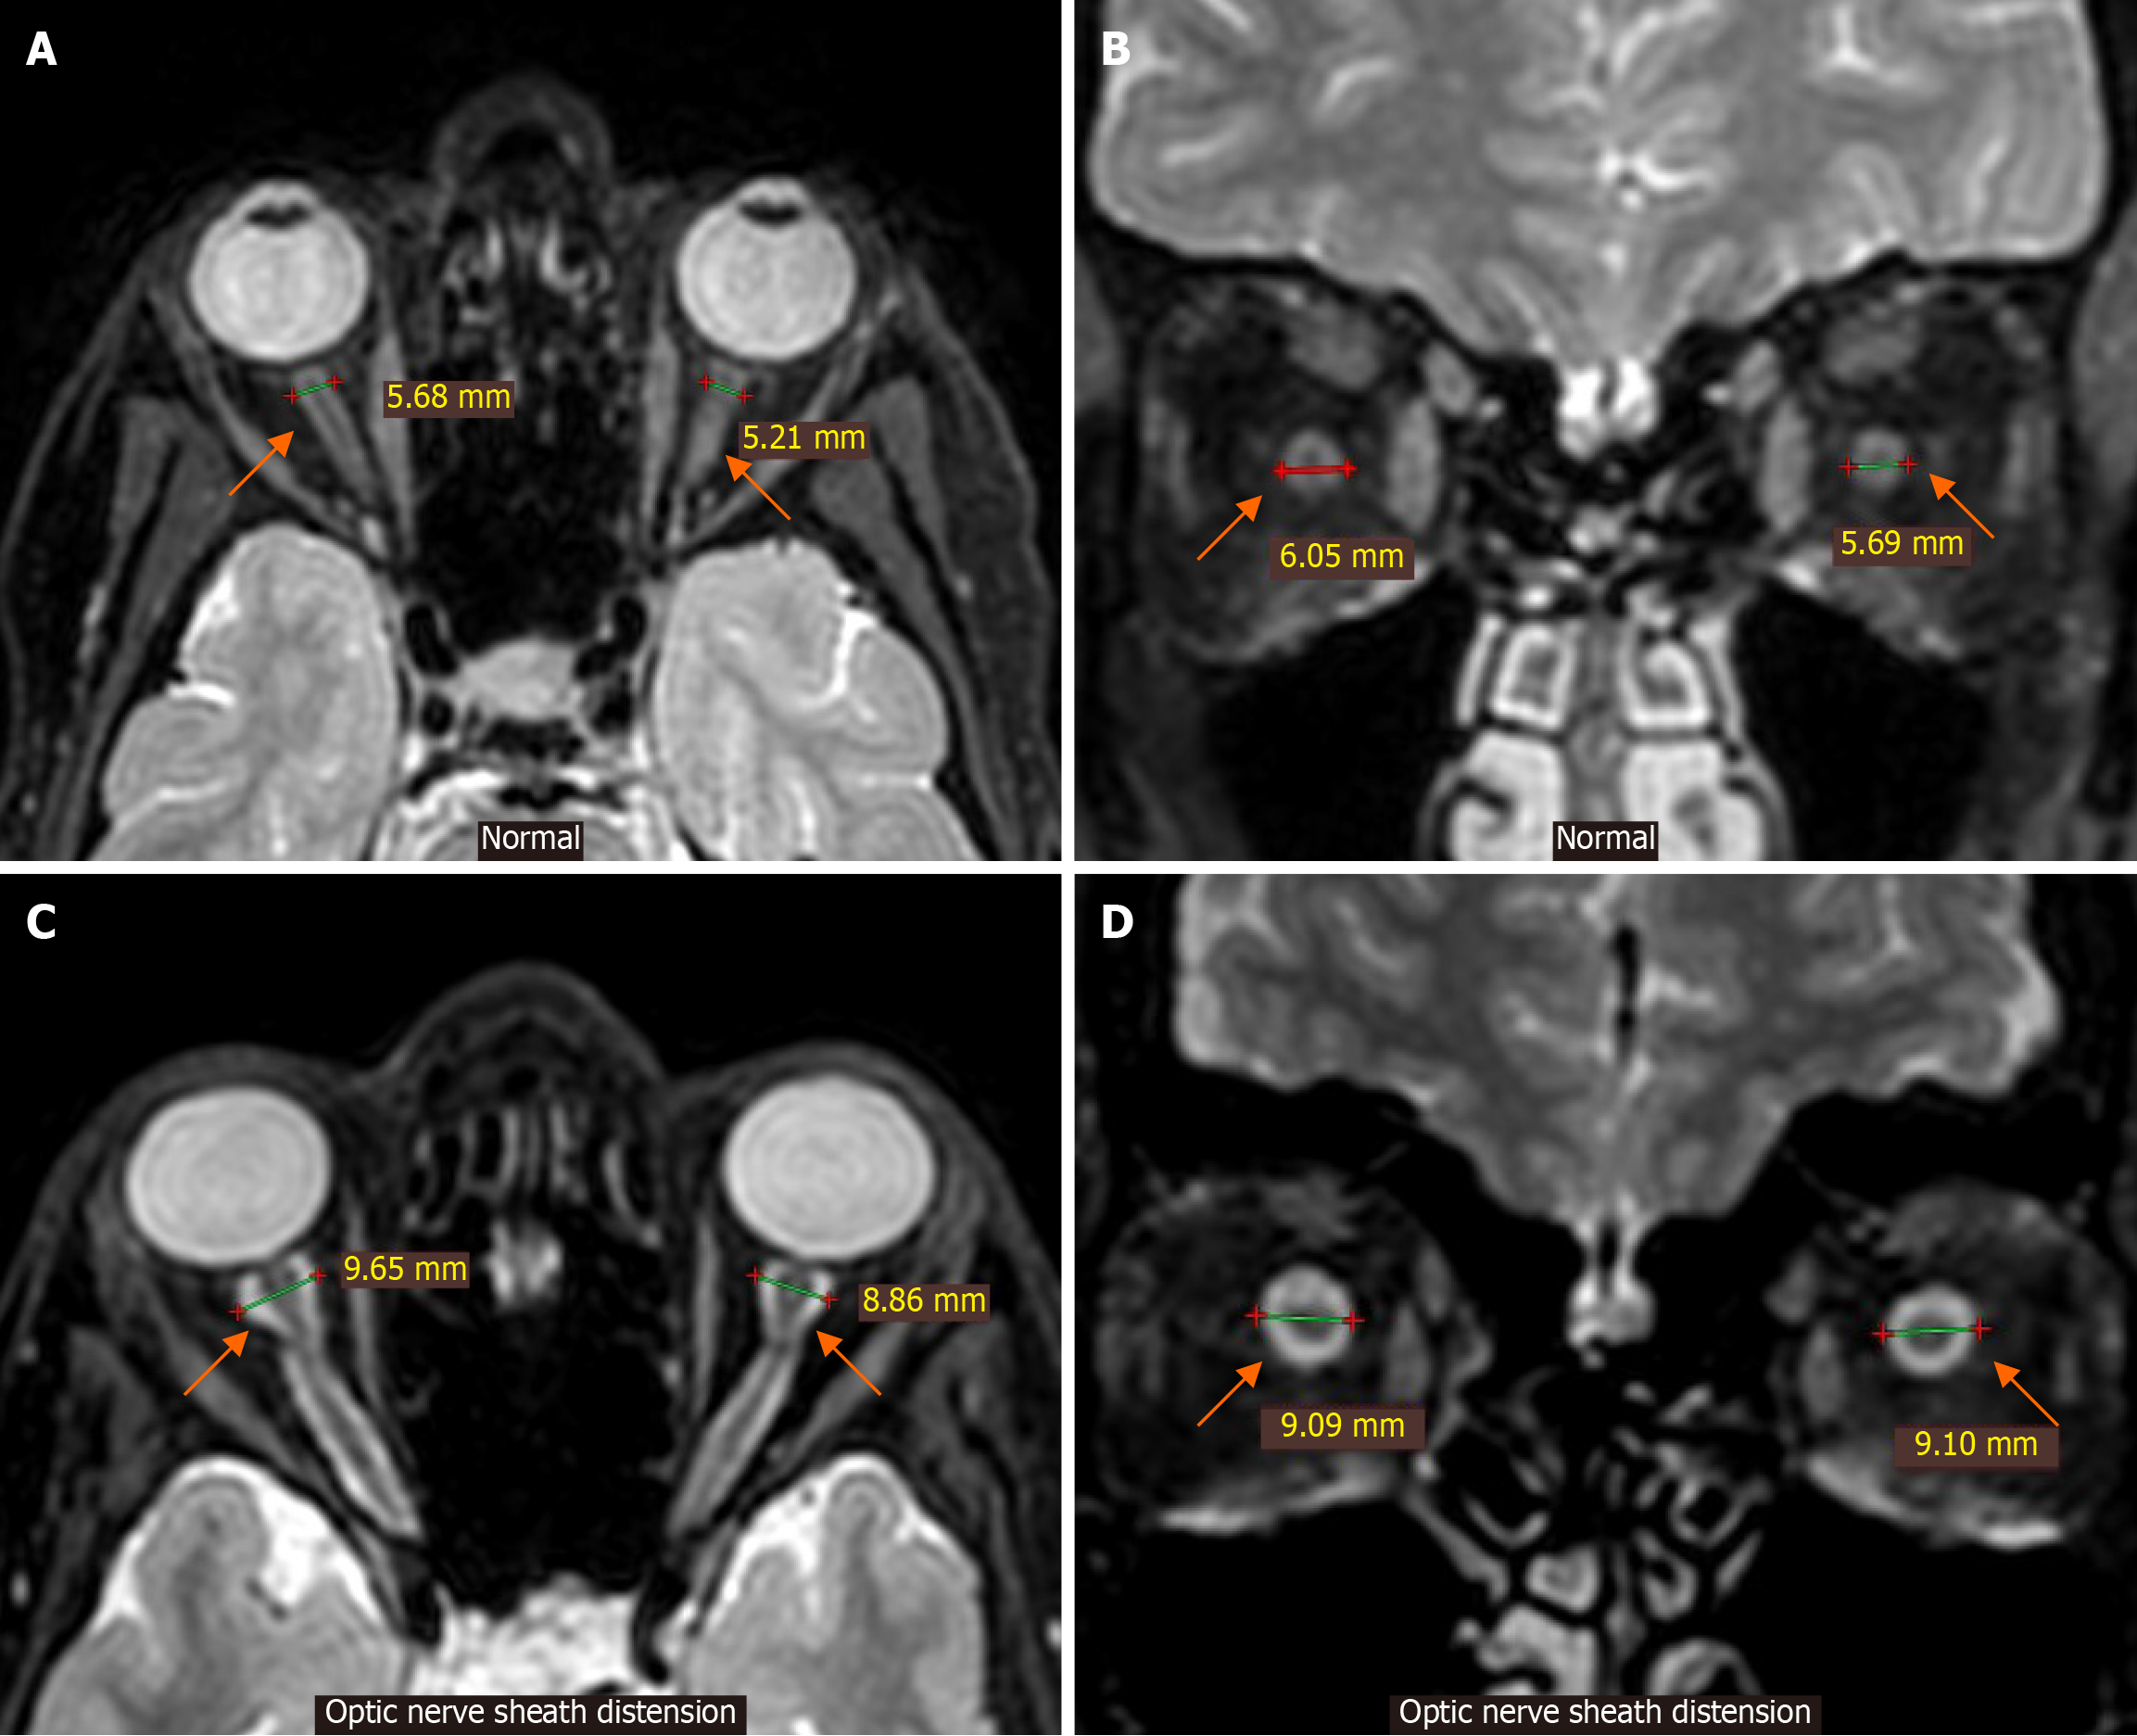
Figure 8 Optic nerve sheath distension.
A and B: Axial (A) and coronal T2-weighted magnetic resonance images (B) at the level of the globes and optic nerves in a patient with no idiopathic intracranial hypertension signs or symptoms are provided for reference. Note the normal caliber and diameter of the optic nerve sheaths (arrows); C and D: Axial (C) and coronal T2-weighted magnetic resonance images (D) at the level of the globes and optic nerves in a patient with signs and symptoms of idiopathic intracranial hypertension demonstrate increased caliber of the optic nerve sheaths (arrows) (diameter > 8-9 mm) as a result of cerebrospinal fluid distension.
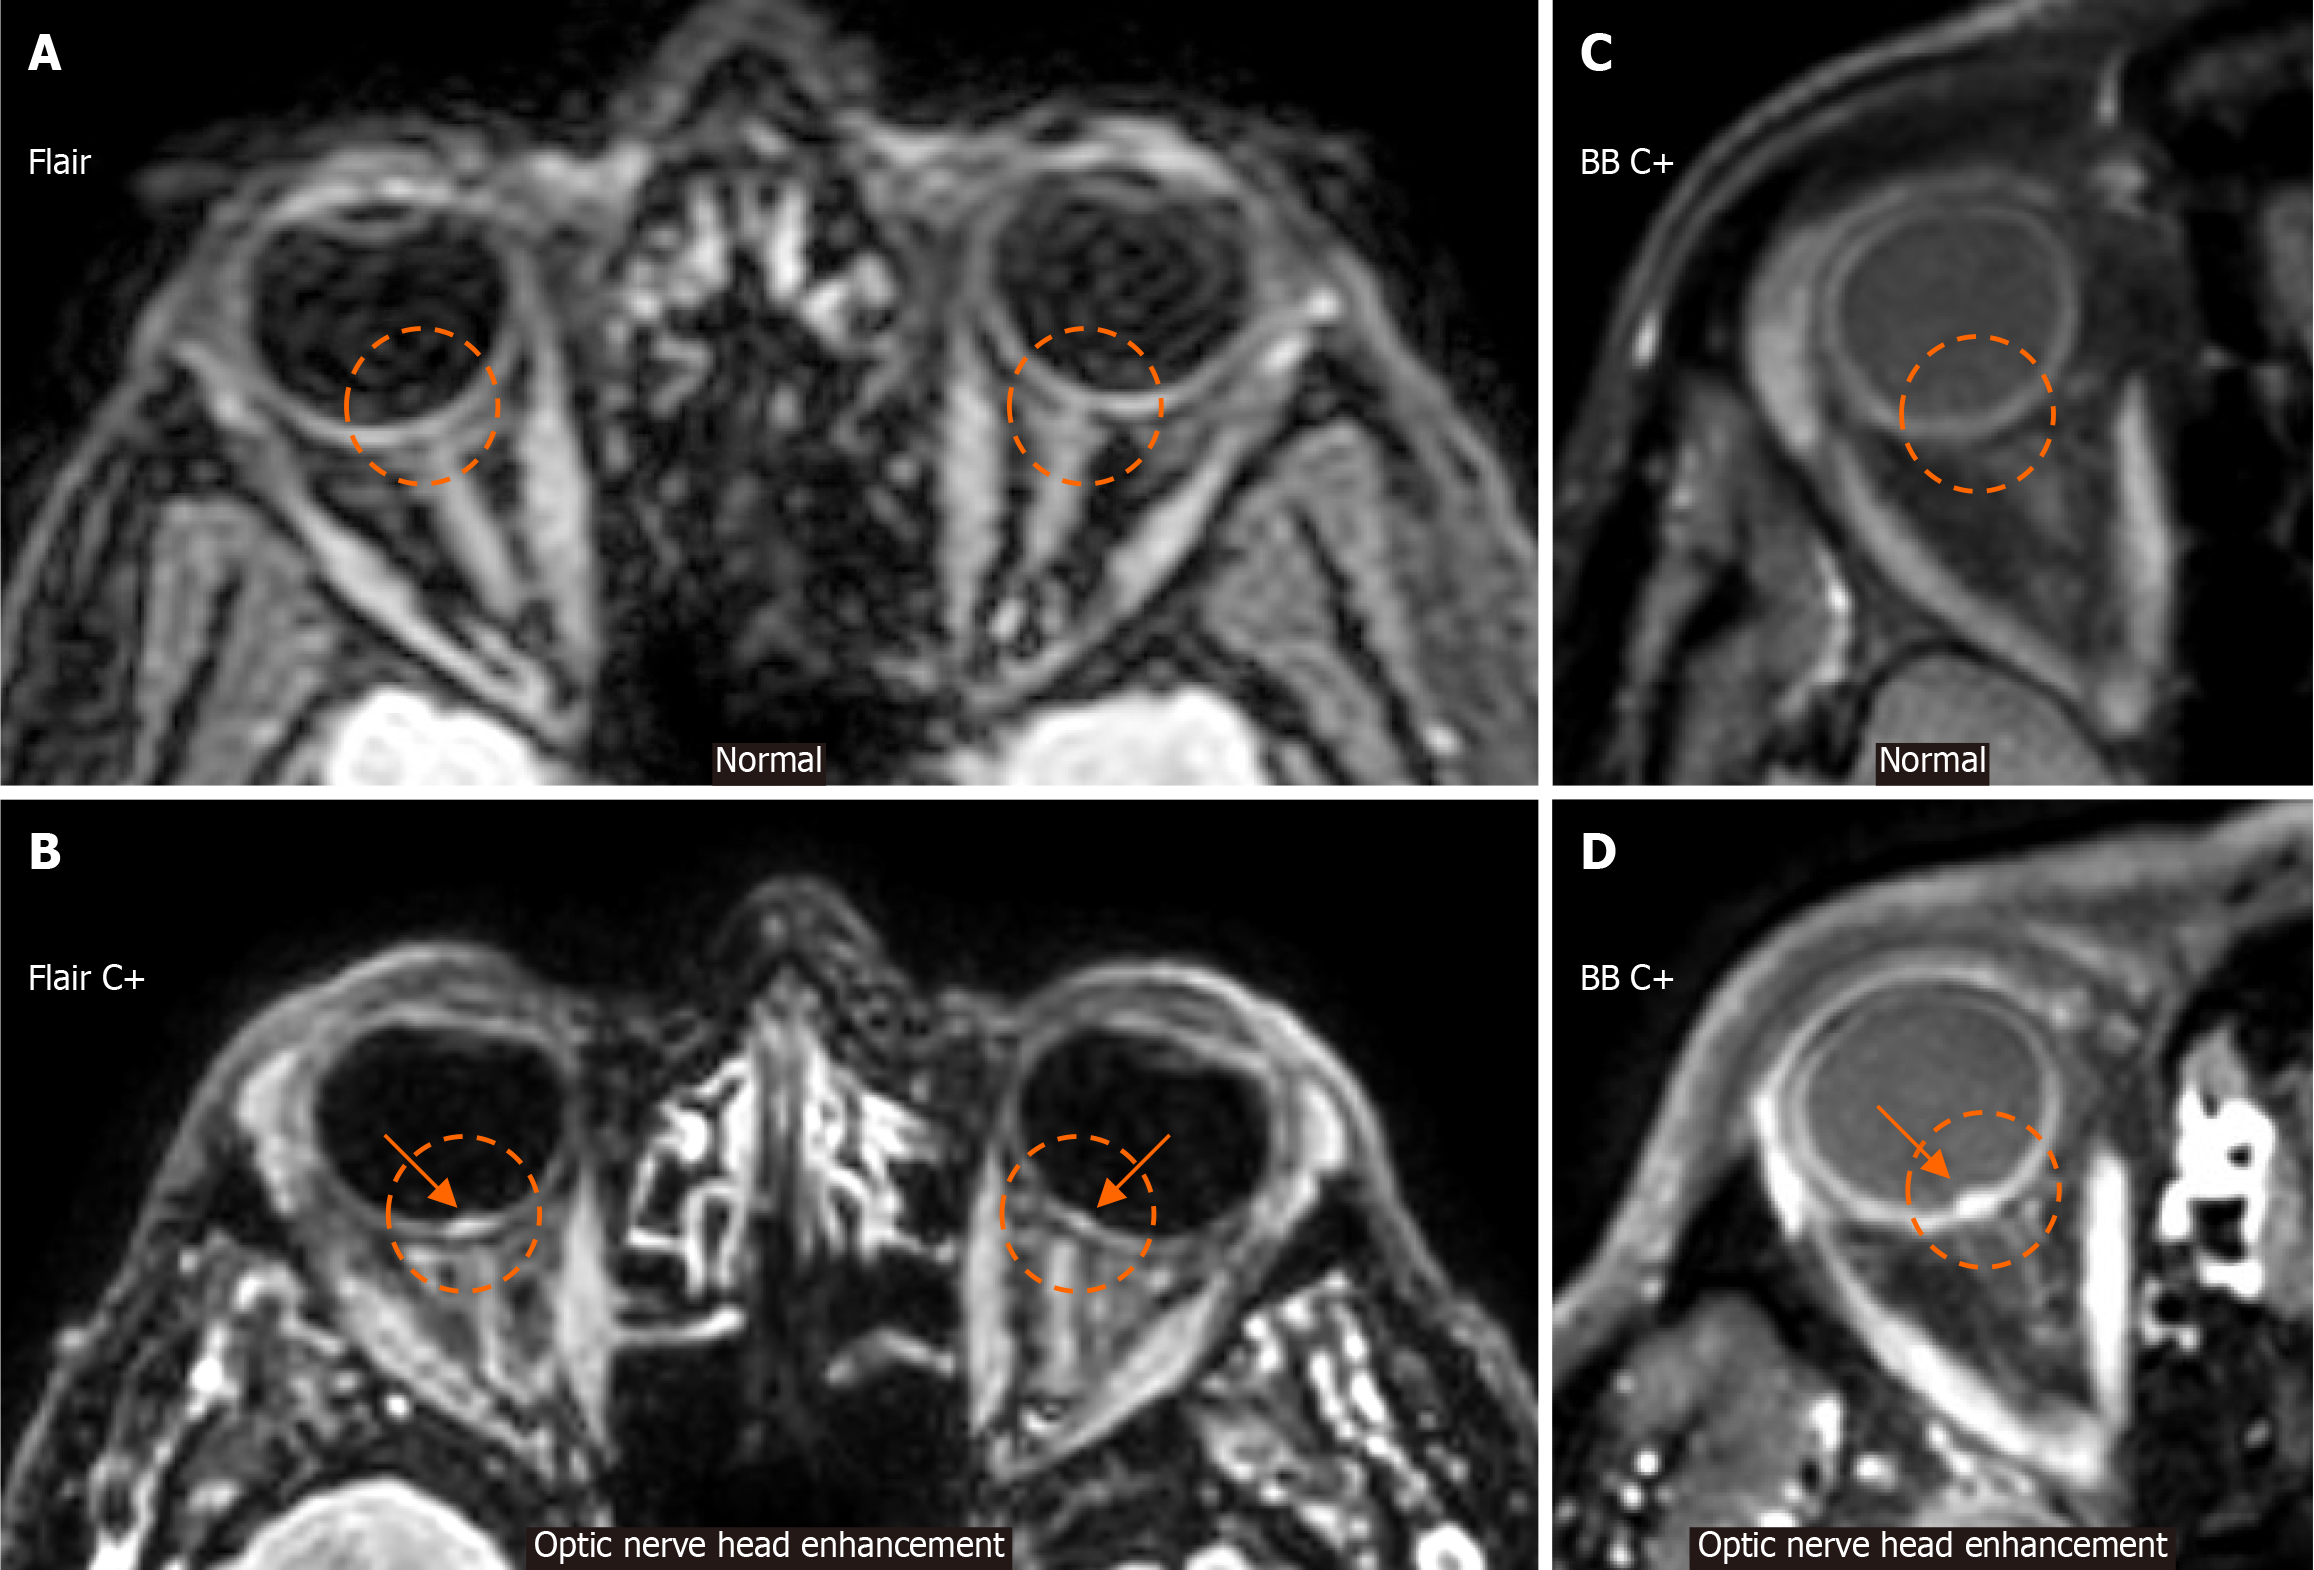
Figure 9 Optic nerve head enhancement.
A: An axial fluid-attenuated inversion recovery image at the level of the orbits from a patient without idiopathic intracranial hypertension (IIH) signs or symptoms is provided for reference. Note the absence of signal intensity in the posterior aspect of both globes in the expected location of the optic nerve heads (ONHs) (dashed circles), corresponding to the expected normal appearance; B: An axial fluid-attenuated inversion recovery image, following intravenous gadolinium injection (C+), at the level of the orbits in a patient with IIH is provided. Note the signal hyperintensity in the posterior aspect of both globes in the expected location of the ONHs, compatible with ONH enhancement (arrows within dashed circles), which is more evident on the right than on the left ONH; C: An axial black blood image, following intravenous gadolinium injection (C+), at the level of the orbits from a normal patient is provided for reference. Observe the absence of signal intensity in the posterior aspect of the globe in the expected location of the ONH (dashed circle); D: An axial black blood image, following intravenous gadolinium injection (C+), at the level of the orbits from a patient with IIH is provided. Note the signal hyperintensity in the posterior aspect of the globe in the expected location of the ONH, compatible with ONH enhancement (arrow within the dashed circle). BB: Black blood; Flair: Fluid-attenuated inversion recovery.
Figure 10 Posterior globe flattening and optic nerve head protrusion.
A: An axial T2-weighted magnetic resonance image at the level of the globe and optic nerve in a normal patient is provided for reference. Note the normal, expected curvature of the posterior aspect of the globe; B: An axial T2-weighted magnetic resonance image at the level of the globes and optic nerves in a patient with signs and symptoms of idiopathic intracranial hypertension demonstrates loss of the expected curvature of the posterior aspect of the globes with flattening (dashed straight lines). There is also a slight emergence of right optic nerve head protrusion, evident by a “smear” of signal loss at the level of the posterior globe-optic nerve junction (arrow); C: An even more apparent example of optic nerve head protrusion is provided (arrow).
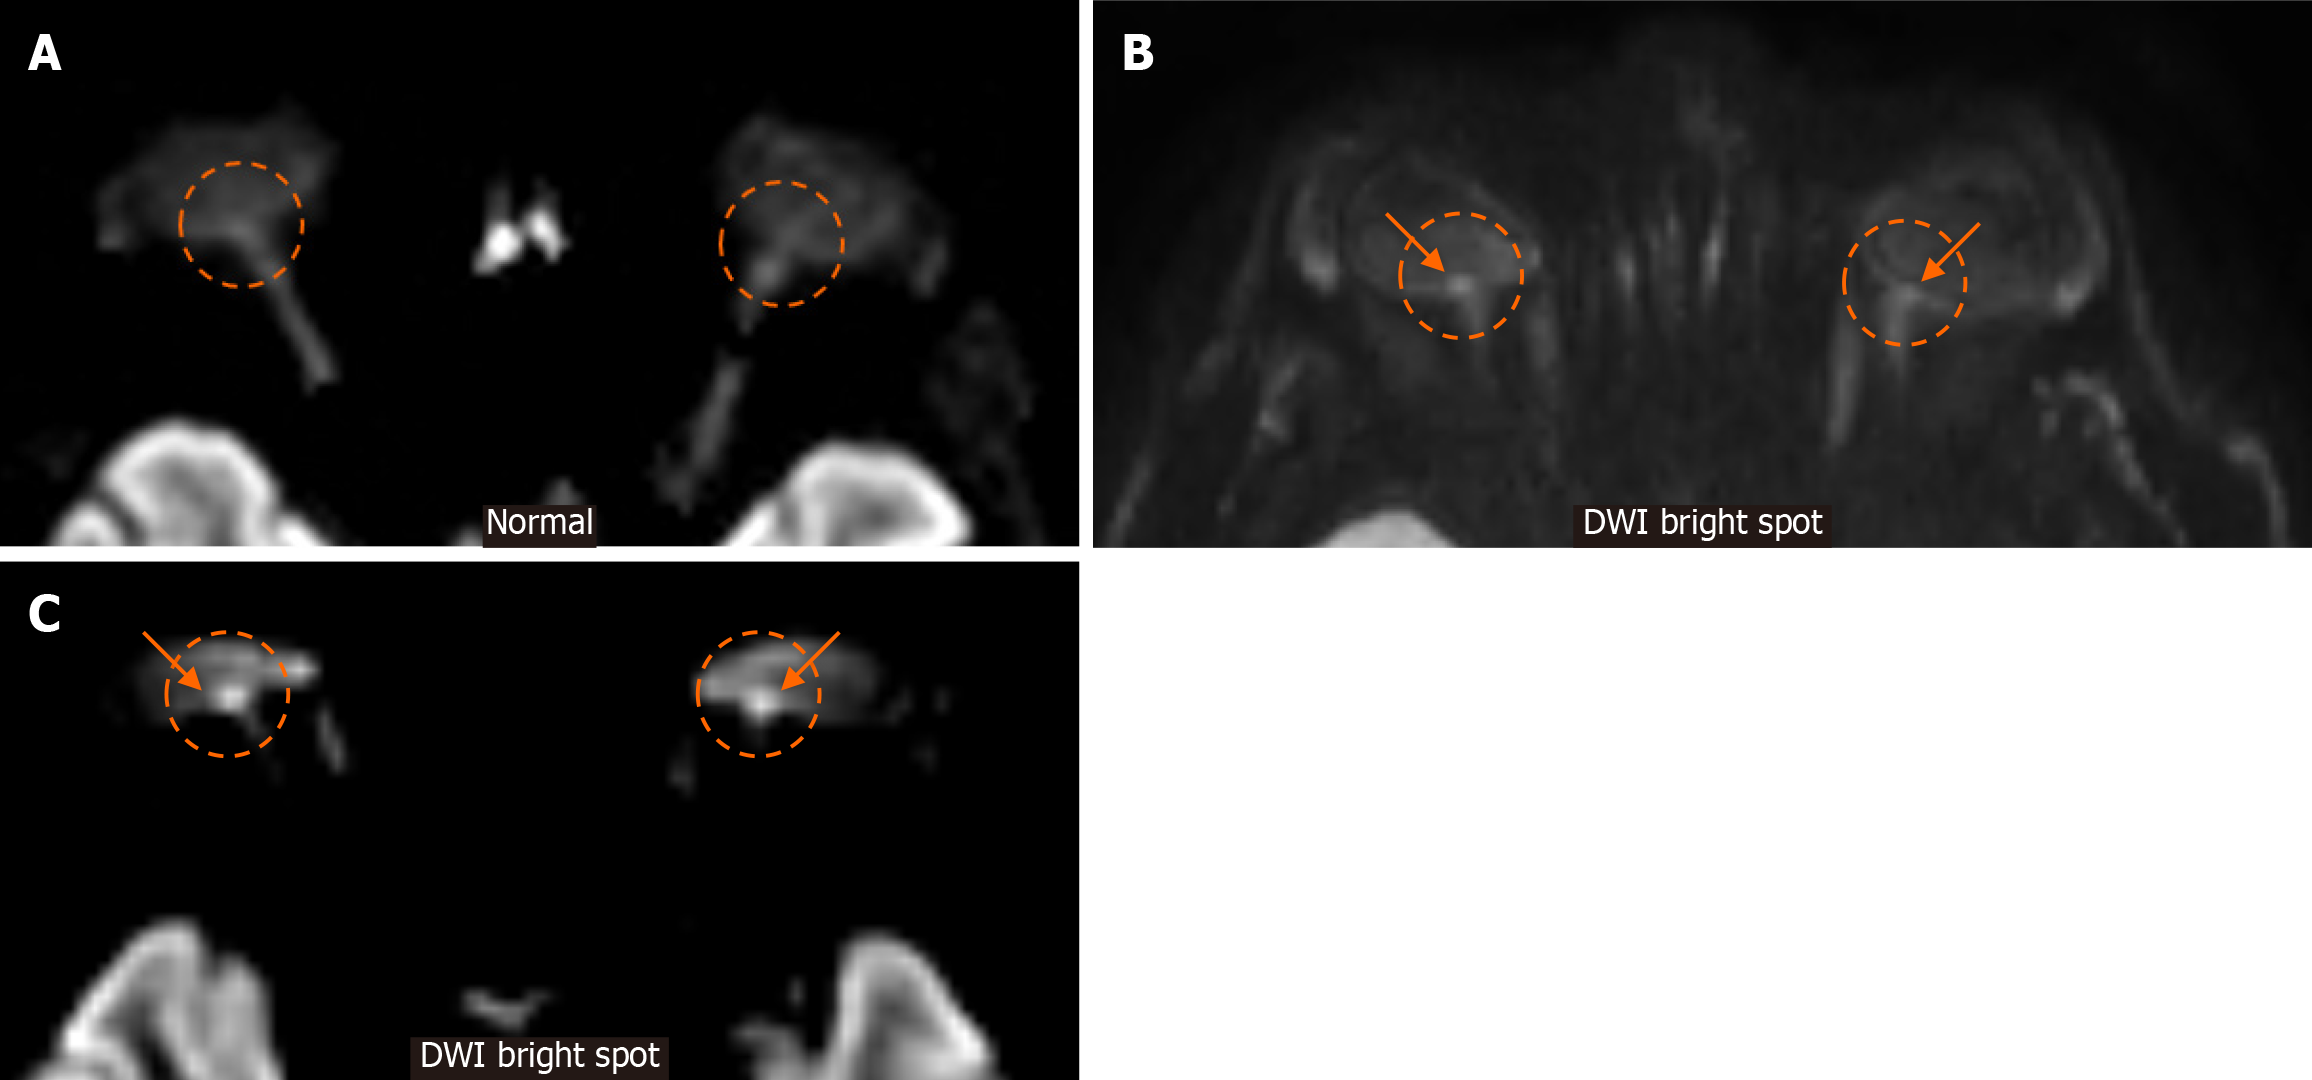
Figure 11 Diffusion-weighted imaging bright spot at fundus.
A: For reference, we provide an axial image of a diffusion-weighted imaging (DWI) magnetic resonance sequence from a normal patient. Note the absence of signal intensity in the posterior aspect of both globes in the expected location of the optic nerve heads (dashed circles), which corresponds to the expected normal appearance; B and C: Display axial DWI images in different patients with idiopathic intracranial hypertension. Note the obvious abnormal DWI signal hyperintensity in the optic nerve heads (arrows in dashed circles). DWI: Diffusion-weighted imaging.
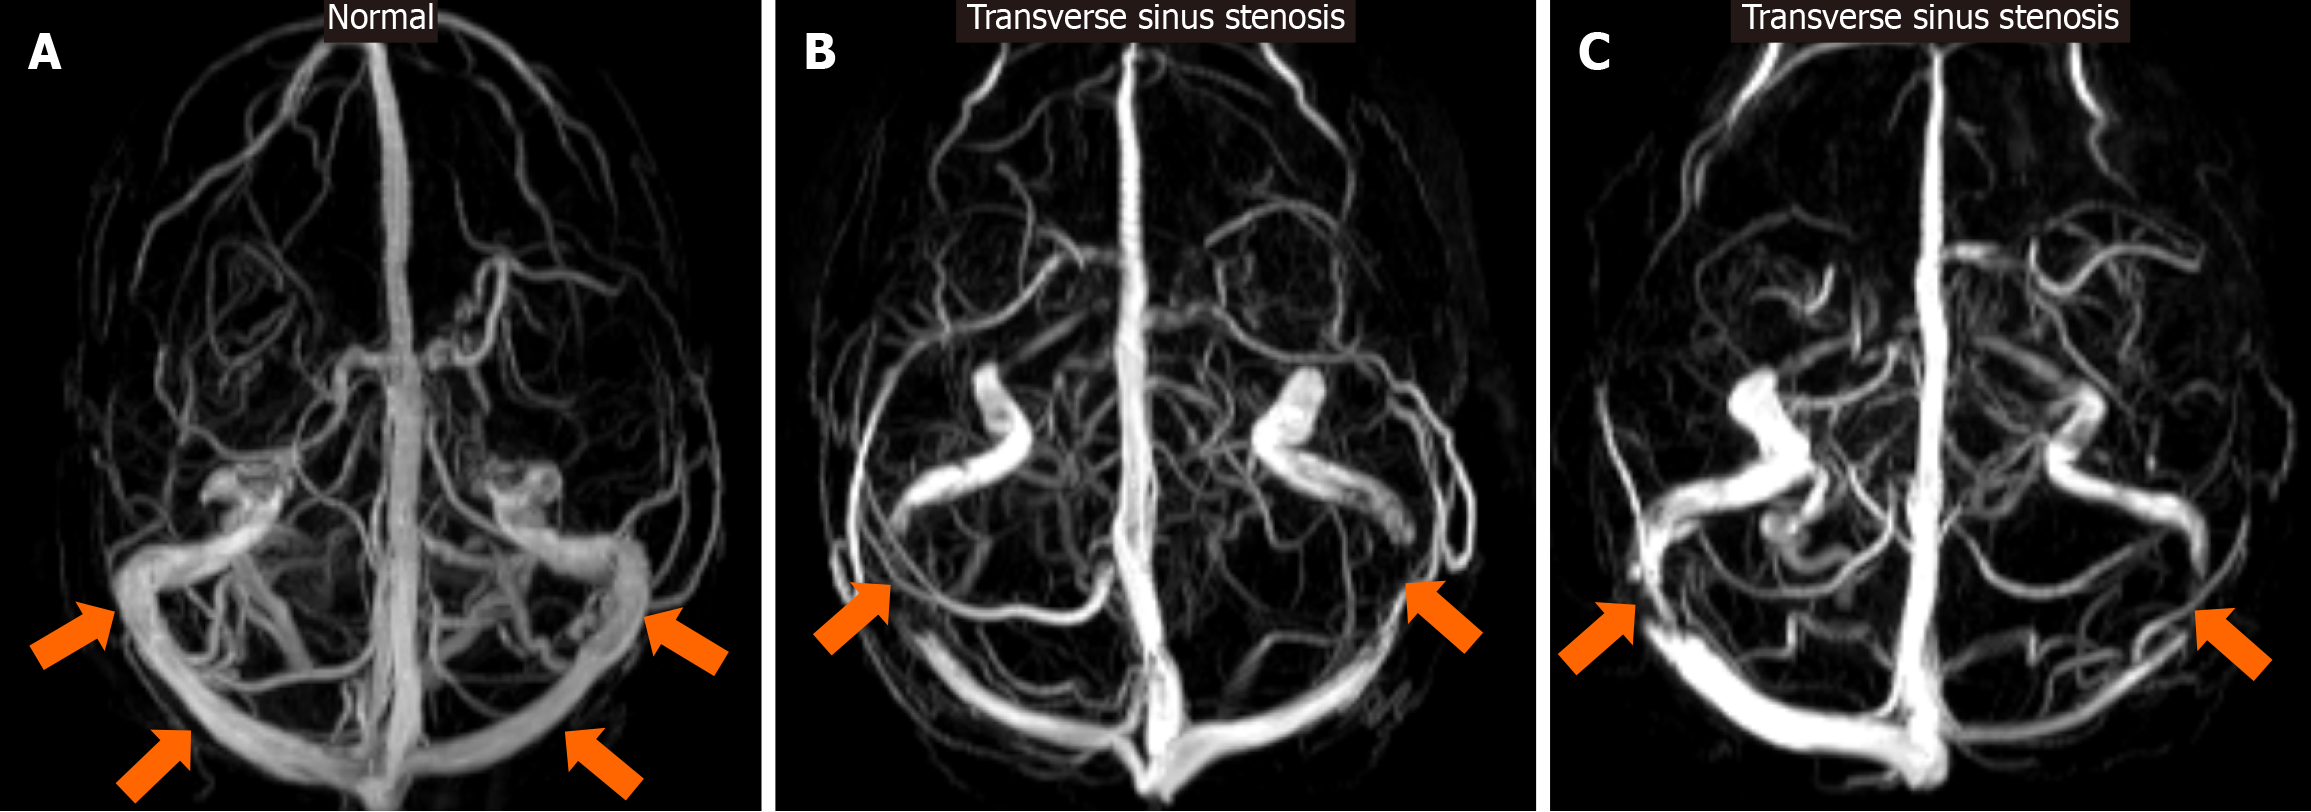
Figure 12 Transverse sinus stenosis.
A: For reference, a maximum-intensity-projection axial reconstruction of a 3D phase contrast magnetic resonance venography examination of the brain in a normal patient is provided. Note that the caliber of the transverse sinus bilaterally is within expected-normal limits (arrows); B and C: Display axial maximum-intensity-projection 3D phase contrast magnetic resonance venography reconstructions in different patients with signs and symptoms of increased intracranial pressure, demonstrating significant bilateral transverse sinus stenosis (arrows).
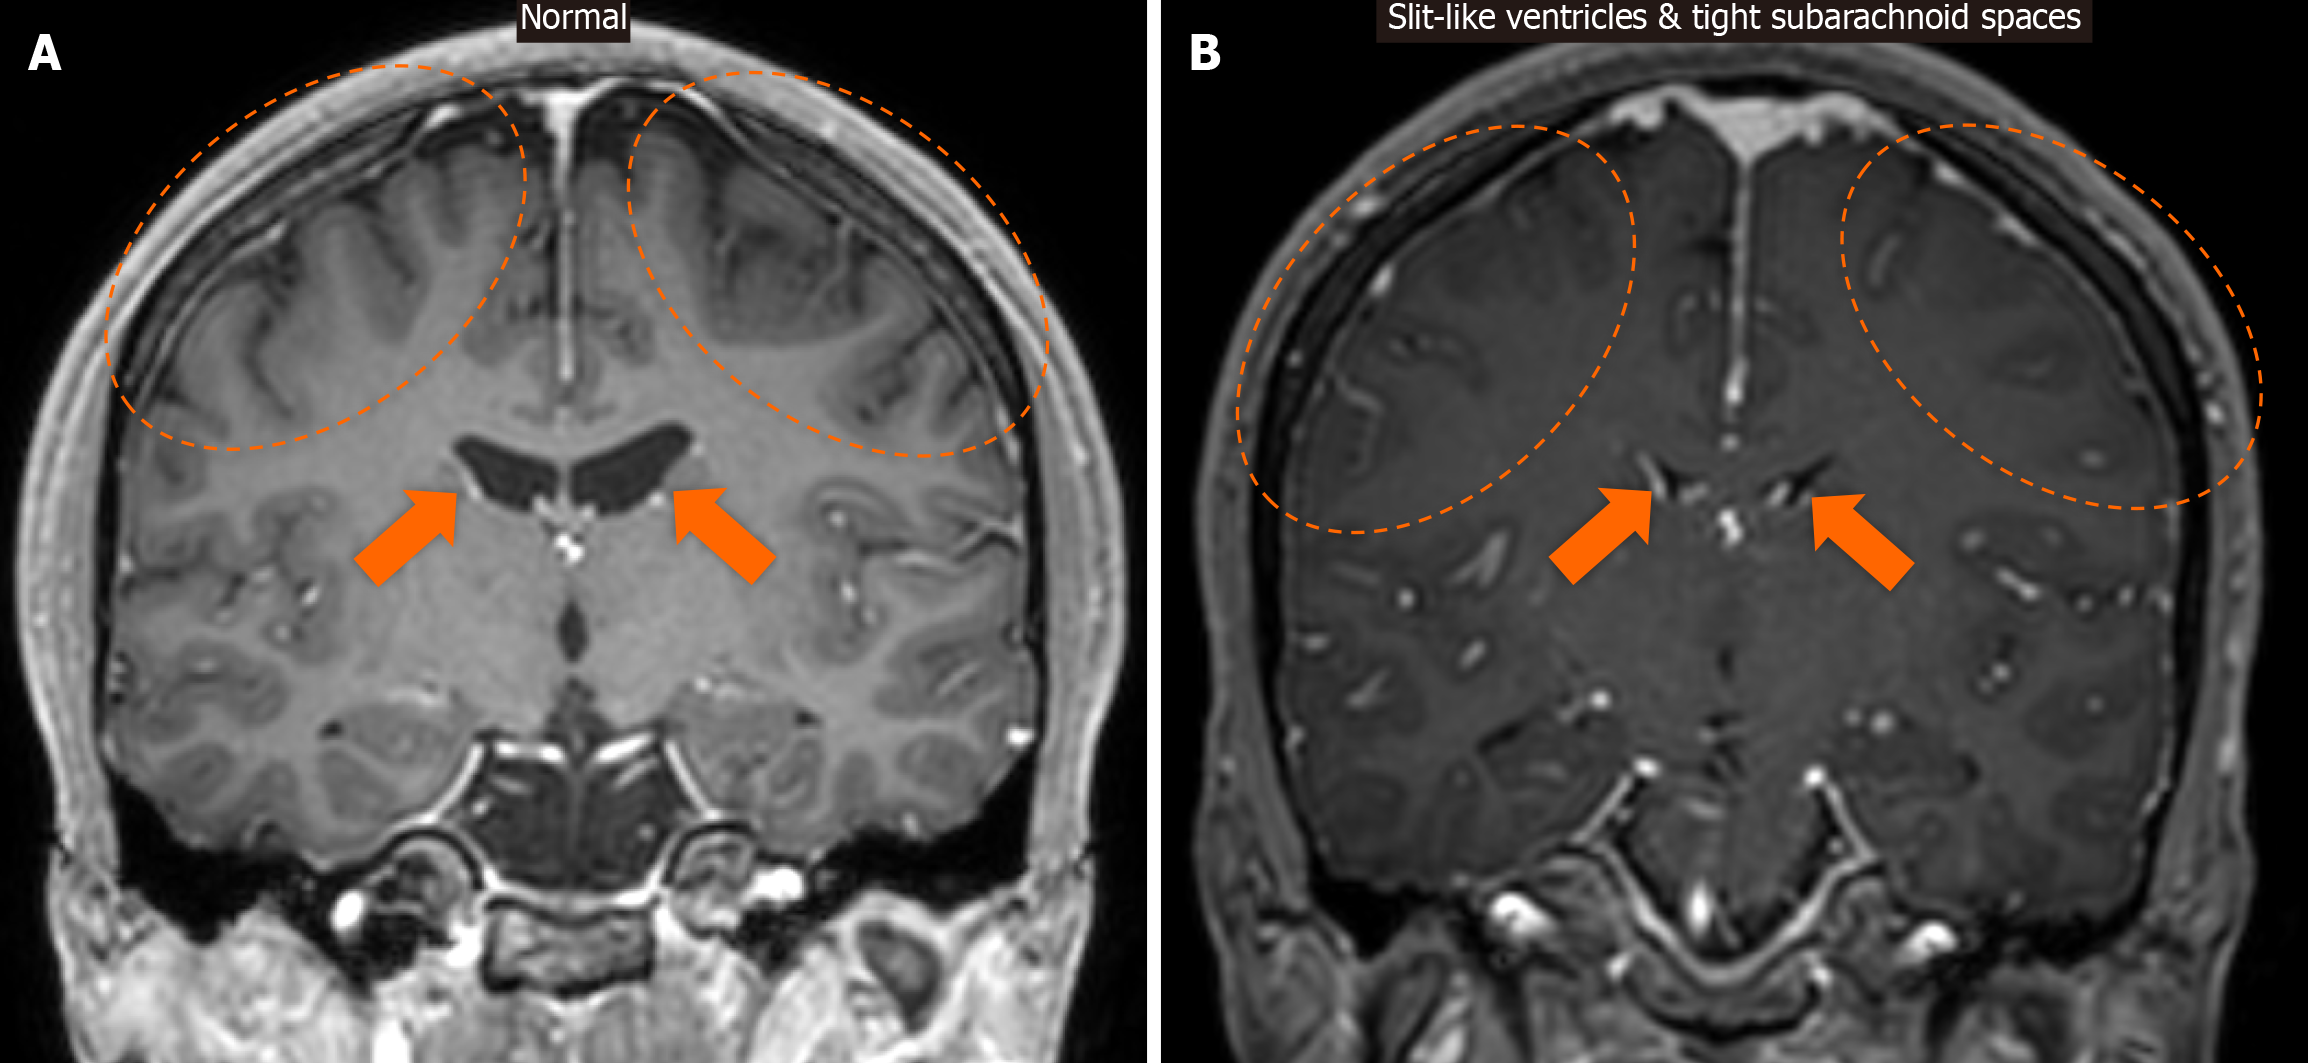
Figure 13 Slit-like ventricles and tight subarachnoid spaces.
A: For reference, a coronal contrast-enhanced T1-weighted magnetic resonance image is provided, displaying normal-sized ventricles (arrows) and normally expanded subarachnoid spaces (dashed ovals); B: Coronal contrast-enhanced T1-weighted magnetic resonance image displays the presence of slit-like ventricles (arrows) and tight subarachnoid spaces (dashed ovals).
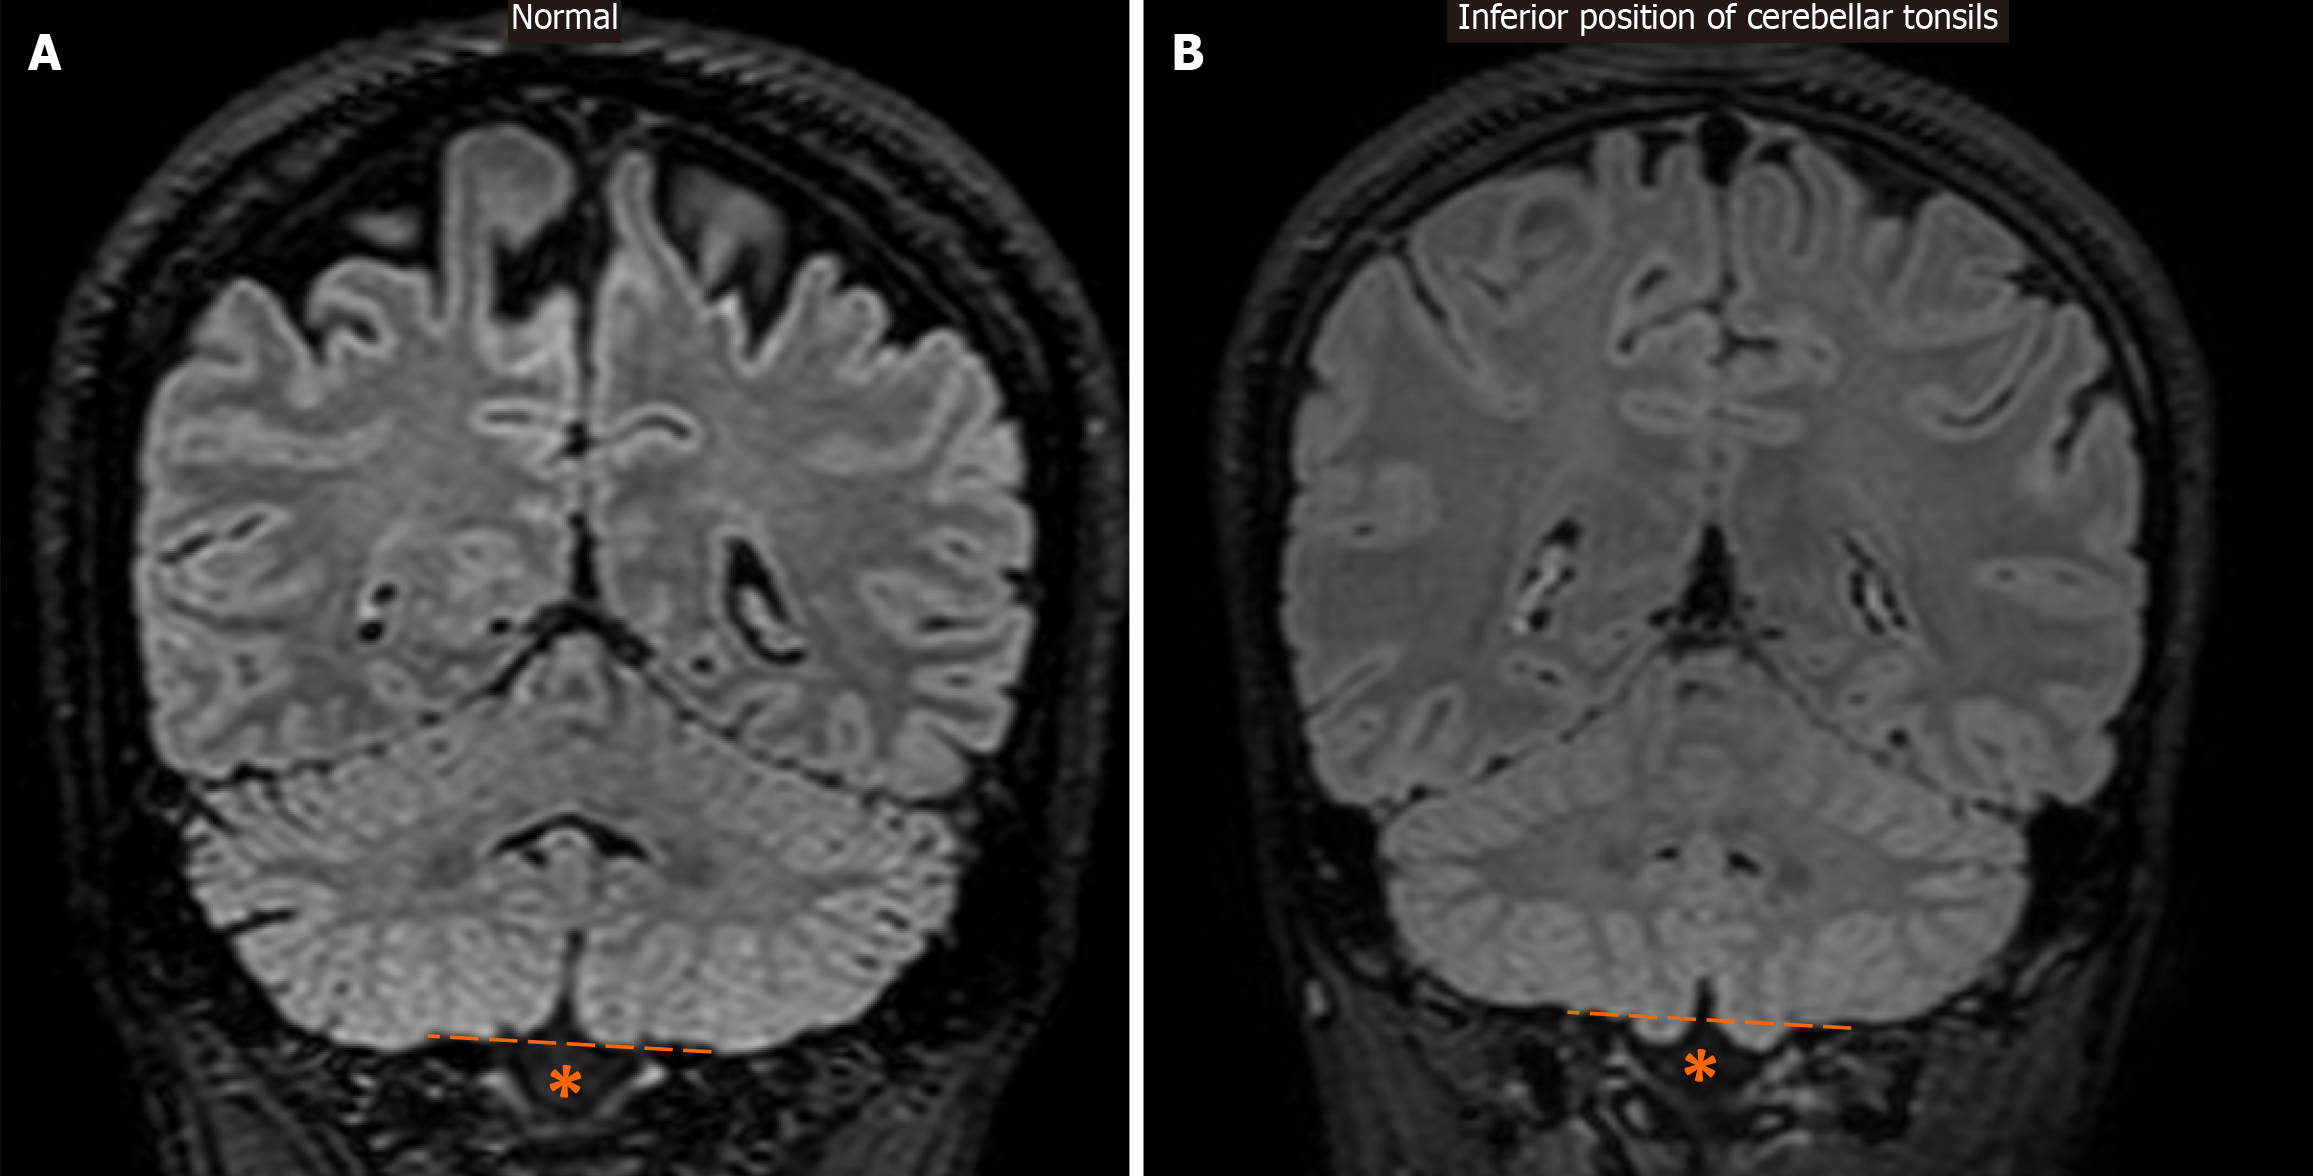
Figure 14 Inferior position of cerebellar tonsils.
A: For reference, a coronal fluid-attenuated inversion recovery image is provided, which displays normally positioned cerebellar tonsils above the level of the foramen magnum (*), as indicated by the dashed line; B: Coronal fluid-attenuated inversion recovery image demonstrates only mild ectopic localization of the inferior part of the cerebellar tonsils, just below their expected level (dashed line) and through the foramen magnum (*).
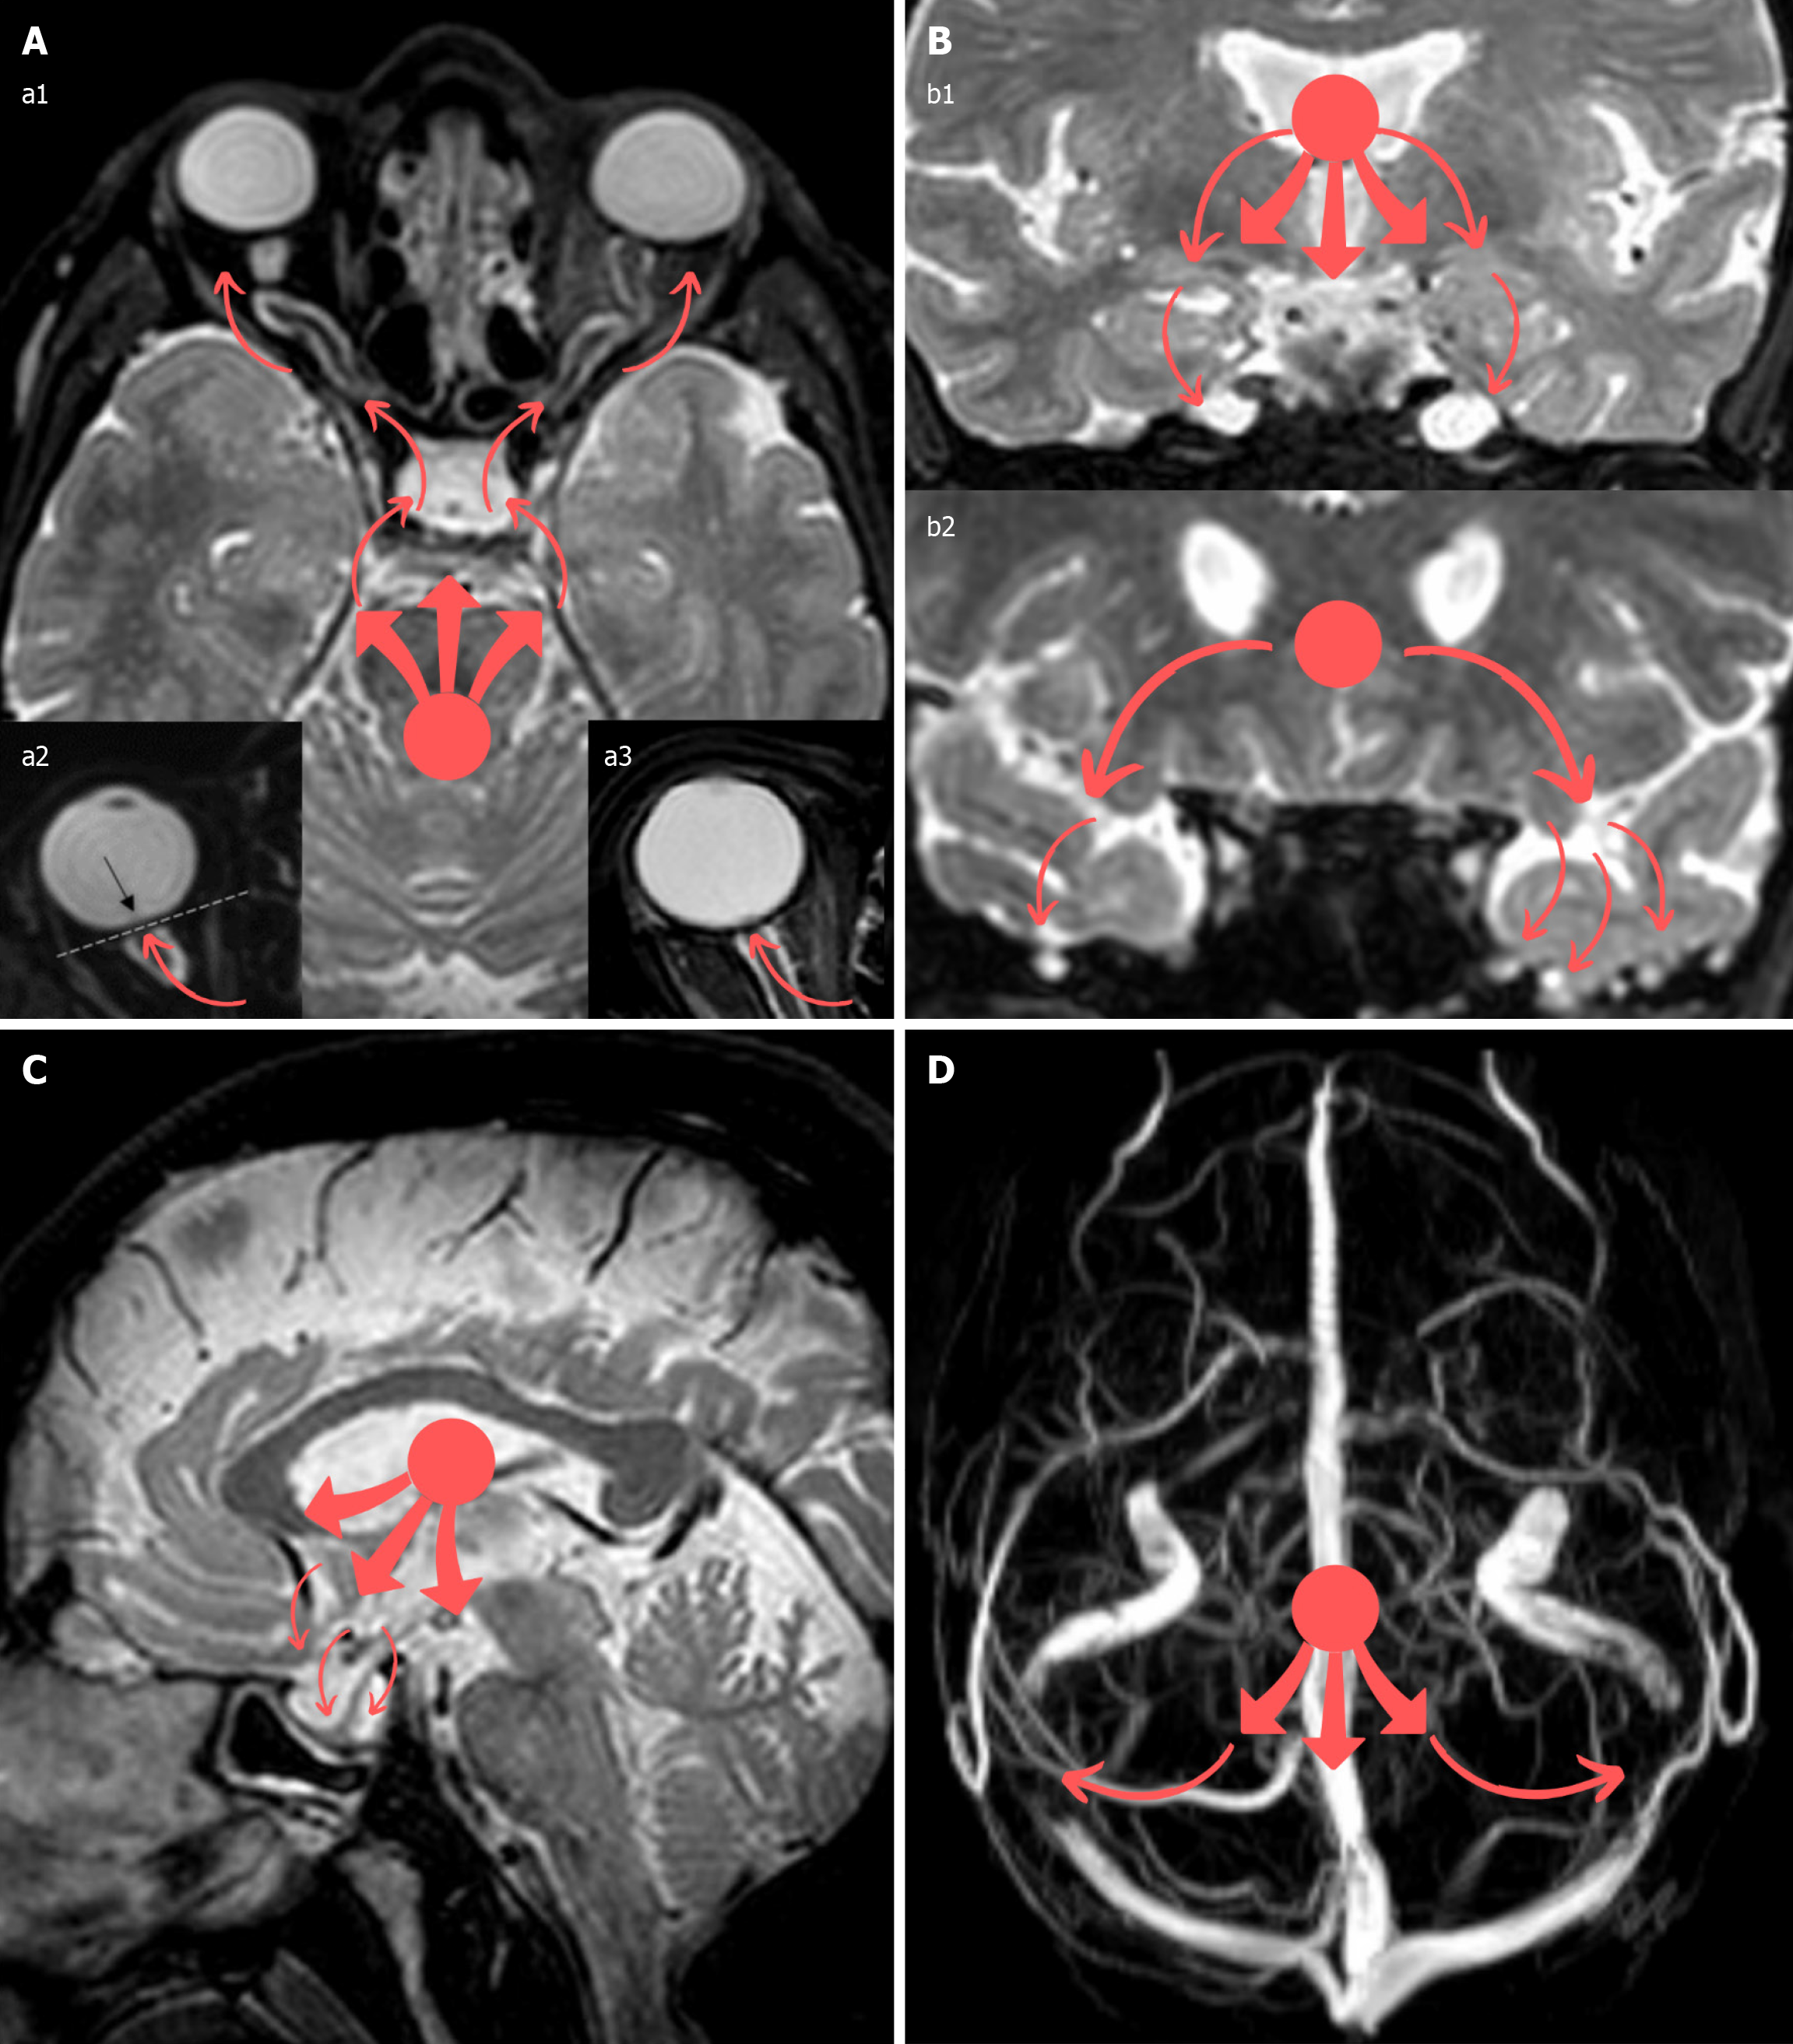
Figure 15 Idiopathic intracranial hypertension illustration.
A: In this illustration, the red dot in all panels represents an assumption of the supposed reference point from where the increased intracranial forces arise, while all the red arrows represent the outward direction of this force, which is attempting to release itself. As a result of intracranial hypertension, the force (red dot) is directed (red arrows) towards the optic nerves and their sheaths, causing their distension and tortuosity (panel a1), flattening of the posterior aspect of the globes (panel a2), and protrusion of the optic nerve head within the globe (panel a3); B: In a similar manner, the Meckel’s caves may be distended in an attempt to accommodate the excess cerebrospinal fluid pressure (panel b1), and meningoceles may also be created, mainly in the sphenoid bone wings and temporal bones, through bony clefts (panel b2); C: The pituitary gland may be stretched downwards against the expanded sella turcica (panel C), thus creating the empty or partially empty sella appearance; D: Compression of the transverse venous sinuses against the cranial bony cavity can result in stenosis of these veins (panel D) (although stenosis may preexist, causing an increase in intracranial pressure secondarily). This illustration/mechanism is only hypothetical and solely described in a rudimentary way for educational purposes to assist in memorizing the neuroimaging finding’s end results; besides, as previously mentioned, the exact pathogenesis of idiopathic intracranial hypertension (IIH) is complex and multifactorial. Neuroimaging findings may be promising clues for IIH diagnosis, although their absence does not rule it out. Various combinations of the related neuroimaging findings described may be encountered in IIH cases, and the radiologists should be aware of them to assist in the proper and timely diagnosis of the condition. Nonetheless, the role of the radiologists will primarily entail the exclusion of other intracranial pathologies hindering alternative diagnosis.
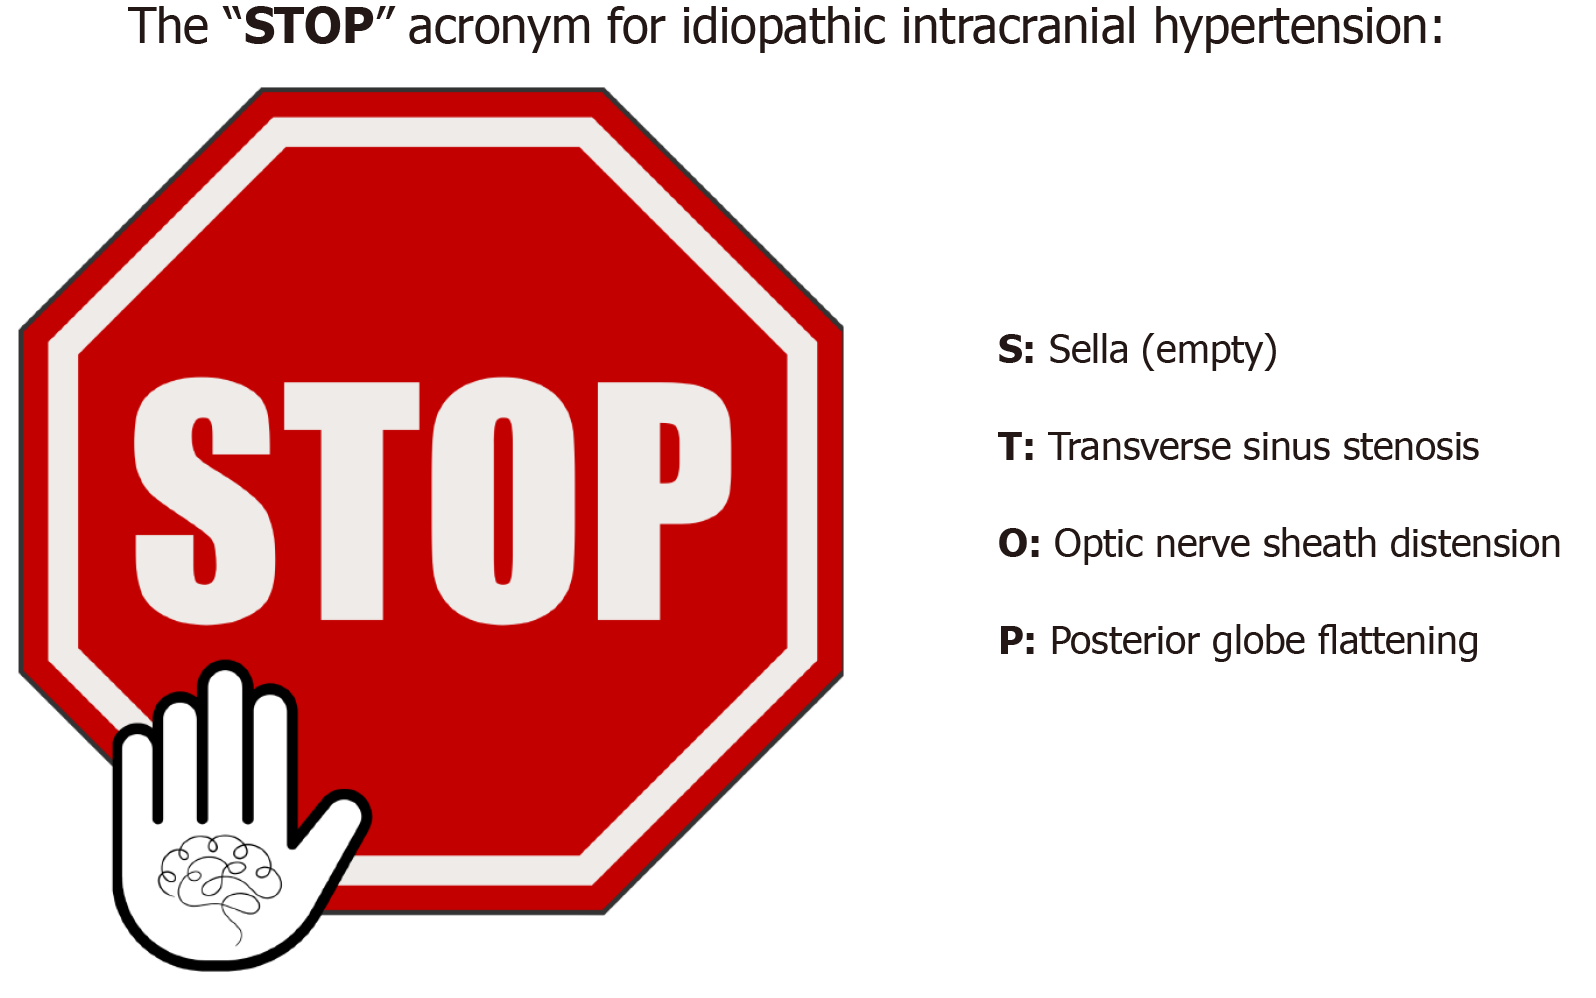
Figure 16 The “STOP” acronym for idiopathic intracranial hypertension.
We have fabricated the “STOP” acronym for idiopathic intracranial hypertension (IIH) merely as a mnemonic tool. Although there are several signs that may be encountered in IIH cases, the presence of 3 out of 4 of these signs mentioned above may suggest (but not verify) the probability of IIH diagnosis in specific clinical scenarios according to the revised IIH criteria (Friedman et al[1], 2013). Therefore, specifically assessing these neuroimaging signs and addressing their presence or absence in the radiological report may be of increased value for the referring physician.
- Citation: Arkoudis NA, Davoutis E, Siderakis M, Papagiannopoulou G, Gouliopoulos N, Tsetsou I, Efthymiou E, Moschovaki-Zeiger O, Filippiadis D, Velonakis G. Idiopathic intracranial hypertension: Imaging and clinical fundamentals. World J Radiol 2024; 16(12): 722-748
- URL: https://www.wjgnet.com/1949-8470/full/v16/i12/722.htm
- DOI: https://dx.doi.org/10.4329/wjr.v16.i12.722


