Copyright
©The Author(s) 2023.
World J Radiol. Jul 28, 2023; 15(7): 234-240
Published online Jul 28, 2023. doi: 10.4329/wjr.v15.i7.234
Published online Jul 28, 2023. doi: 10.4329/wjr.v15.i7.234
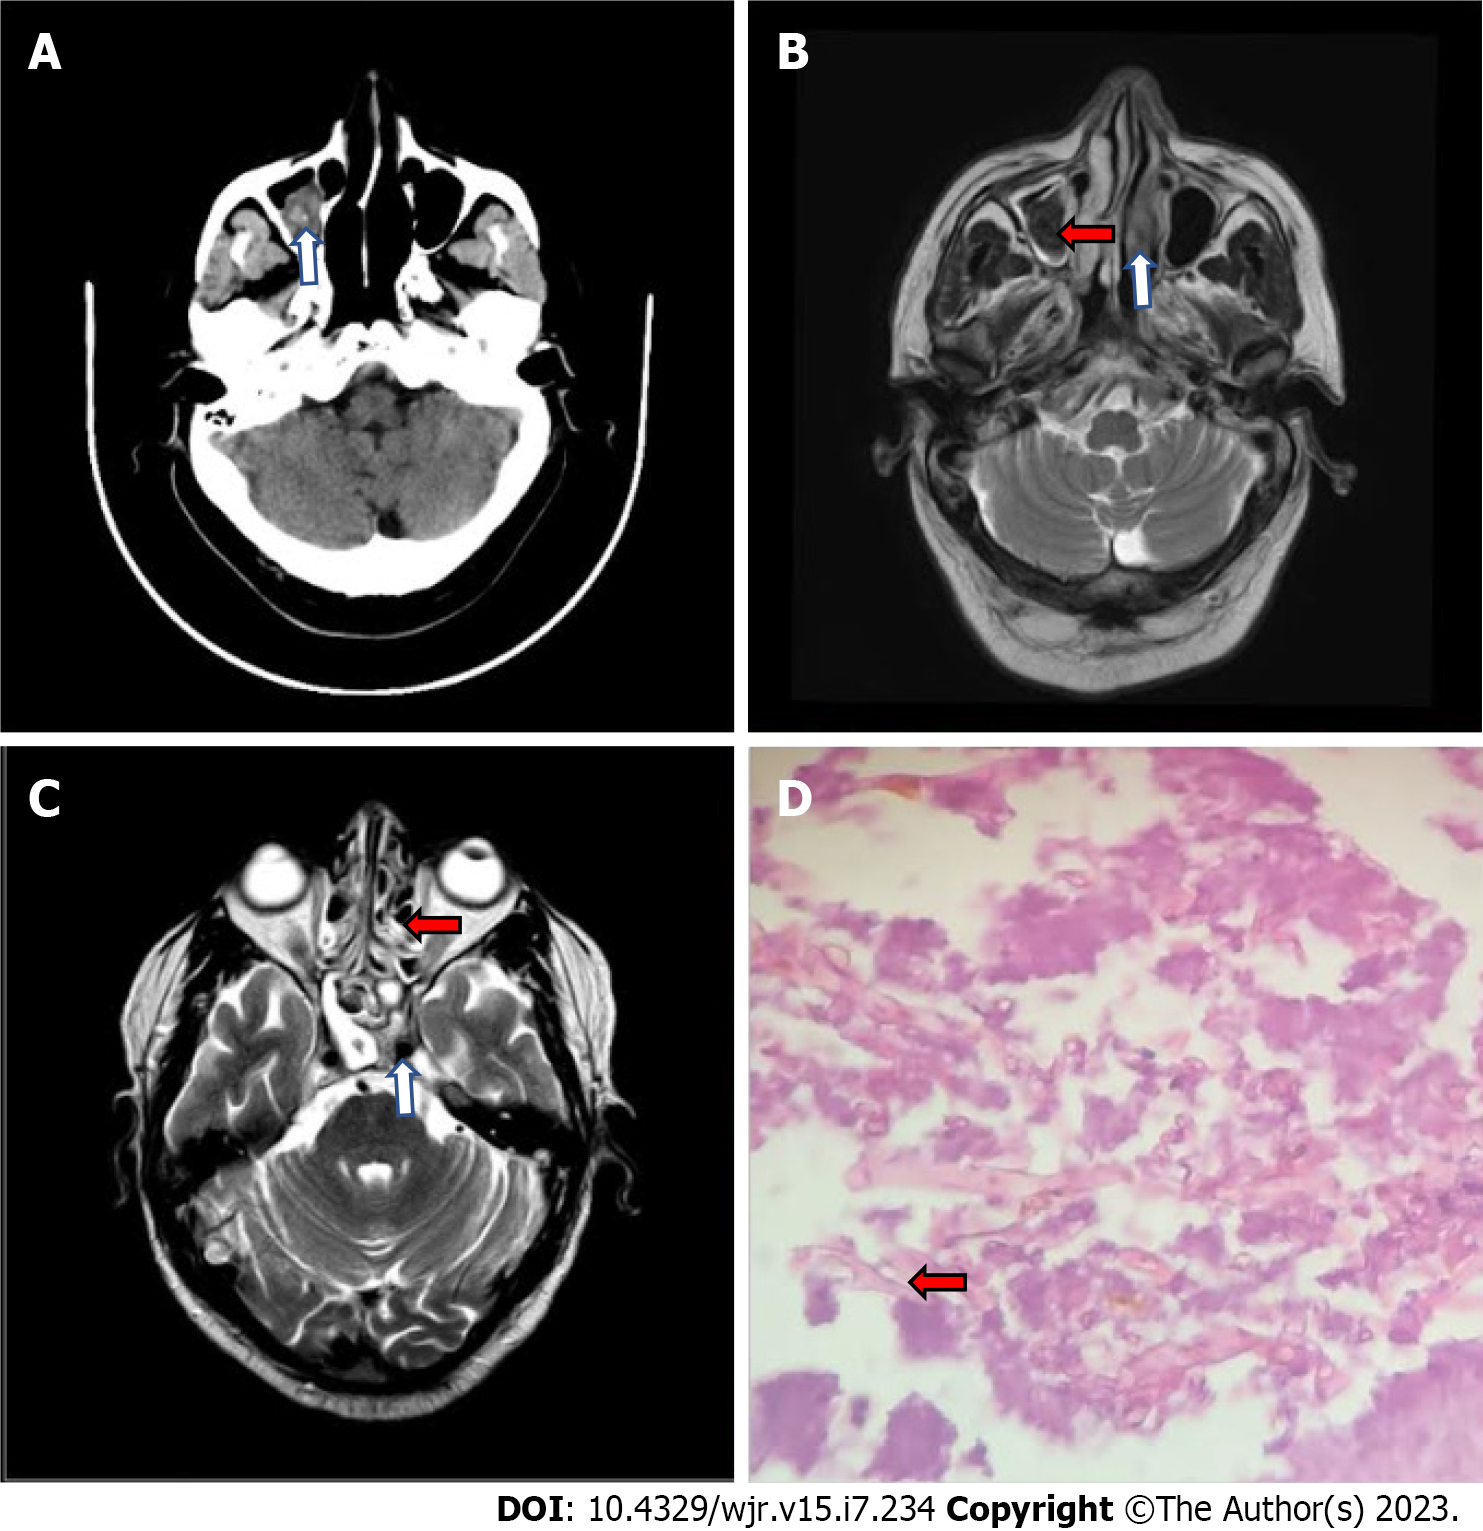
Figure 1 Images of patient with post COVID-19 mucormycosis.
A: Axial computed tomography image of brain, 10 d post admission demonstrating hyperdensity in right maxillary sinus (white arrow); B: Axial T2 weighted (T2W) and magnetic resonance imaging (MRI) image of brain demonstrating mucosal thickening with hypointensity within right maxillary sinus (red arrow) and hypointense left inferior turbinate (white arrow); C: Axial T2W and MRI image of brain demonstrating bilateral sphenoid and ethmoidal sinusitis (red arrow) with normal flow void within left internal carotid artery (white arrow); D: Histopathology slide demonstrating broad, aseptate ,branched hyphae of mucormycosis (red arrow).
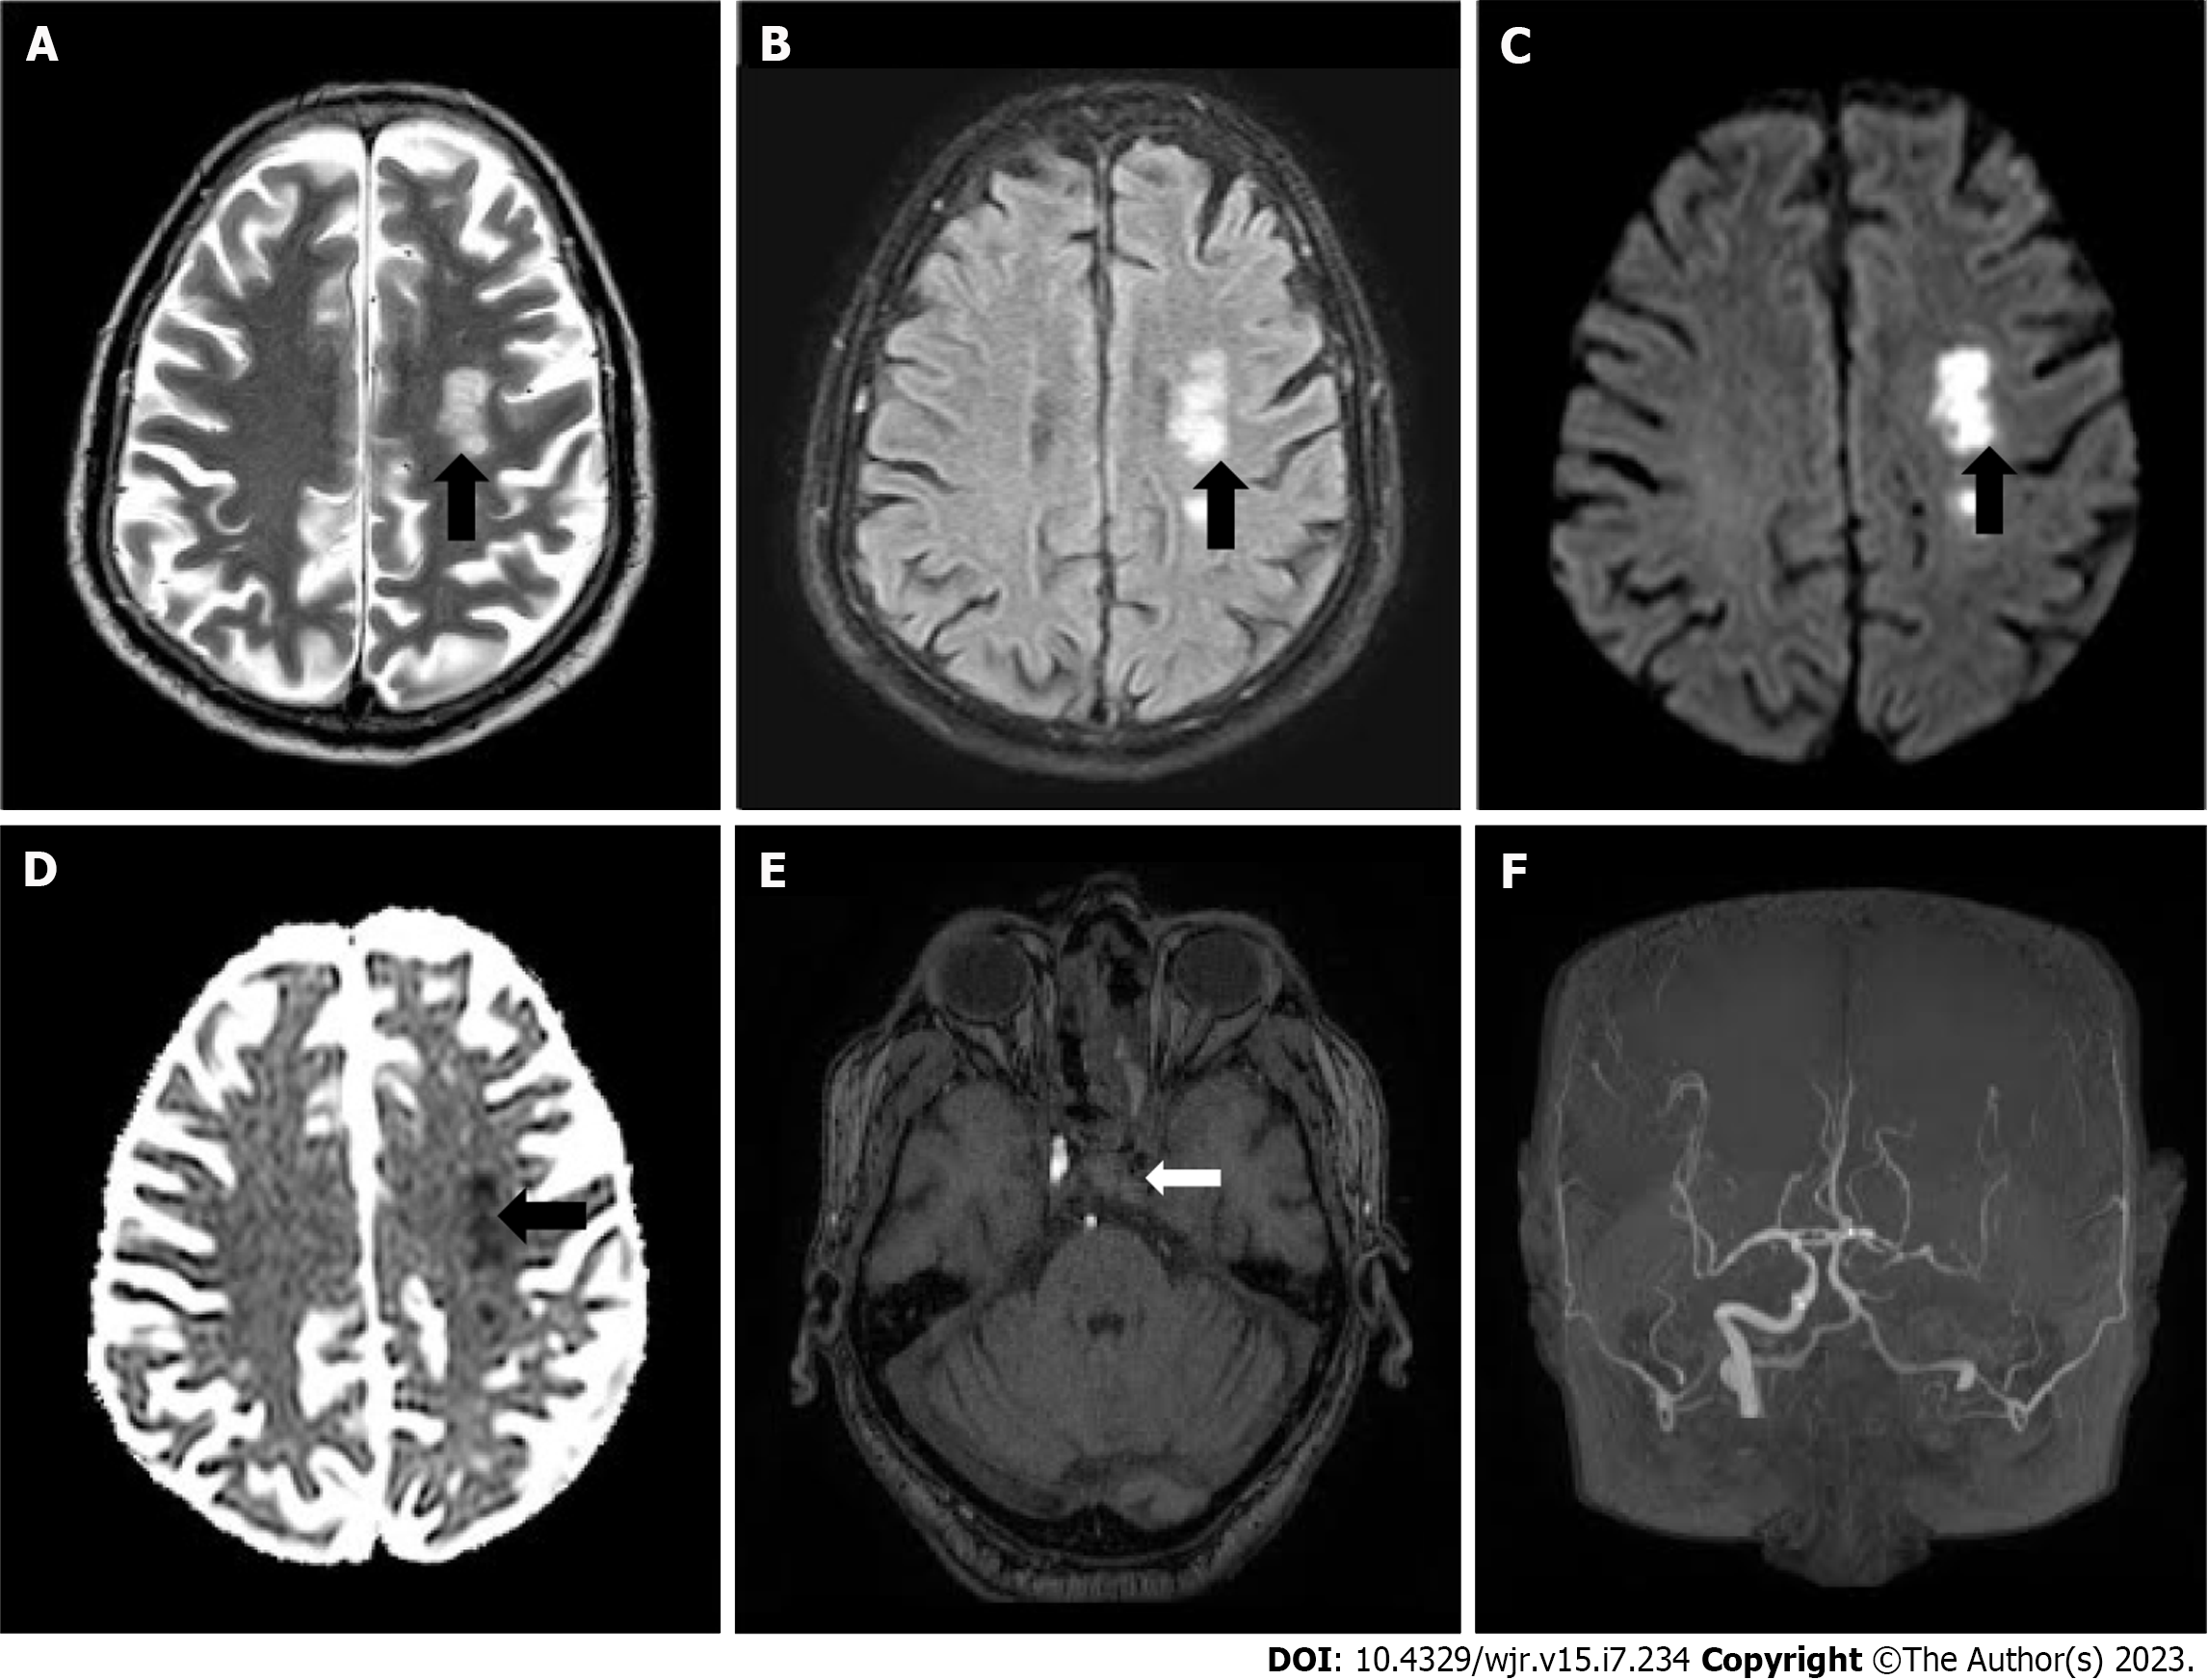
Figure 2 Images of patient with post COVID-19 mucormycosis.
A and B: Axial T2-weighted and axial fluid attenuated inversion recovery images of brain 15 d post admission demonstrating acute infarcts (black arrows); C and D: In left centrum semiovale with diffusion restriction on diffusion-weighted imaging and reversal on apparent diffusion coefficient represented by black arrows; E and F: Magnetic resonance angiography (MRA) images of Brain demonstrating loss of flow signal is noted in left internal carotid artery (white arrow) on source images and absent left internal carotid artery on maximum intensity projection MRA.
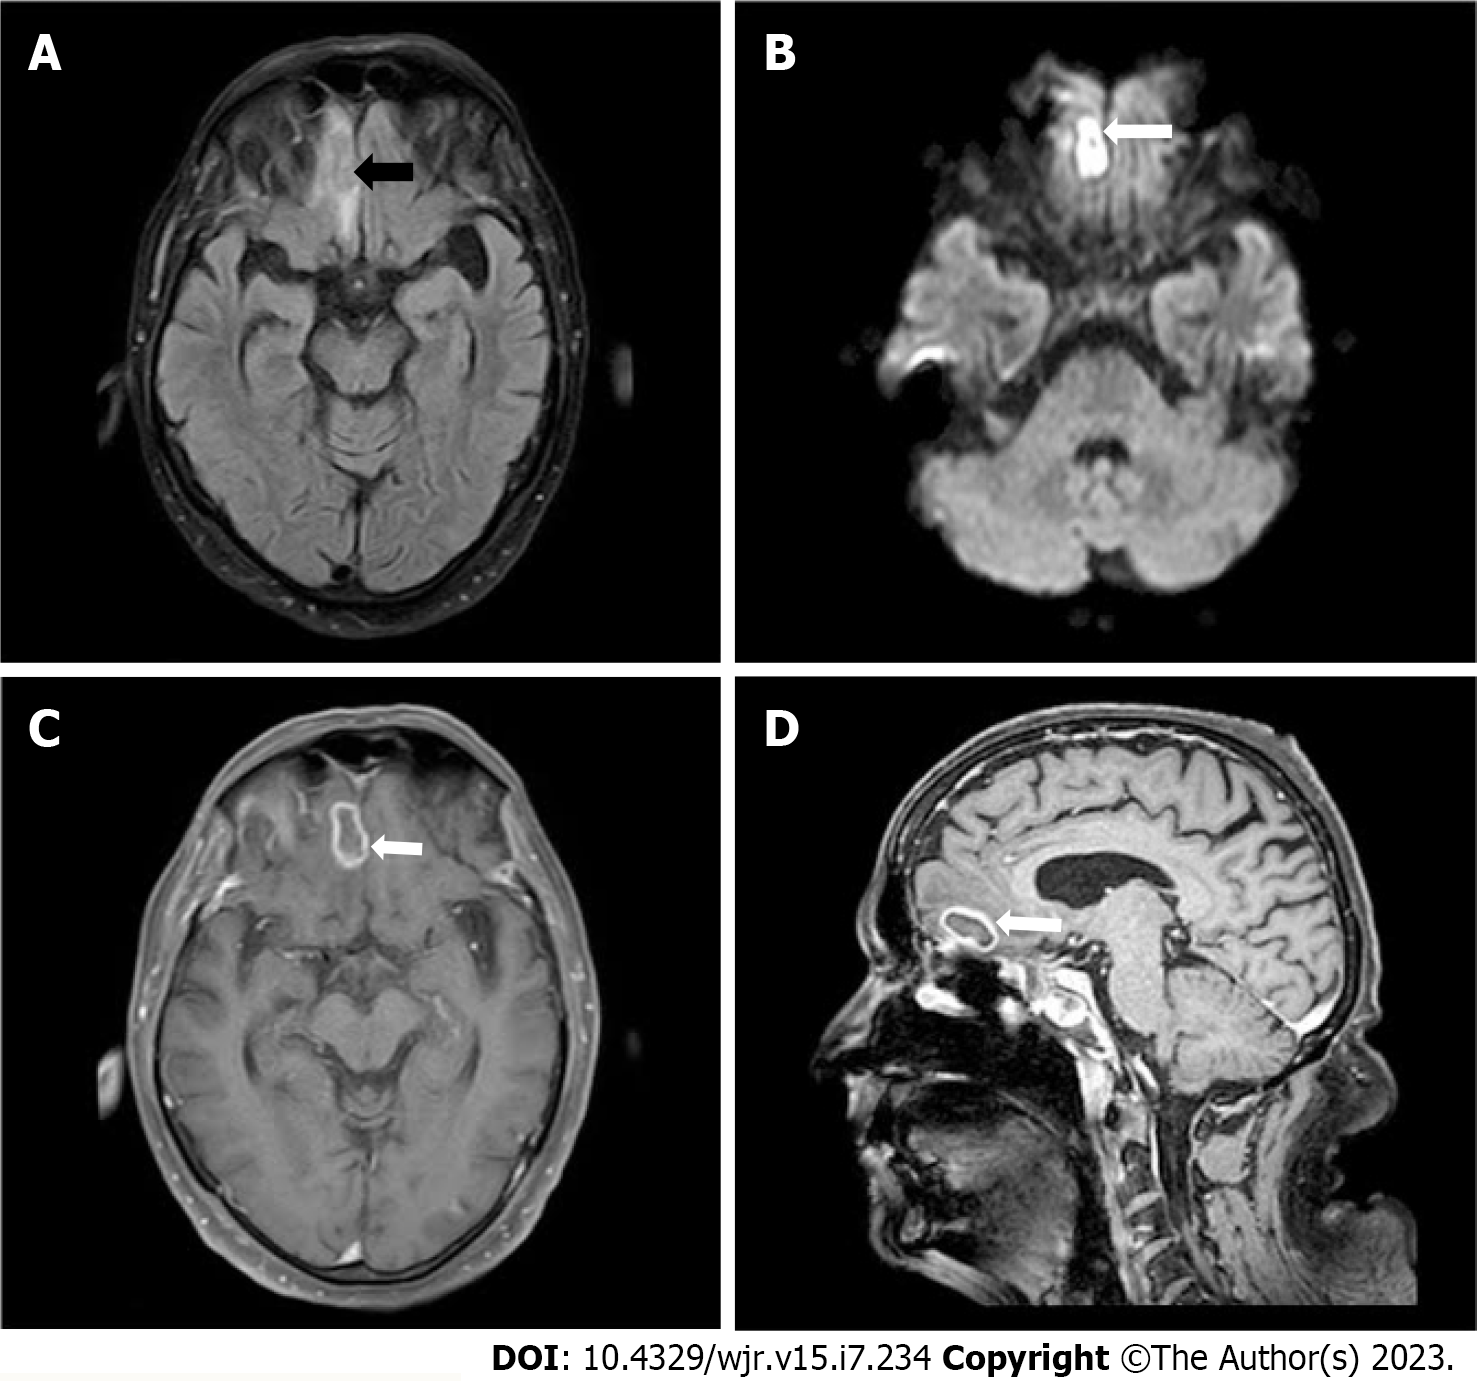
Figure 3 Images of patient with post COVID-19 mucormycosis.
A and B: Magnetic resonance imaging of brain after one month demonstrating isointense area with surrounding edema (black arrow) on axial fluid attenuated inversion recovery with restriction on diffusion-weighted imaging (white arrow); C and D: Post-contrast axial and sagittal T1 weighted images demonstrating rim enhancement of the lesion-s/ofungal abscess (white arrow).
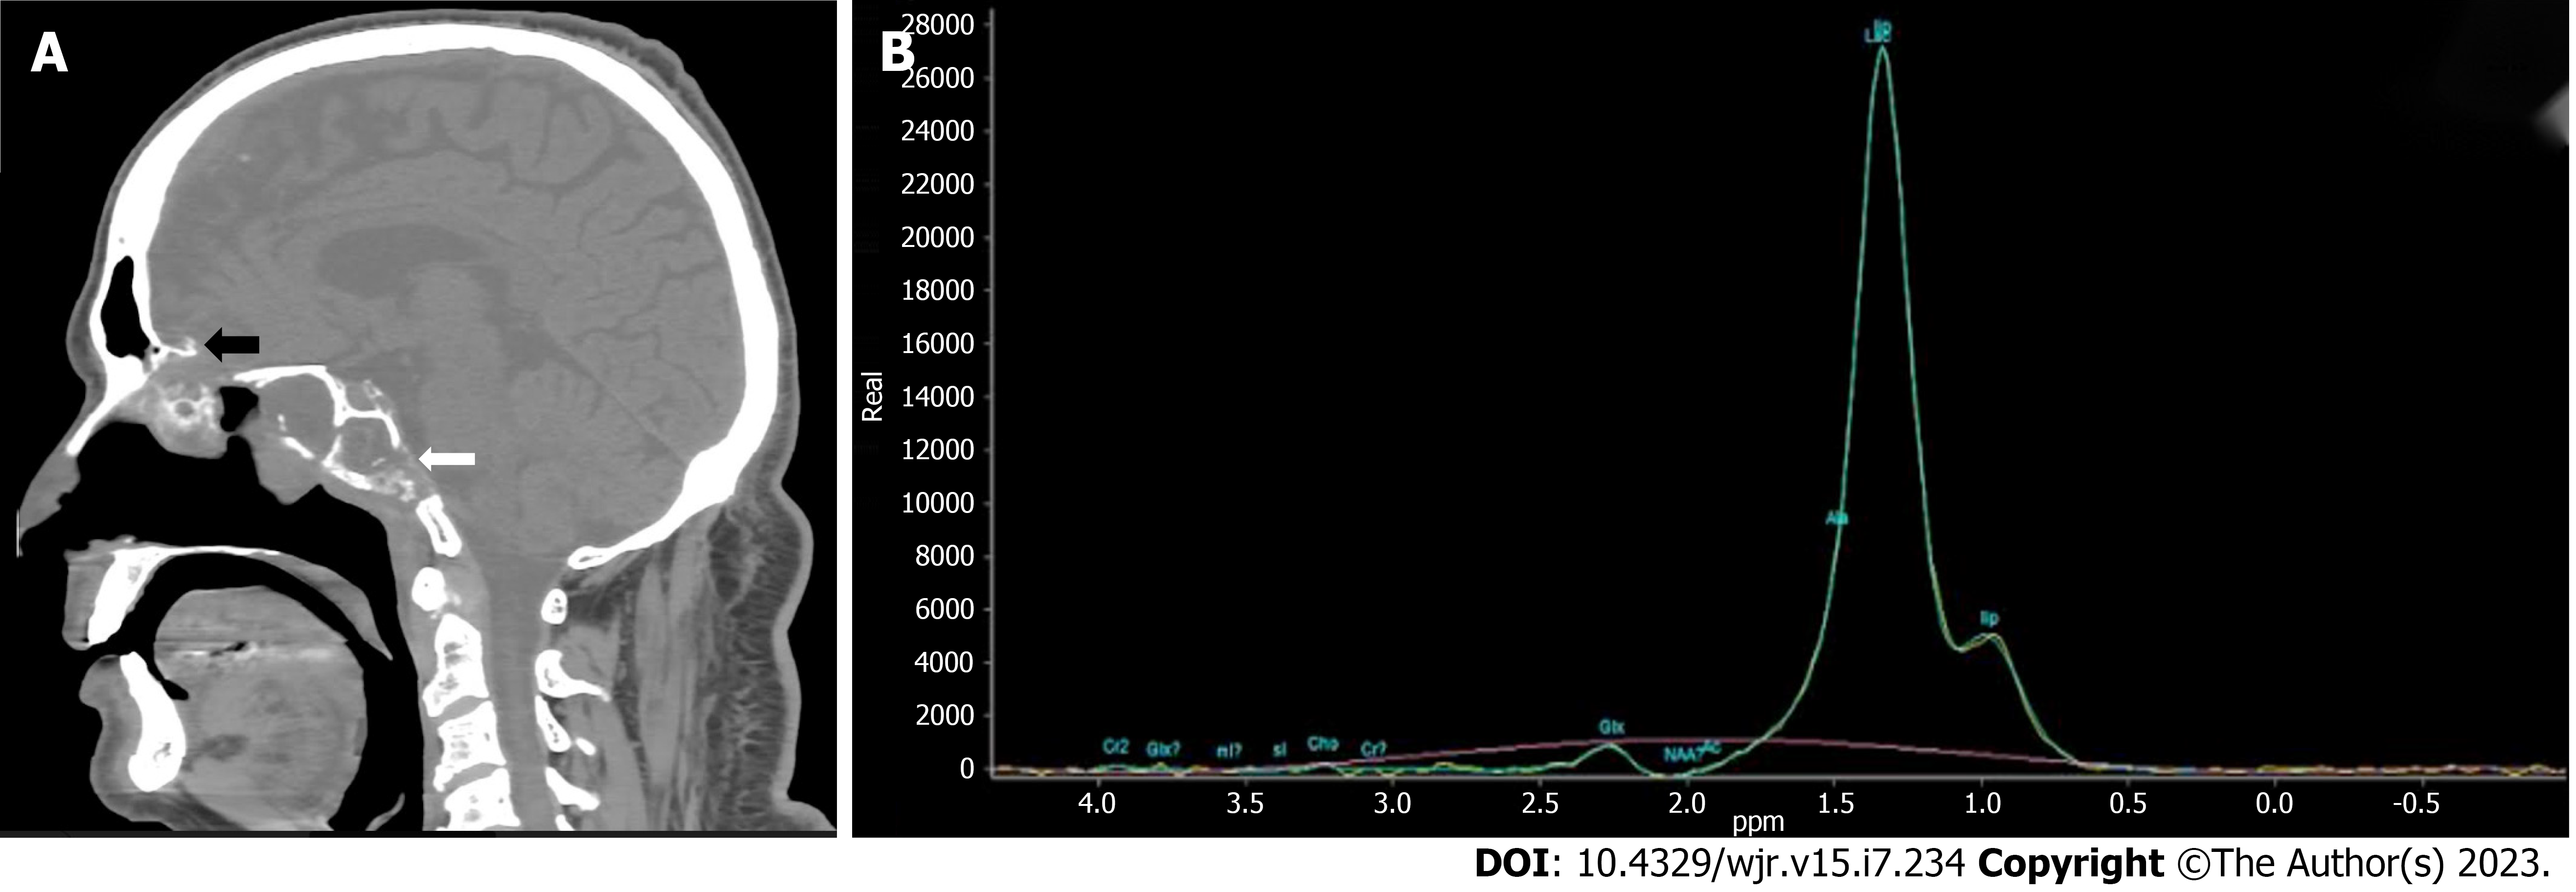
Figure 4 Images of patient with post COVID-19 mucormycosis.
A: Computerized tomography of brain after one month mid sagittal reformatted section in bone window demonstrating destruction of cribriform plate (black arrow), sphenoid sinus and clivus (white arrow); B: Magnetic resonance spectroscopy with a voxel placed in right frontal lobe fungal abscess demonstrating lactate peak at 1.33 ppm.
- Citation: Narra R, Rayapati S. Invasive rhinocerebral mucormycosis: Imaging the temporal evolution of disease in post COVID-19 case with diabetes: A case report. World J Radiol 2023; 15(7): 234-240
- URL: https://www.wjgnet.com/1949-8470/full/v15/i7/234.htm
- DOI: https://dx.doi.org/10.4329/wjr.v15.i7.234


