Copyright
©The Author(s) 2023.
World J Radiol. Jun 28, 2023; 15(6): 201-215
Published online Jun 28, 2023. doi: 10.4329/wjr.v15.i6.201
Published online Jun 28, 2023. doi: 10.4329/wjr.v15.i6.201
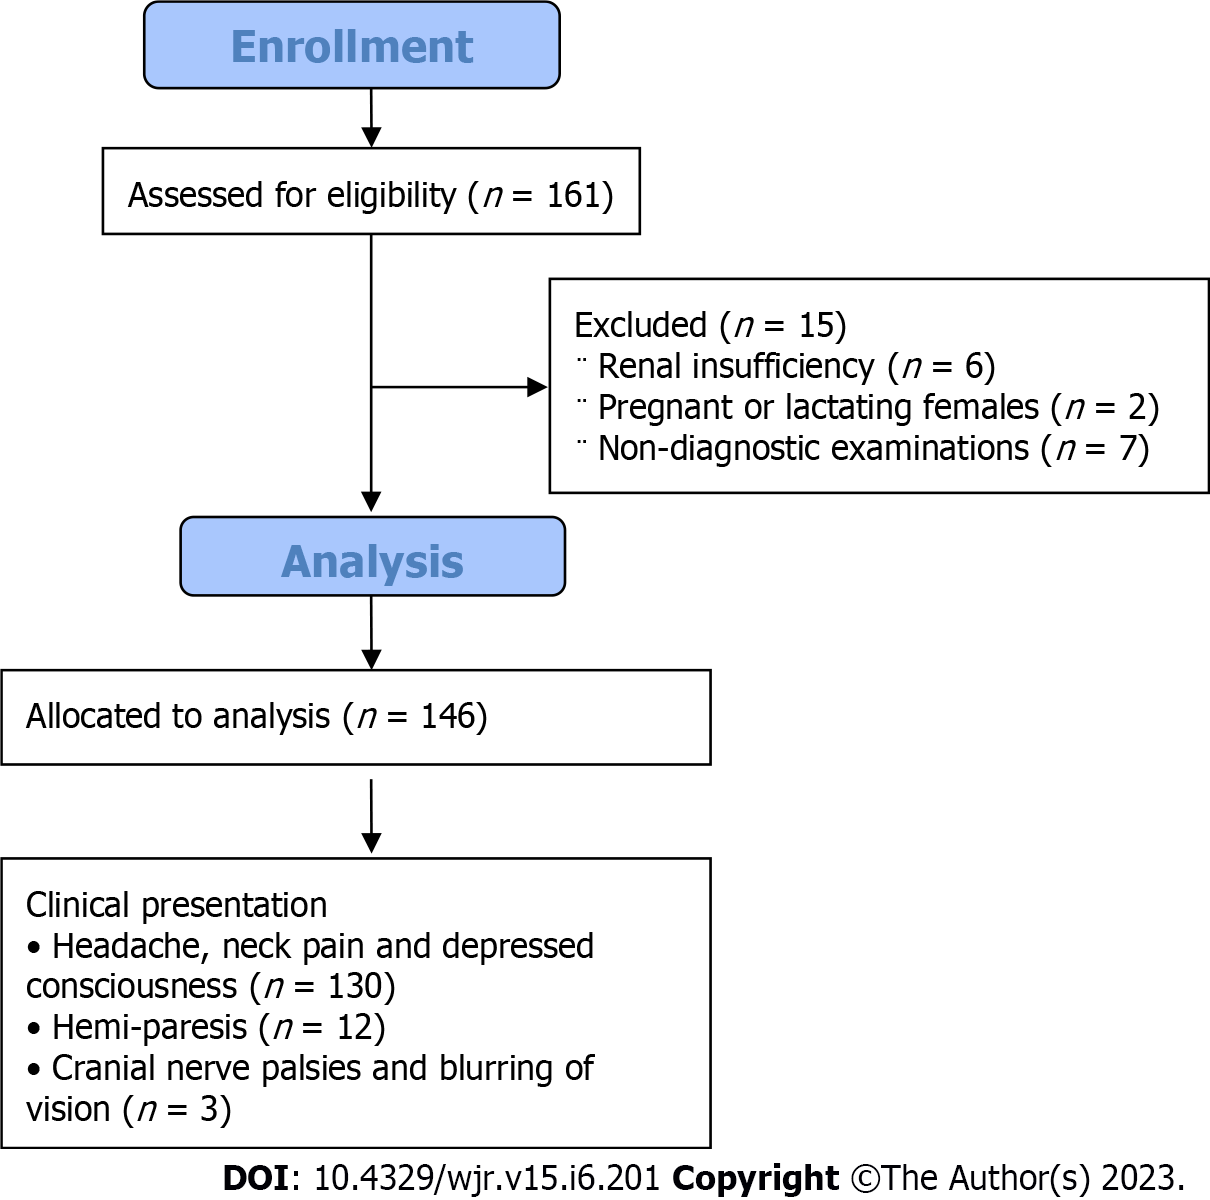
Figure 1 Flow chart of the study.
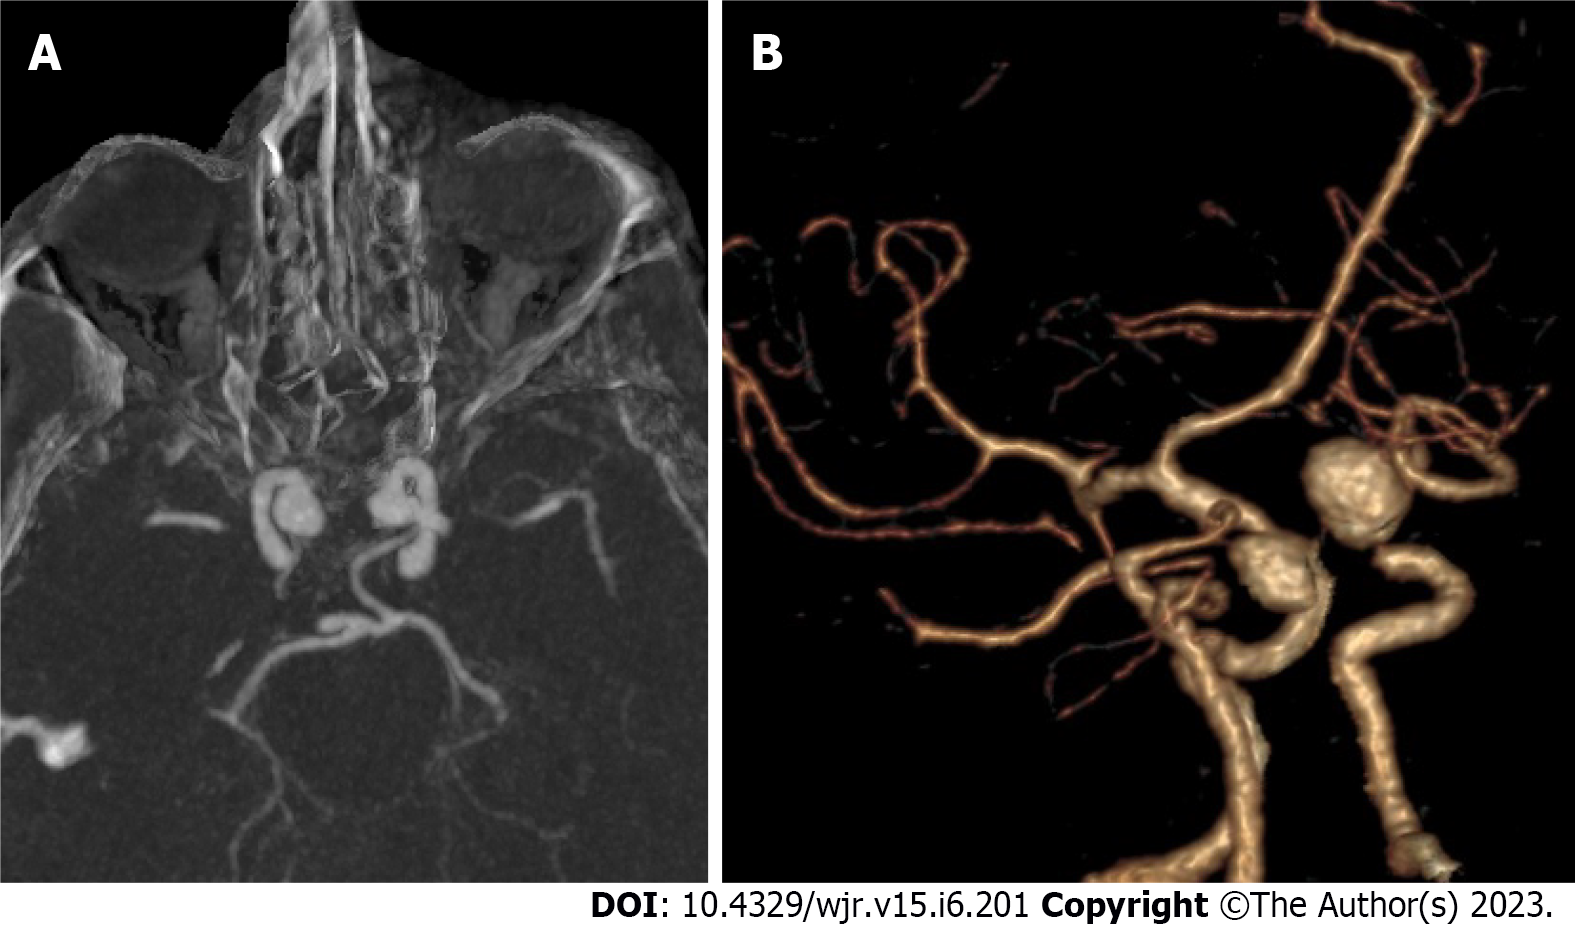
Figure 2 Mirror image intracranial aneurysms.
A: Axial computed tomography angiography (CTA) in maximum intensity projection; B: Three-dimensional CTA for mirror image internal carotid artery aneurysm.
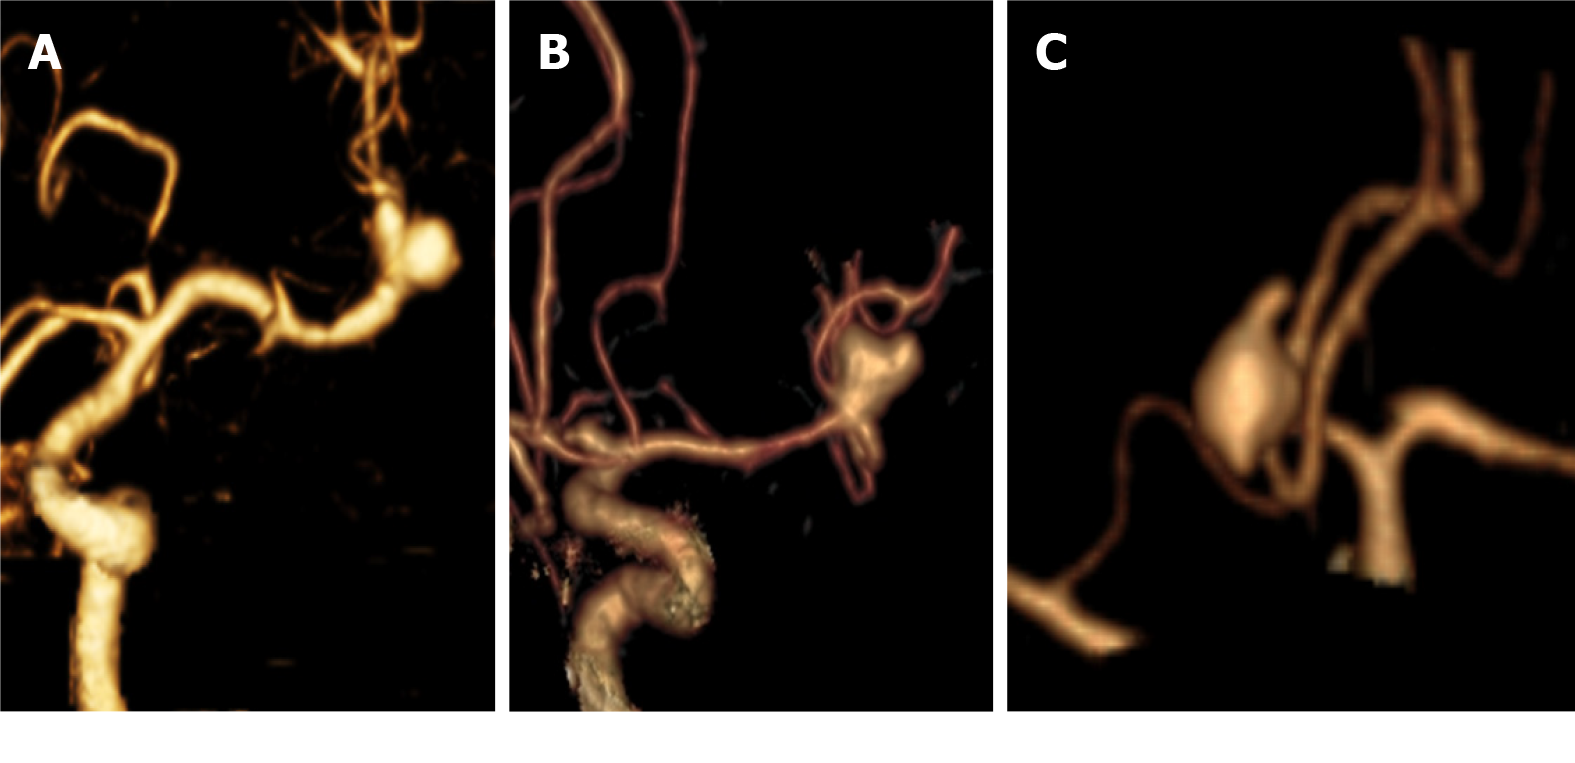
Figure 3 Morphology of intracranial aneurysms.
A: Three-dimensional (3D)-computed tomography angiography (3D-CTA) for saccular aneurysm at middle cerebral artery (MCA) bifurcation with smooth margins; B: 3D-CTA for saccular aneurysm at MCA bifurcation with daughter sac; C: 3D-CTA for Acom saccular aneurysm with multiple blebs.
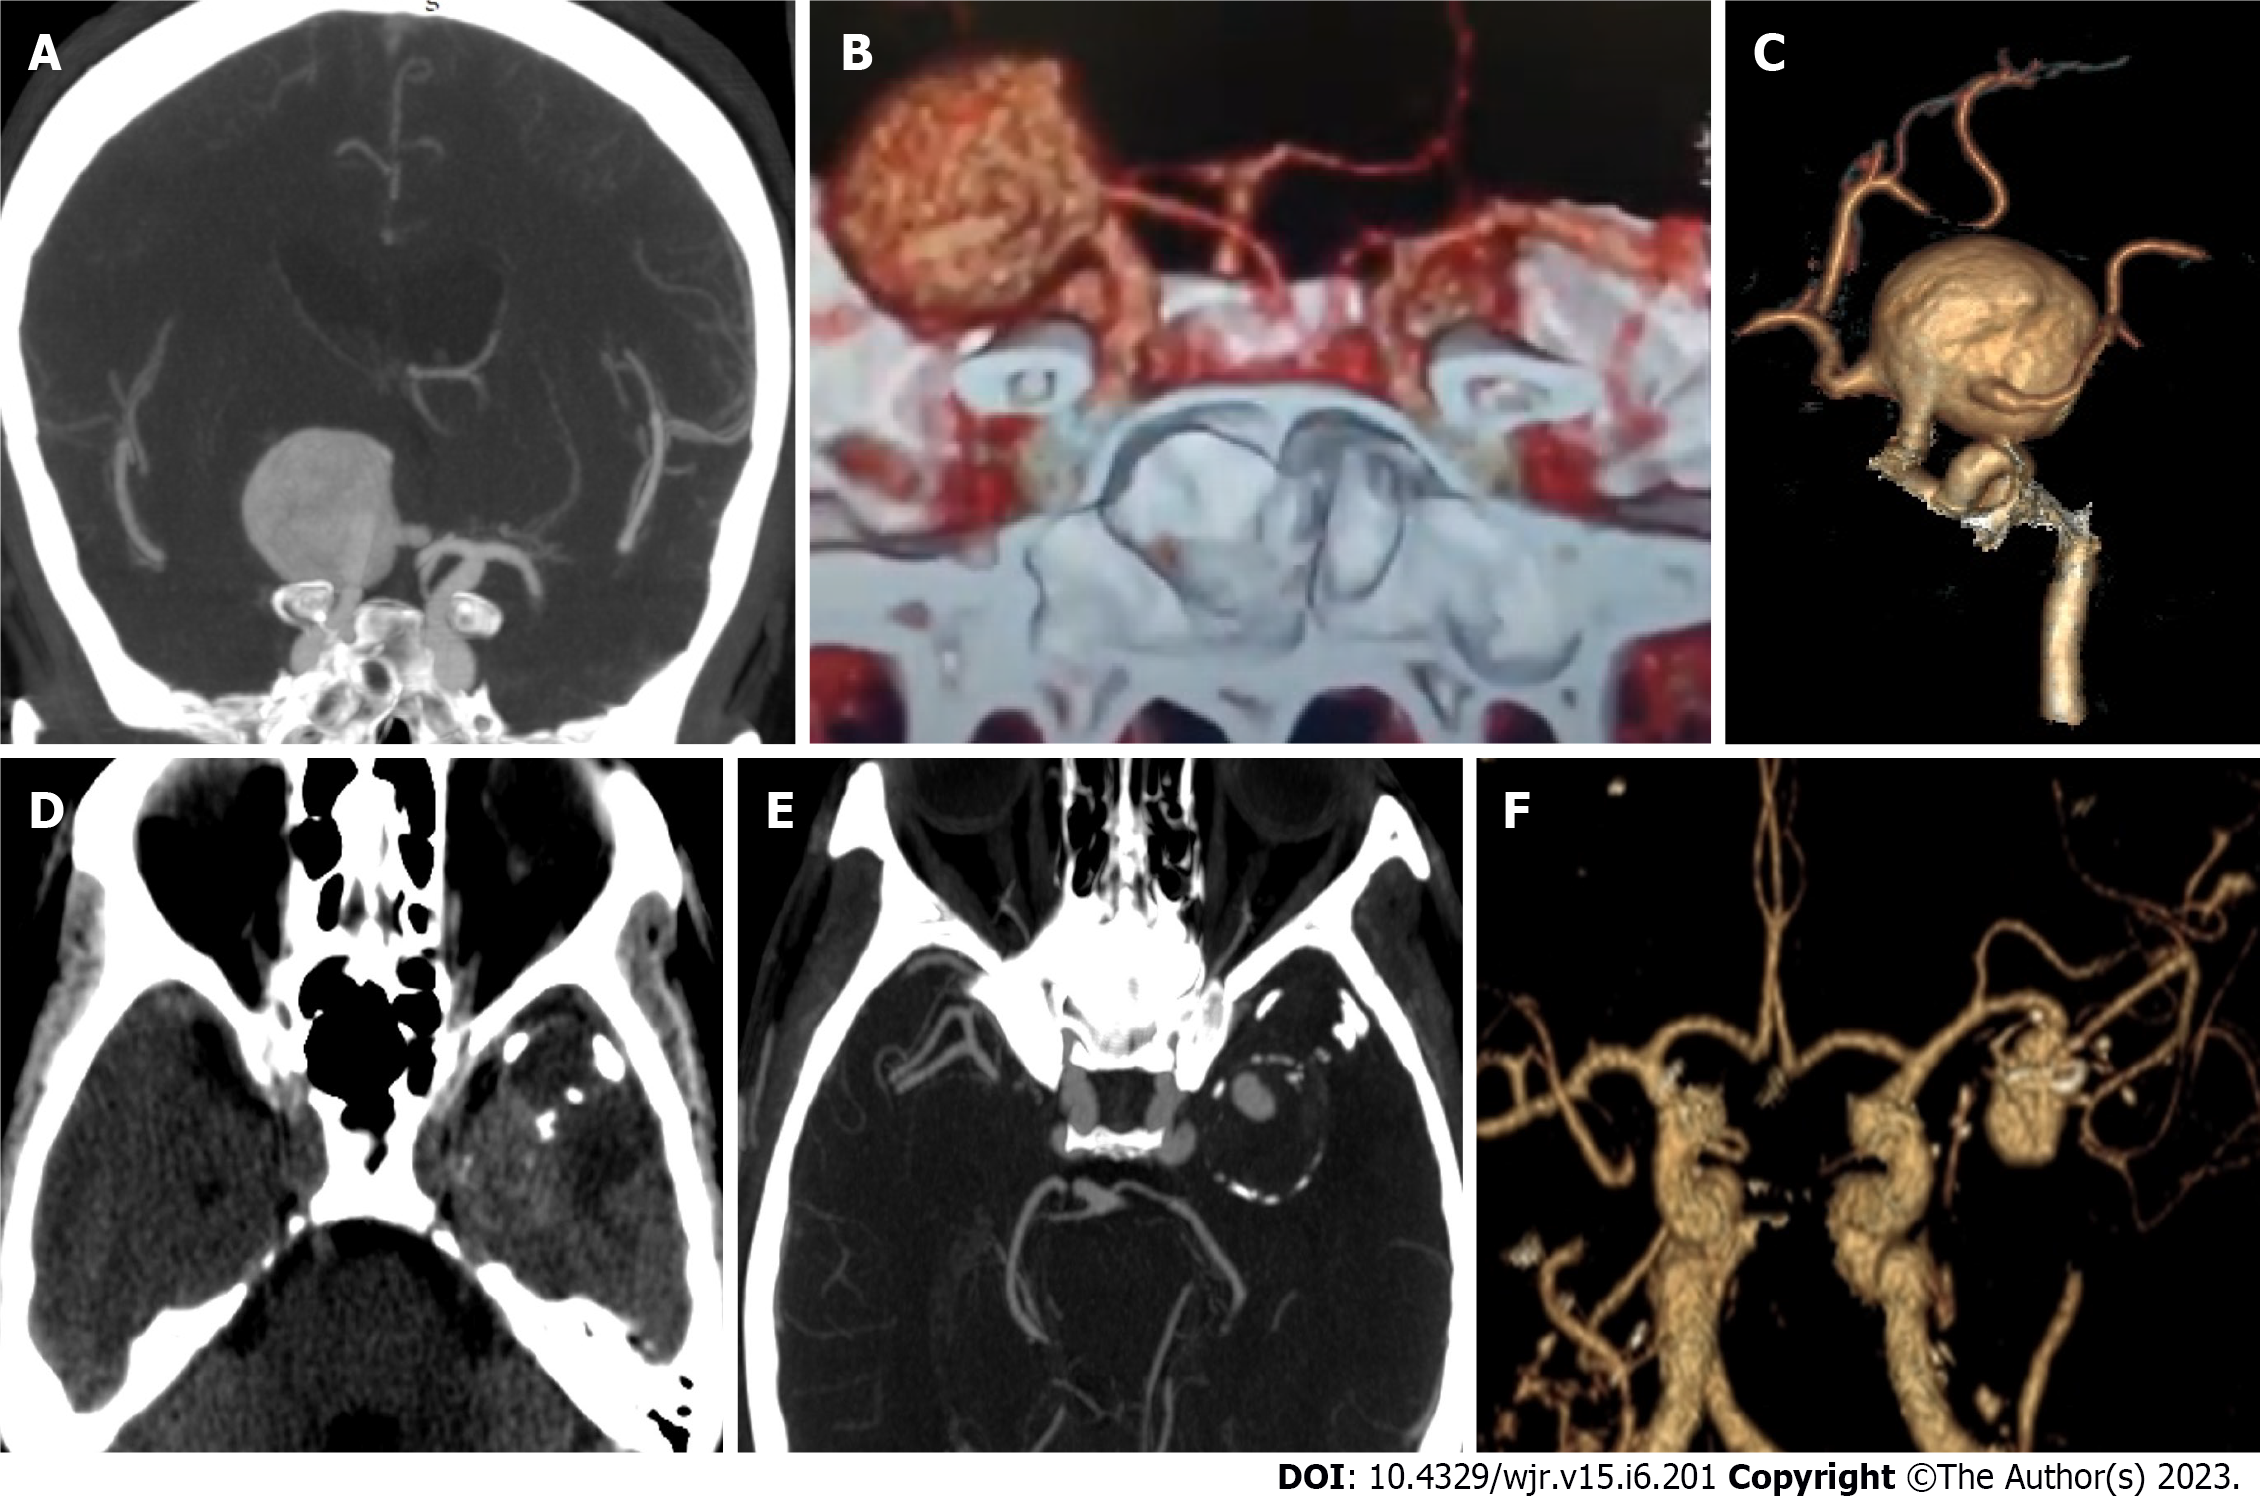
Figure 4 Giant intracranial aneurysms.
A: Axial computed tomography angiography (CTA) in maximum intensity projection (MIP); B and C: Three-dimensional (3D)-CTA for giant saccular aneurysm arising from right internal carotid artery and incorporating the origin of anterior cerebral artery and middle cerebral artery (MCA); D: non-contrast computed tomography for another patient shows a well defined lobulated lesion of mixed density in the left temporal lobe with foci of peripheral calcification; E: MIP-CTA axial image shows giant partially thrombosed saccular aneurysm of left MCA; F: 3D–CTA image shows a patent portion of left MCA aneurysm.
Figure 5 Anatomical variants with intracranial aneurysms.
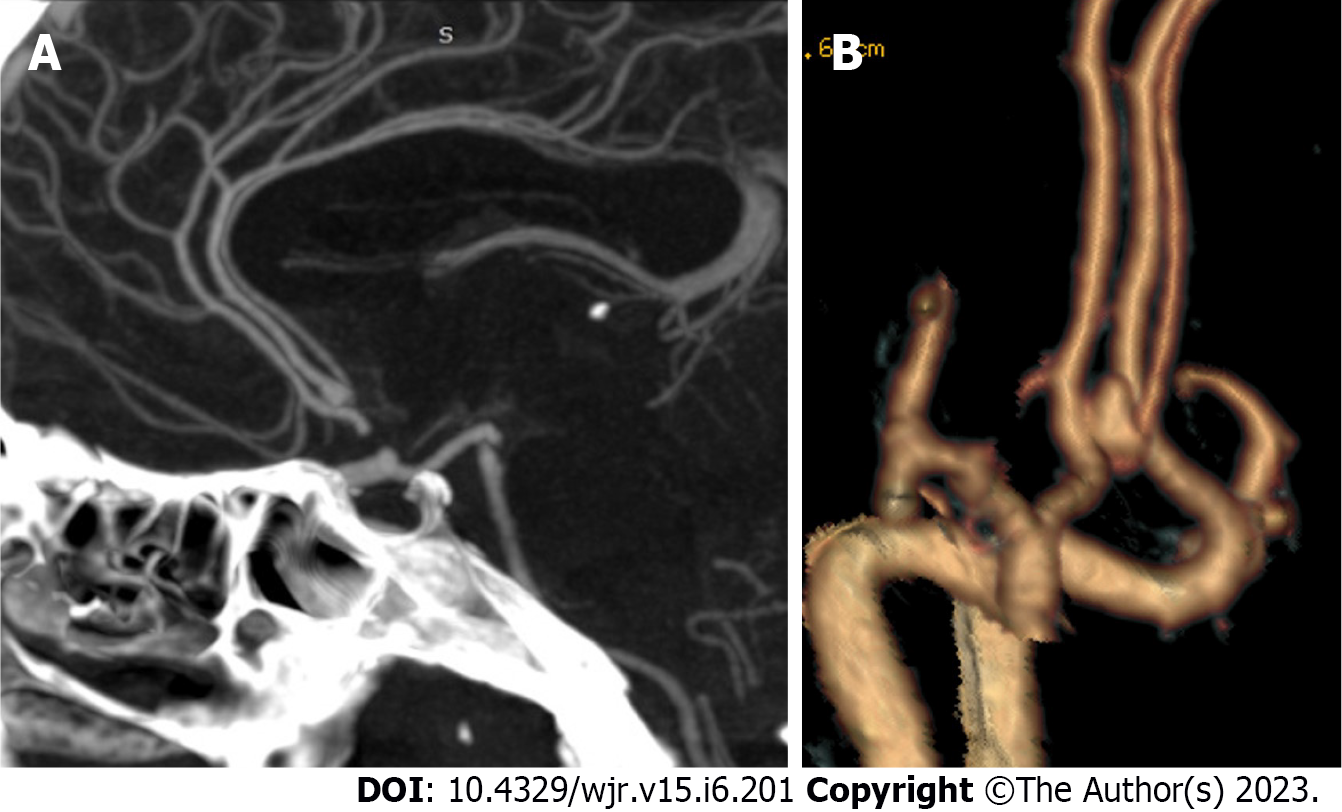
A: Sagittal reformatted maximum intensity projection-computed tomography angiography (CTA); B: Three-dimensional-CTA for a saccular aneurysm at anterior cerebral artery trifurcation.
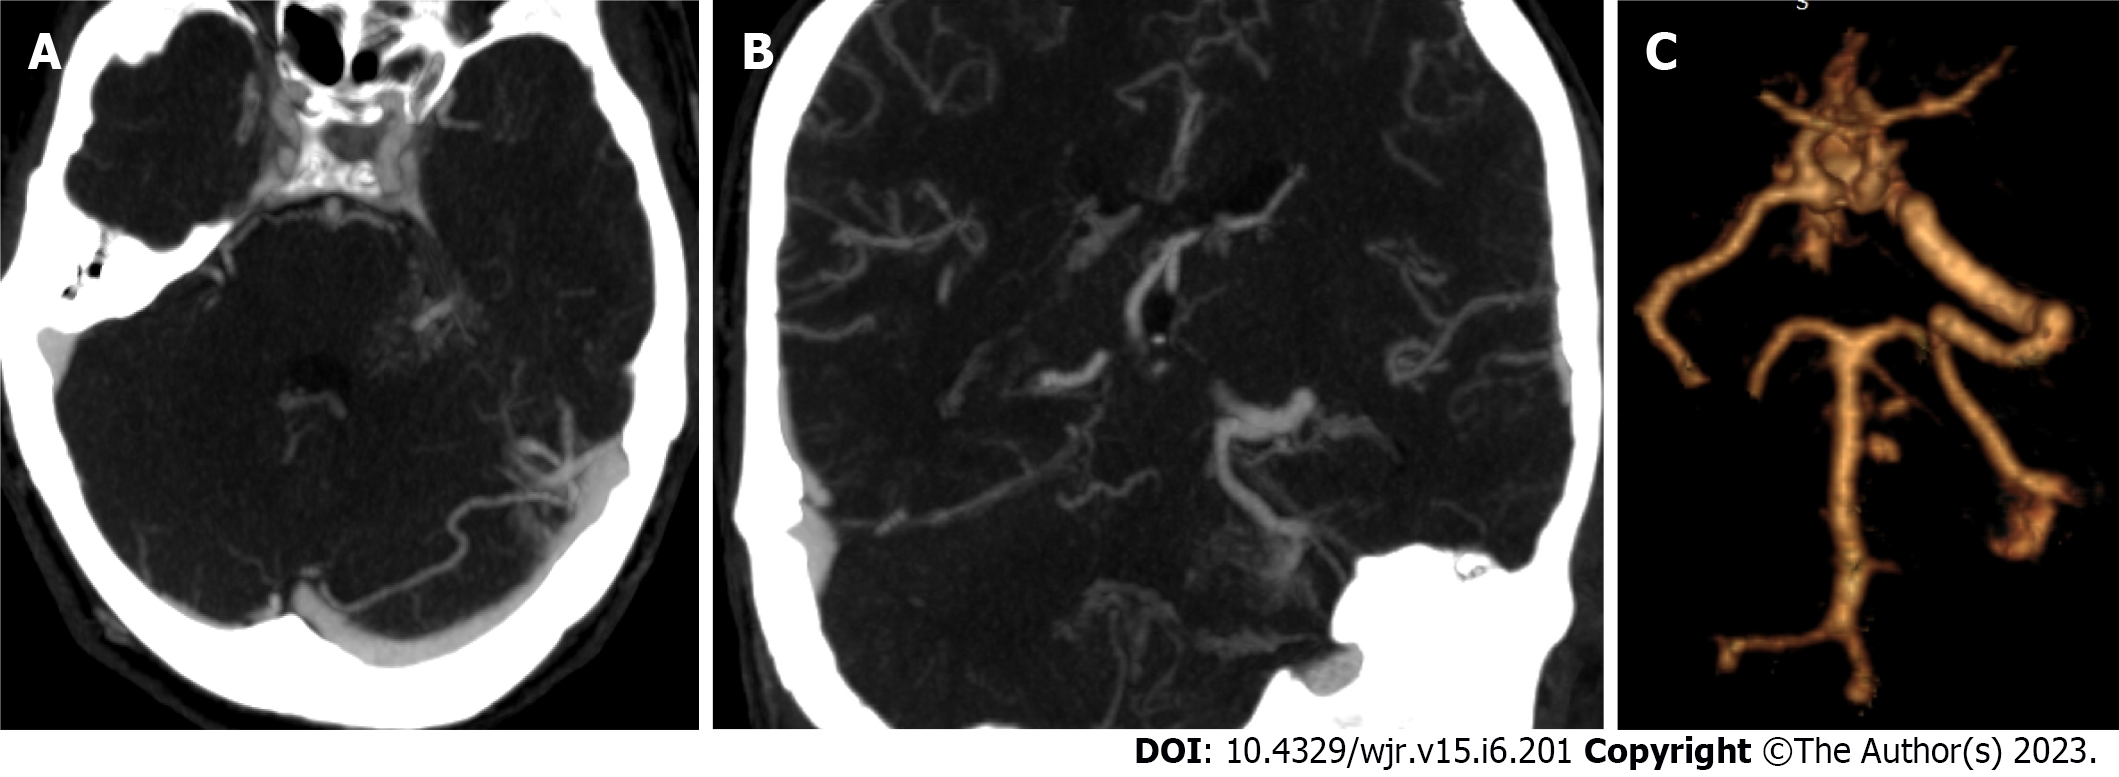
Figure 6 Vascular malformation with intracranial aneurysms.
A: Axial maximum intensity projection (MIP)-computed tomography angiography (CTA) shows a small saccular aneurysm that arises from the left basilar artery perforators; B: Coronal reformatted MIP-CTA shows left cerebellar developmental venous anomalies (DVA) drains into the left sigmoid sinus; C: Three-dimensional-CTA shows the basilar perforator aneurysms and the left cerebellar DVA.
Figure 7 Bony landmarks related to the aneurysm.
A: Three-dimensional (3D)-computed tomography angiography shows a posterior communicating artery aneurysm close to the anterior clinoid process; B: 3D-computed tomography (CT) for the skull base shows bridging sella and bony fusion; C: Post-operative 3D-CT shows partial clionoidectomy and metallic clip.
- Citation: Elmokadem AH, Elged BA, Abdel Razek A, El-Serougy LG, Kasem MA, EL-Adalany MA. Interobserver reliability of computed tomography angiography in the assessment of ruptured intracranial aneurysm and impact on patient management. World J Radiol 2023; 15(6): 201-215
- URL: https://www.wjgnet.com/1949-8470/full/v15/i6/201.htm
- DOI: https://dx.doi.org/10.4329/wjr.v15.i6.201


