Copyright
©The Author(s) 2023.
World J Radiol. May 28, 2023; 15(5): 146-156
Published online May 28, 2023. doi: 10.4329/wjr.v15.i5.146
Published online May 28, 2023. doi: 10.4329/wjr.v15.i5.146
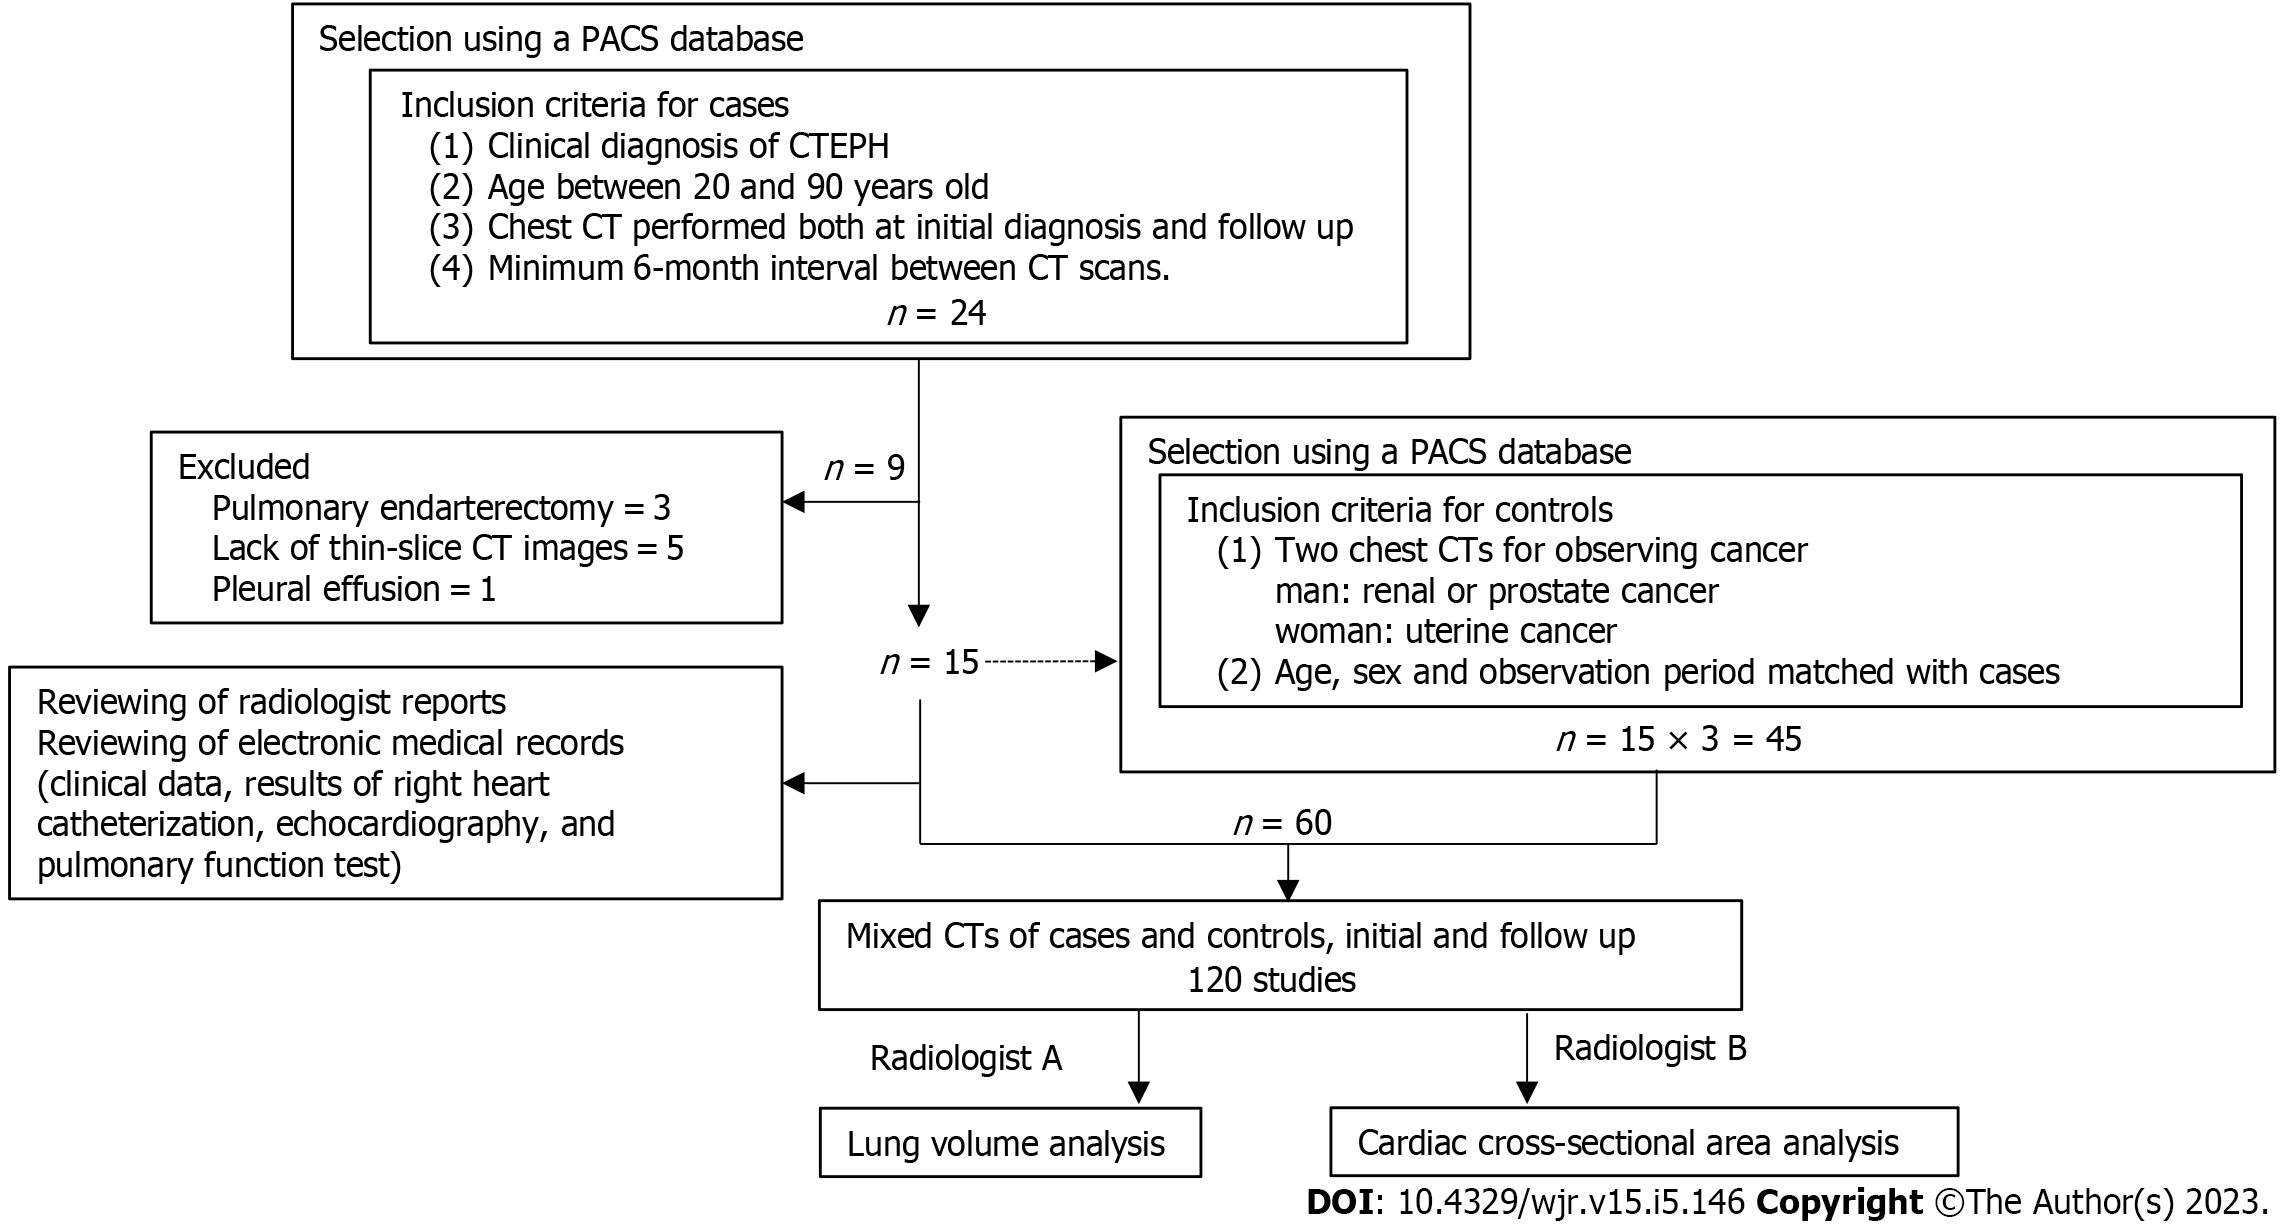
Figure 1 Study flow chart.
CT: Computed tomography; CTEPH: Chronic thromboembolic pulmonary hypertension; PACS: Picture archiving and communications system.
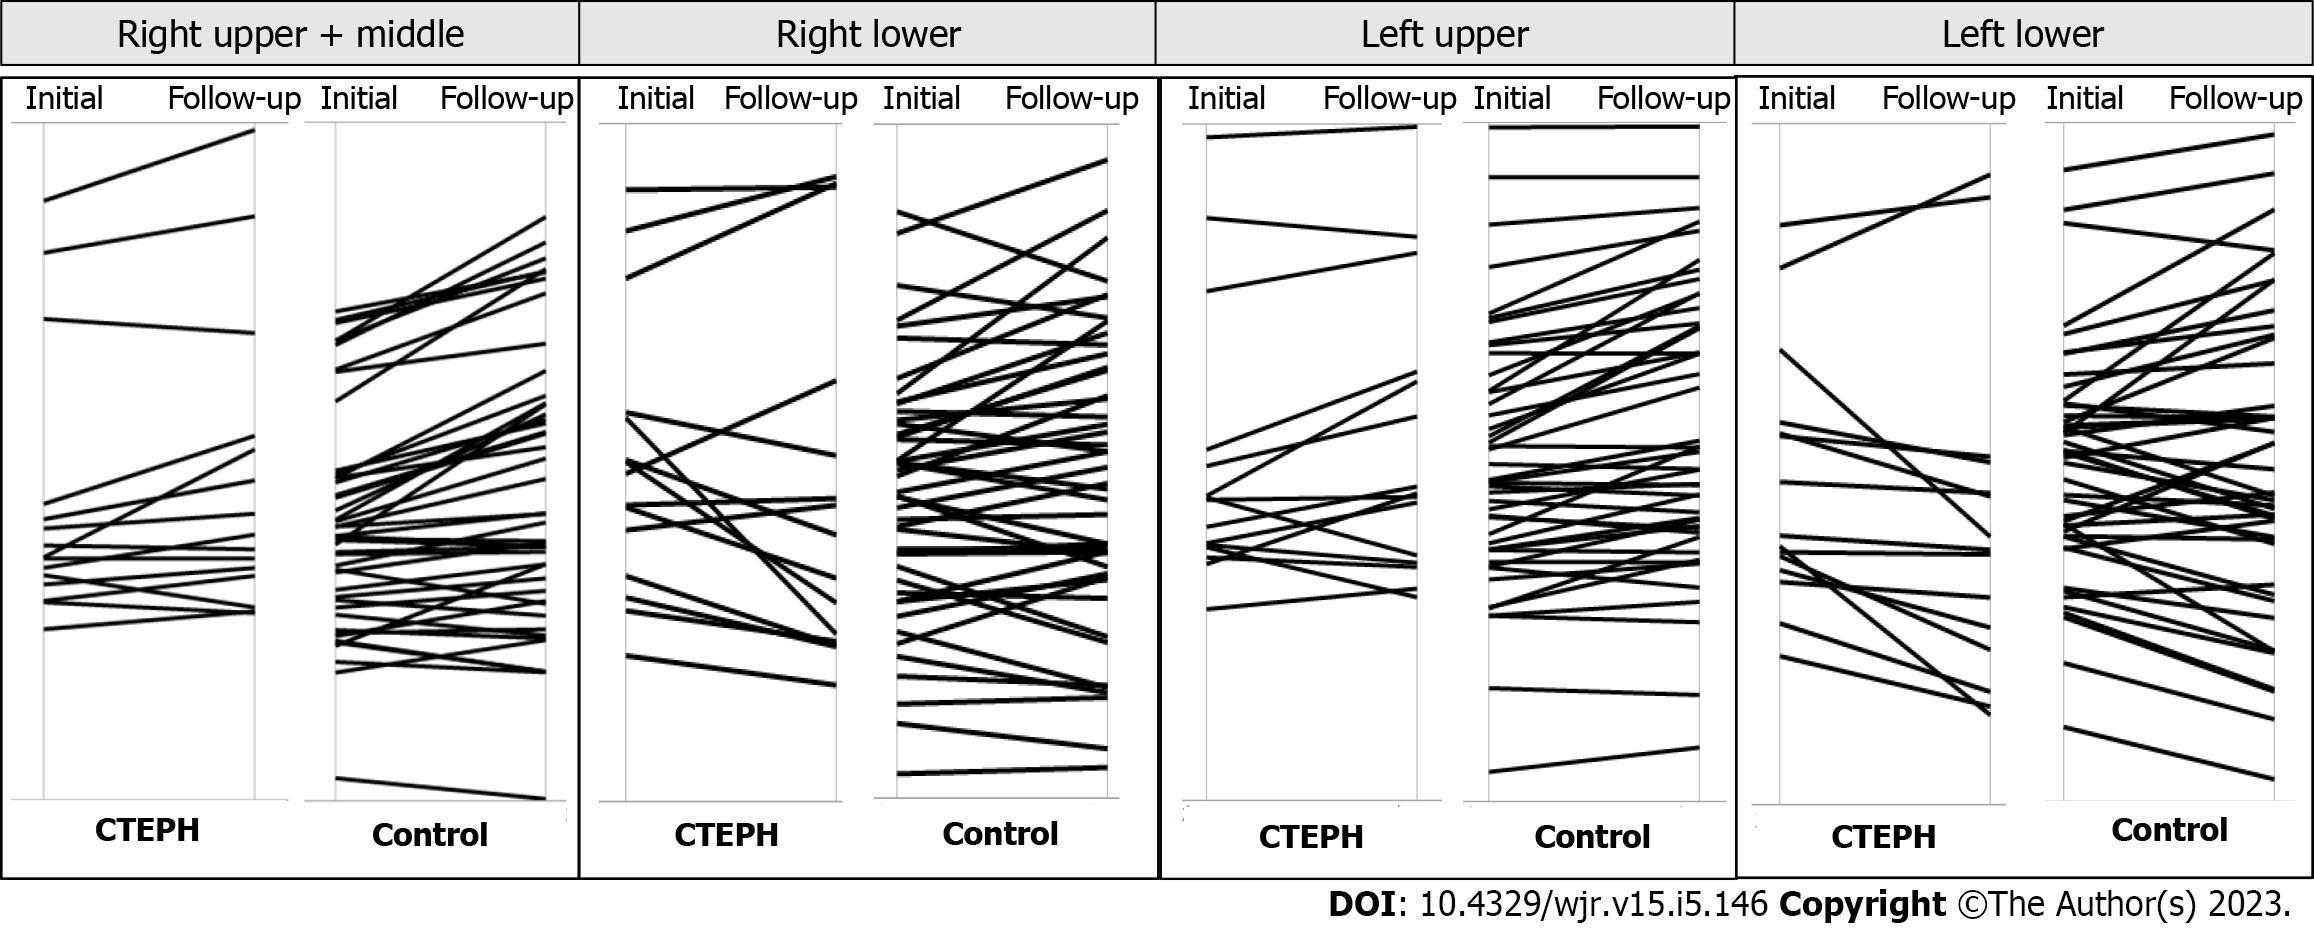
Figure 2 Parallel plots between initial computed tomography and follow-up computed tomography.
The right lower lung volume decreased significantly over time in the chronic thromboembolic pulmonary hypertension (CTEPH) group. There were no significant changes in lung volume in the control group.
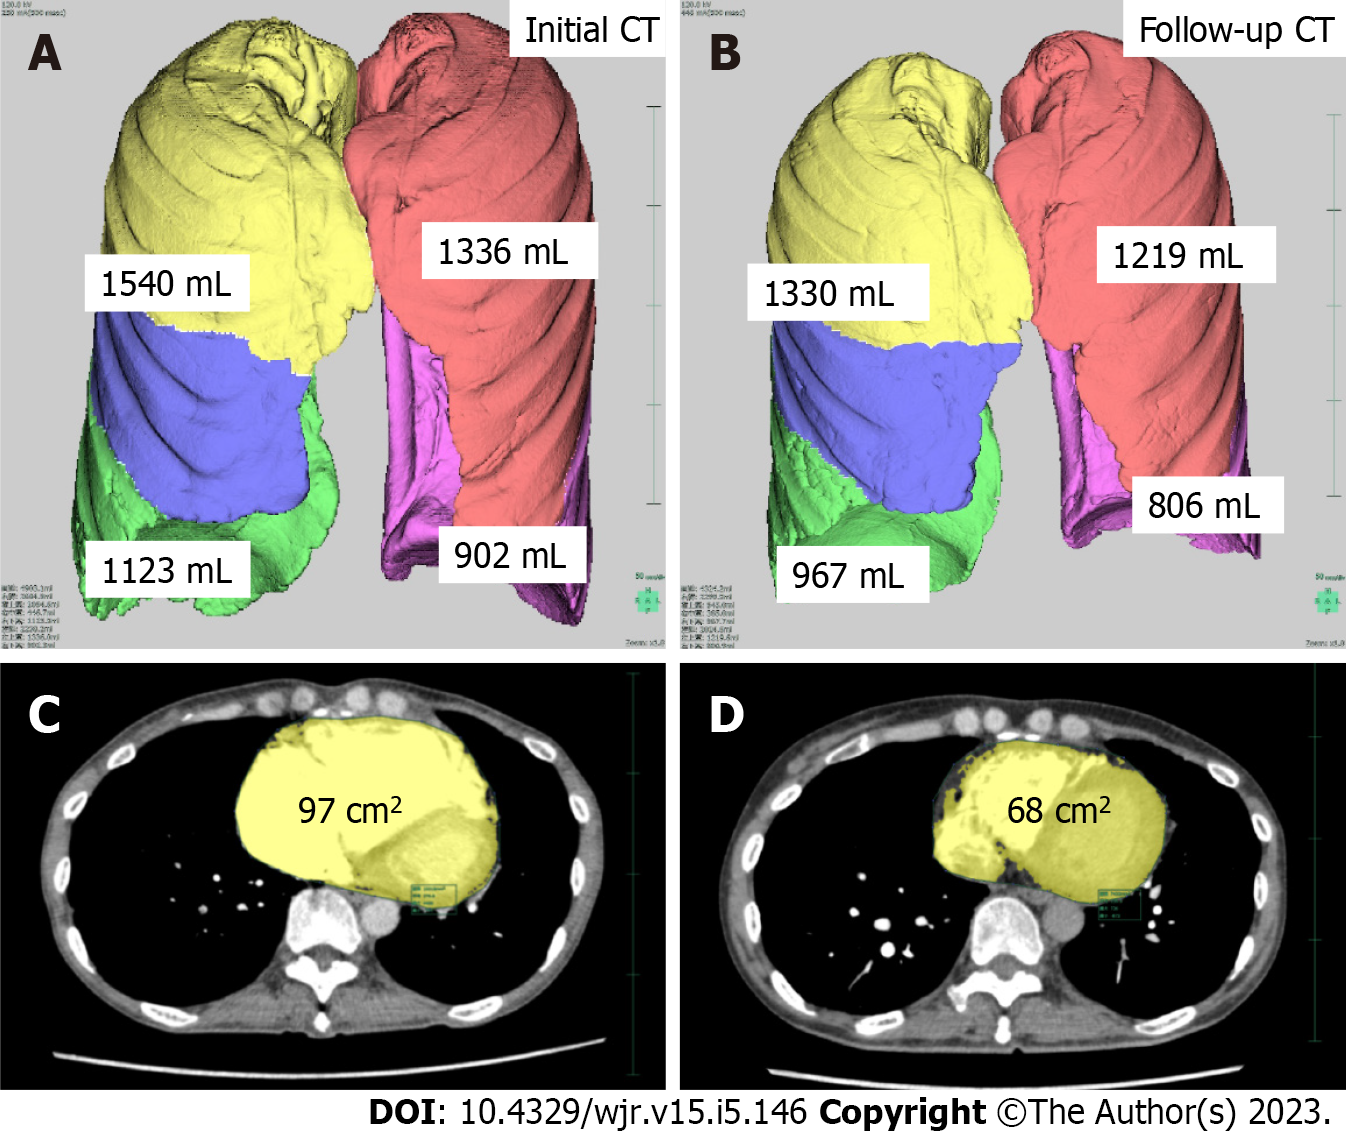
Figure 3 A 55-year-old female with chronic thromboembolic pulmonary hypertension was observed for 15 mo.
A: The lung lobar volumes before treatment; B: The lung lobar volumes after treatment showed a loss of volume from both lung bases; C: The cardiac cross-sectional area was improved after balloon pulmonary angioplasty; D: The right ventricle returned to a normal size. CT: Computed tomography.
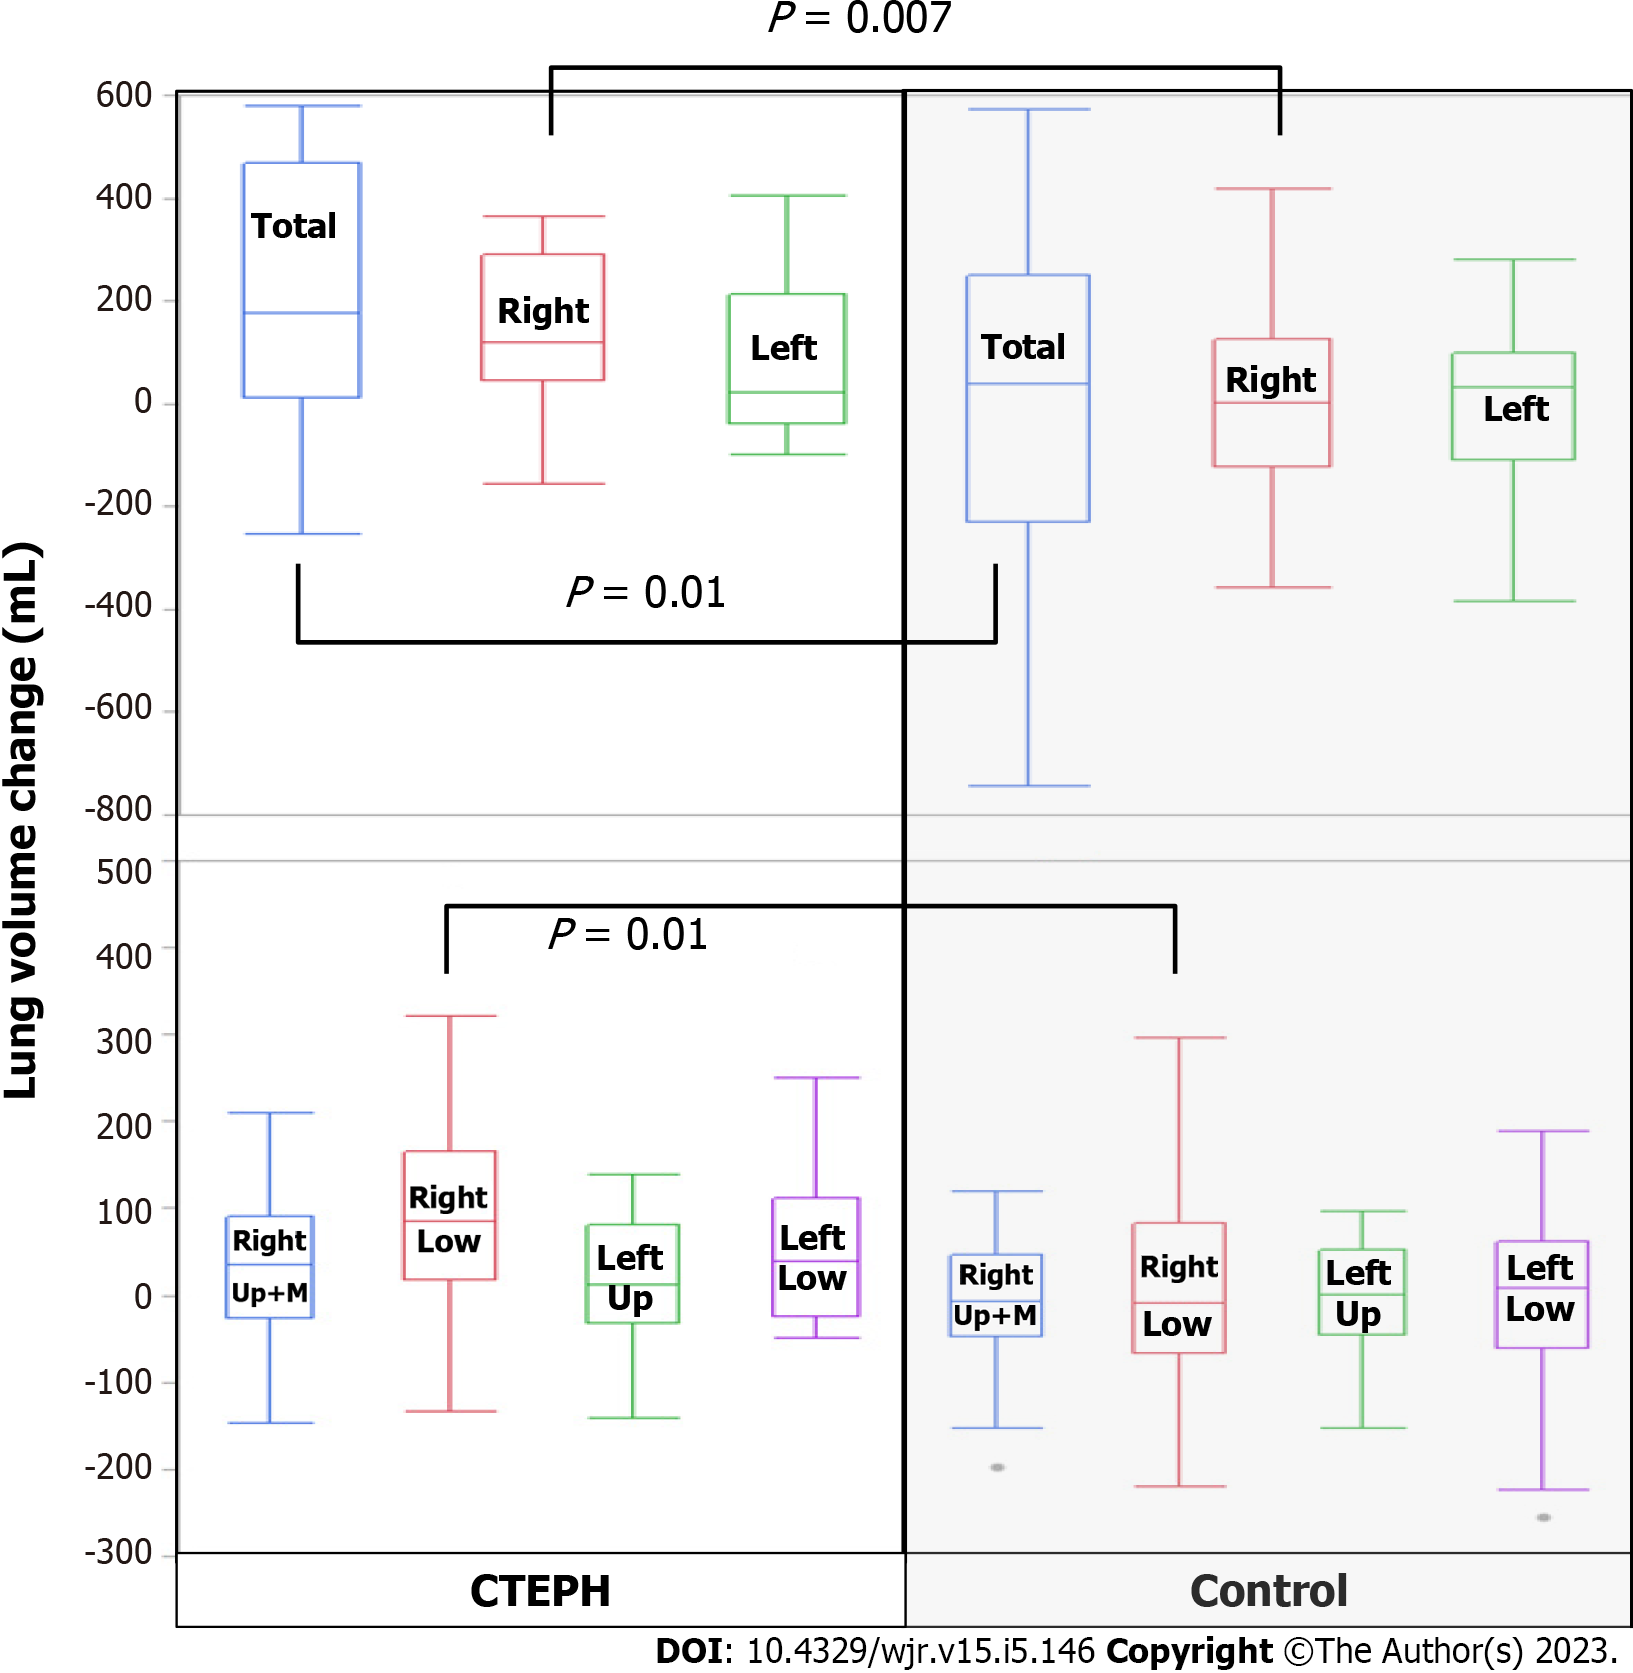
Figure 4 Box and whisker plots of individuals with chronic thromboembolic pulmonary hypertension and individuals in the control group.
There were significant changes over time in the total lung, right lung, and right lower lobe but not the right upper and middle lobes. There was no significant change in volume in the left lung, left upper lobe, or left lower lobe. CTEPH: Chronic thromboembolic pulmonary hypertension; Up: Upper lobe; M: Middle lobe; Low: Lower lobe.
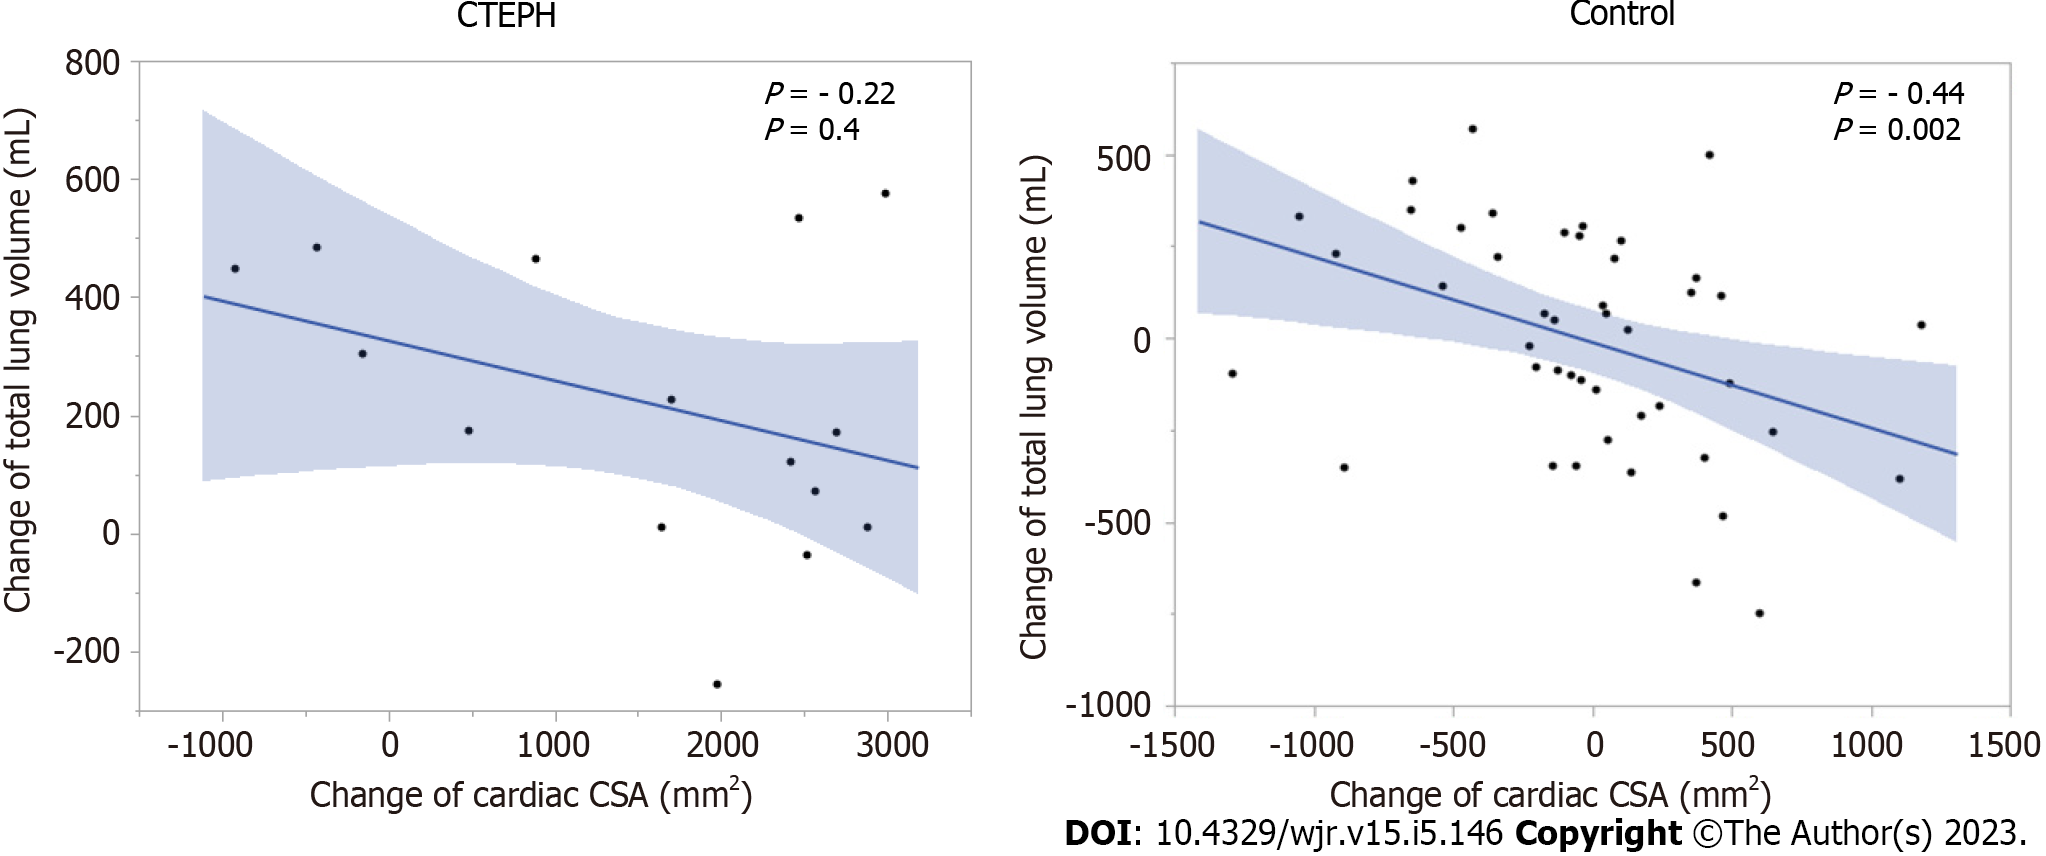
Figure 5 Relationship between lung volume change and cardiac cross-sectional area in patients with chronic thromboembolic pulmonary hypertension group and in the control group.
There was a negative correlation between total lung volume and cardiac cross-sectional area (CSA) in the control group but not in the chronic thromboembolic pulmonary hypertension (CTEPH) group.
- Citation: Tsuchiya N, Xu YY, Ito J, Yamashiro T, Ikemiyagi H, Mummy D, Schiebler ML, Yonemoto K, Murayama S, Nishie A. Chronic thromboembolic pulmonary hypertension is associated with a loss of total lung volume on computed tomography. World J Radiol 2023; 15(5): 146-156
- URL: https://www.wjgnet.com/1949-8470/full/v15/i5/146.htm
- DOI: https://dx.doi.org/10.4329/wjr.v15.i5.146


