Copyright
©The Author(s) 2023.
World J Radiol. Apr 28, 2023; 15(4): 98-117
Published online Apr 28, 2023. doi: 10.4329/wjr.v15.i4.98
Published online Apr 28, 2023. doi: 10.4329/wjr.v15.i4.98
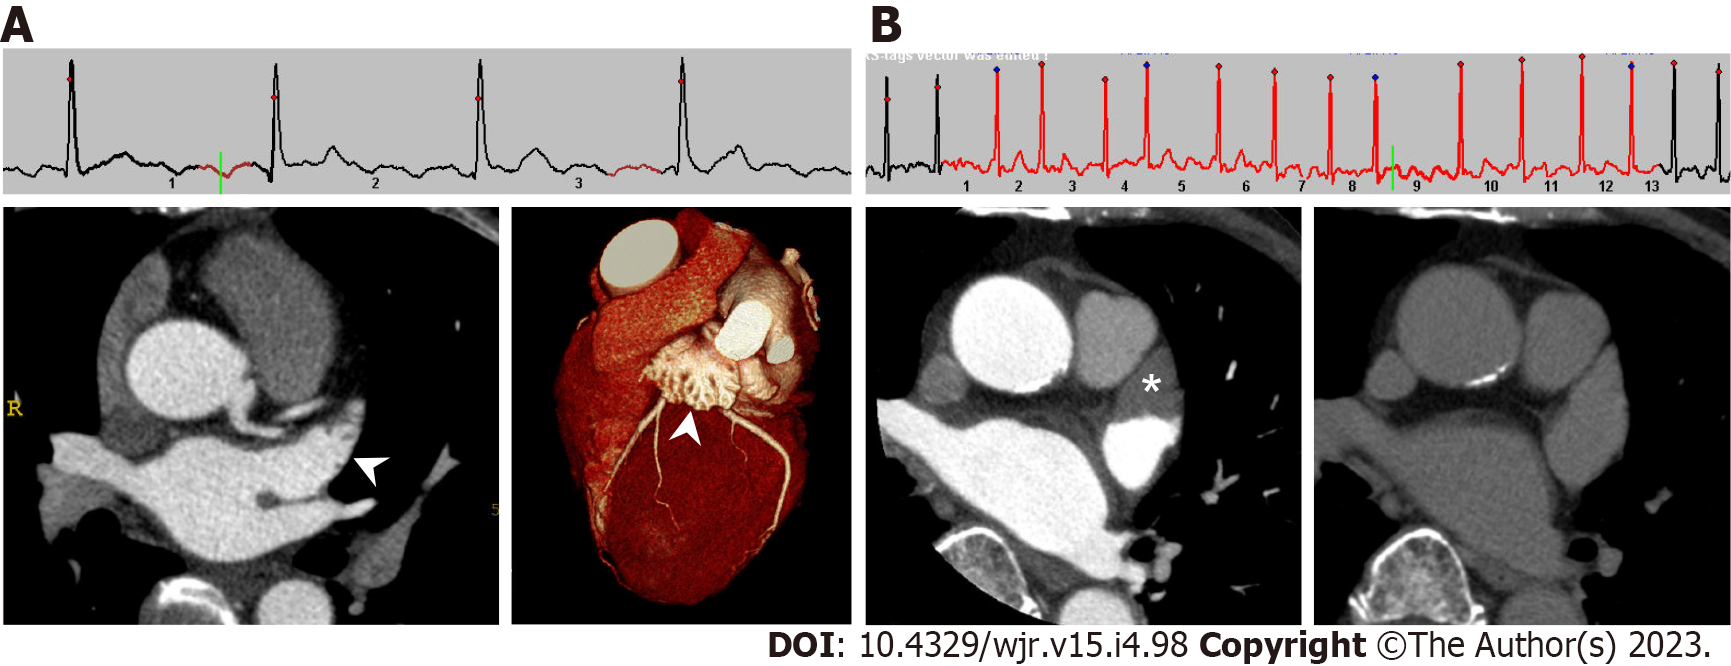
Figure 1 Cardiac computed tomography images of left atrial appendage in patients with sinus rhythm and atrial fibrillation.
A: Under normal sinus rhythm, left atrial appendage (LAA) is filled with contrast medium in early phase, which evaluates the coronary artery. Left: axial image; right: three-dimensional volume-rendered image; B: Under atrial fibrillation, axial early phase image shows triangular filling defect in LAA (left, asterisk). On delayed phase (right), LAA filling defect completely disappeared, which means the filling defect reflected blood stasis in LAA rather than thrombus.
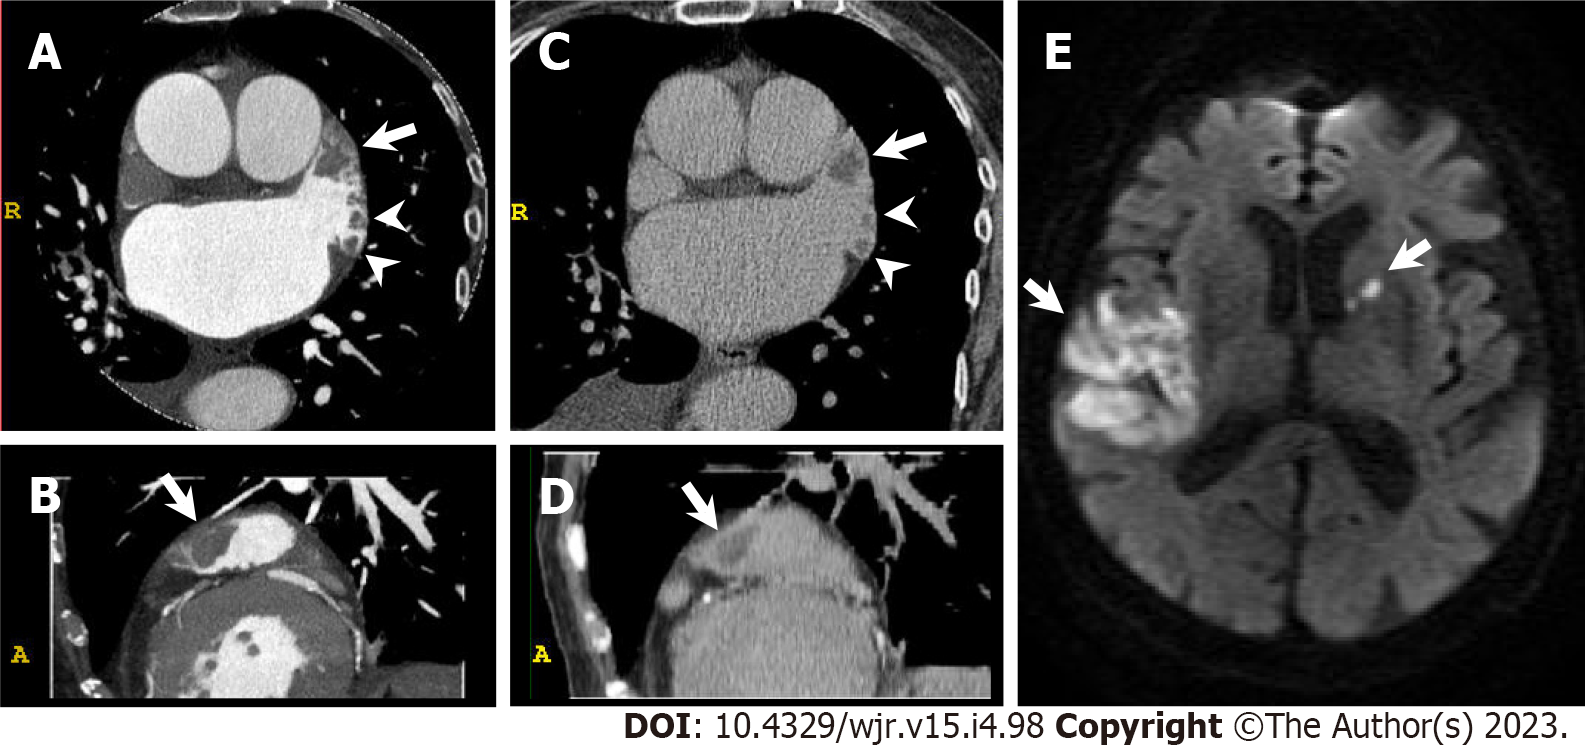
Figure 2 Left atrial appendage thrombus.
An 85-year-old woman with congestive heart failure and atrial fibrillation underwent cardiac computed tomography (CCT) in search of underlying heart disease. She suffered from acute ischemic stroke three months after CCT. A and B: Early phase CCT images (A: Axial; B: Sagittal) show multiple filling defects in left atrial appendage (LAA, arrow and arrowheads); C and D: Delayed phase CCT images (C: Axial; D: Sagittal) also show multiple filling defects in LAA (arrow and arrowheads) confirming multiple LAA thrombus; E: Diffusion-weighted brain magnetic resonance imaging shows hyperintense lesions in right temporoparietal lobe and left anterior limb of internal capsule (arrows).
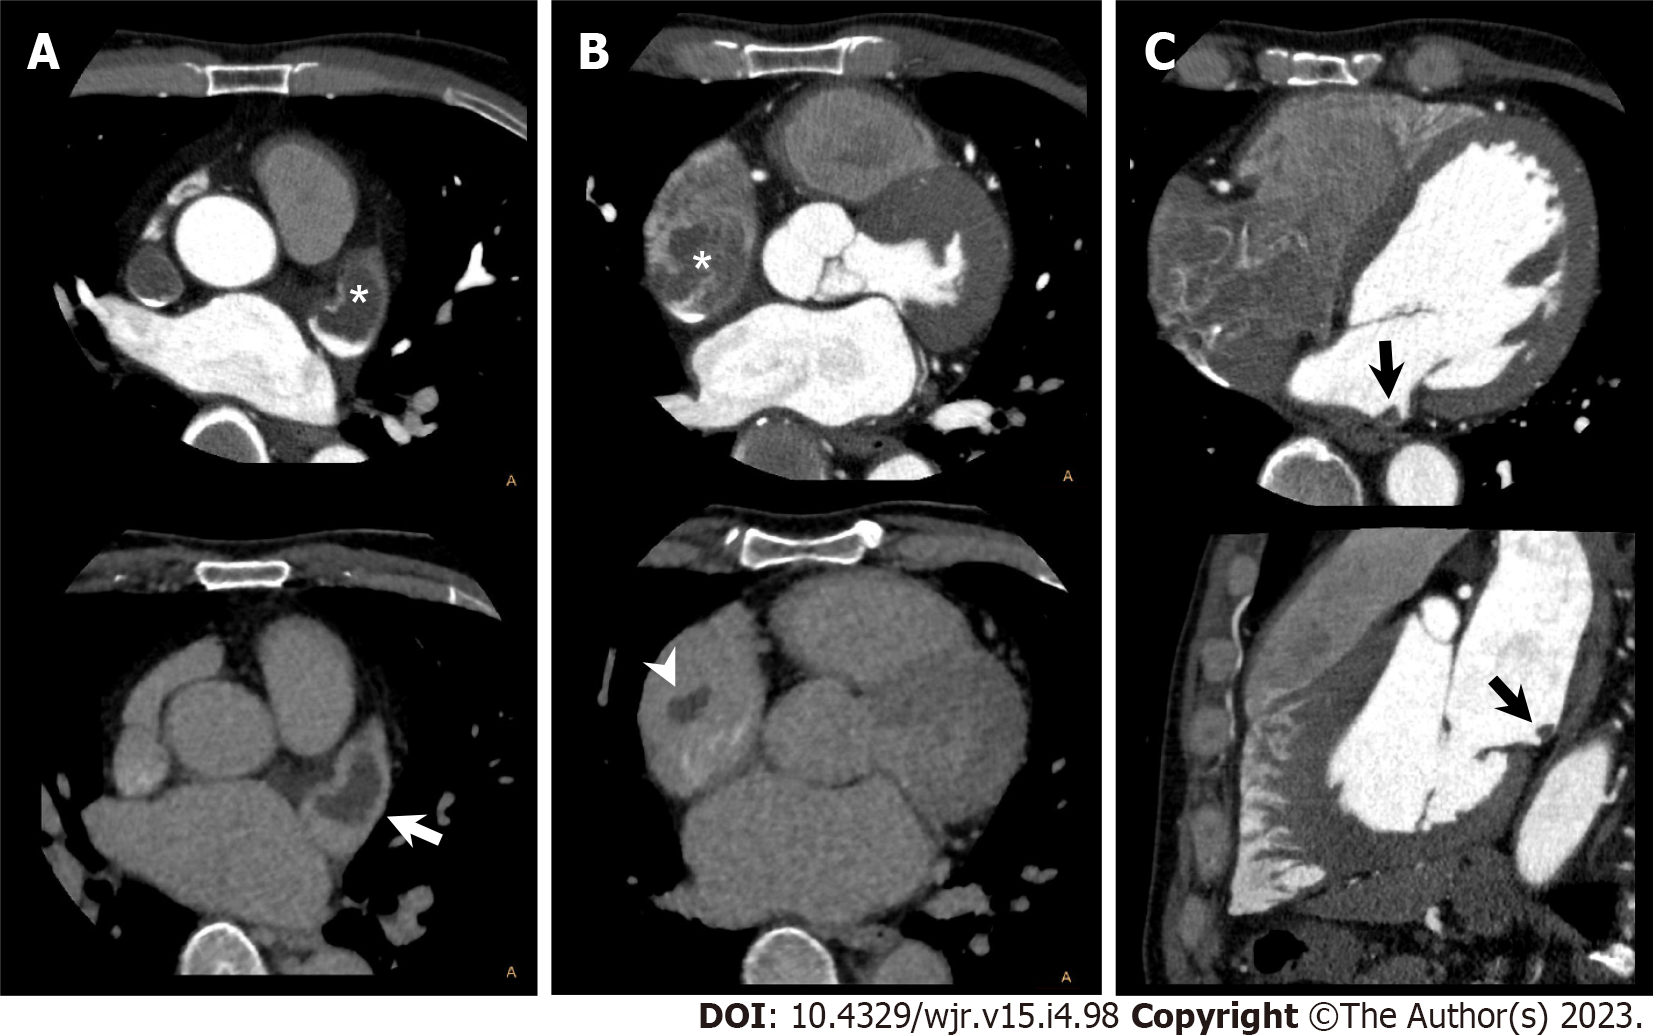
Figure 3 Bilateral atrial thrombus.
A 53-year-old man with atrial fibrillation and right renal infarction underwent cardiac computed tomography (CCT) in search of causal heart pathology of cardioembolism. A: Axial early phase CCT image shows filling defect in left atrial appendage (LAA, upper, asterisk). Axial delayed phase CCT image also shows filling defect in LAA confirming LAA thrombus (lower, arrow); B: Axial early phase CCT image shows filling defect in right atrial appendage (RAA, upper, asterisk). Axial delayed phase CCT image also shows filling defect in RAA confirming RAA thrombus (lower, arrowhead); C: Early phase CCT images (upper: Axial; lower: Sagittal) show filling defect in LA posterior wall, which suggests LA thrombus (black arrow).
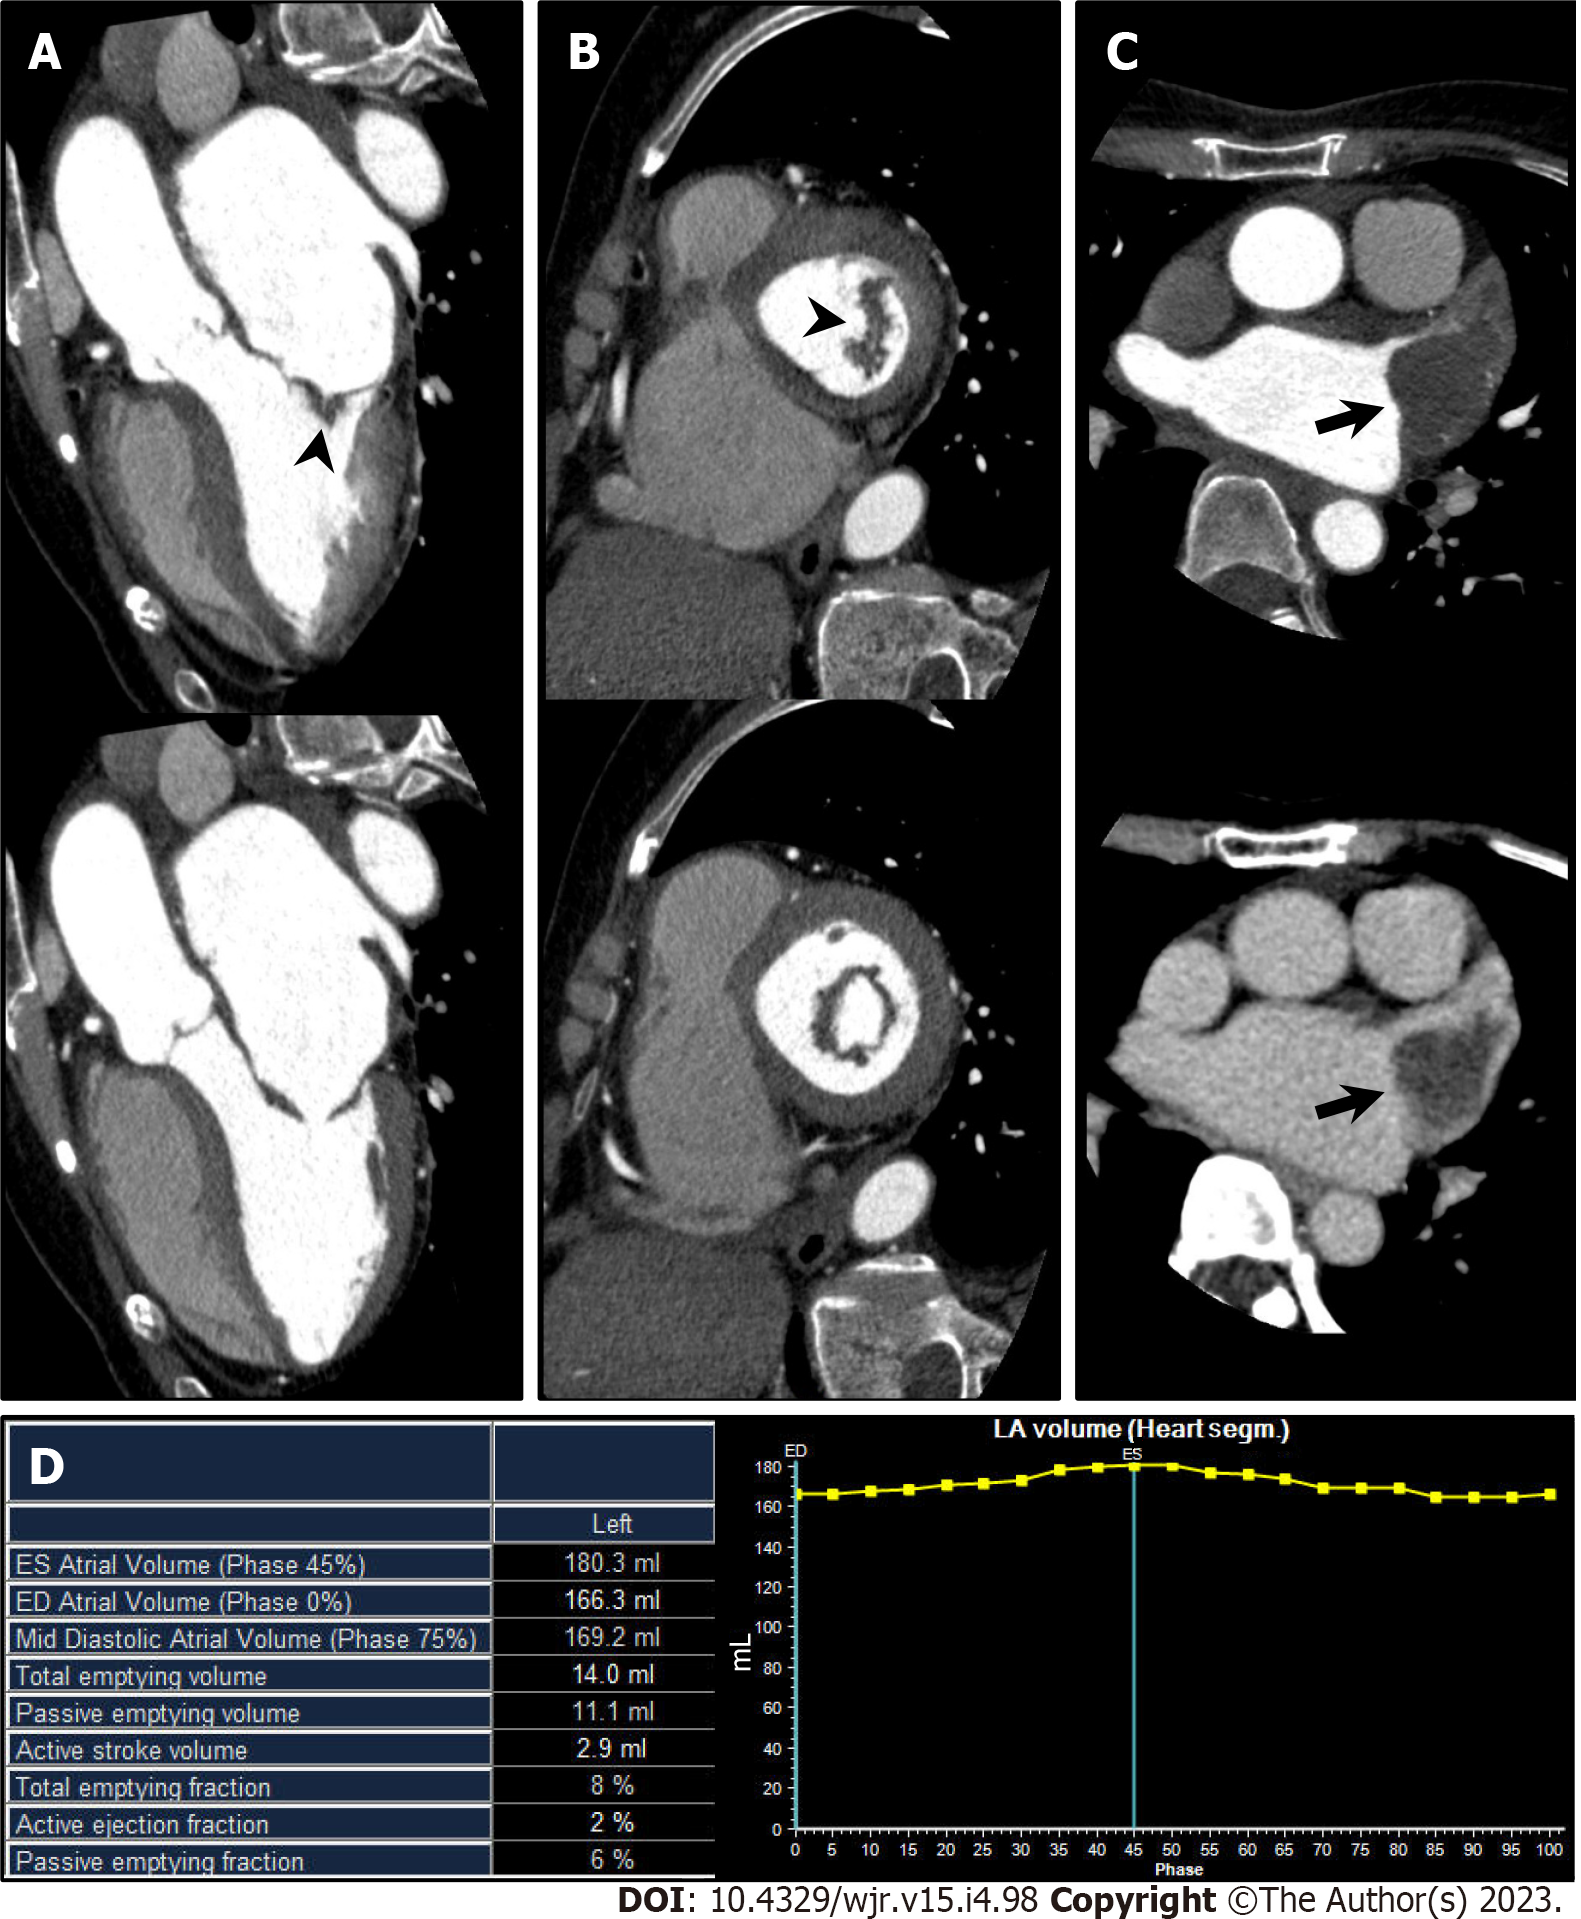
Figure 4 Mitral stenosis.
A 70-year-old man with mitral stenosis and atrial fibrillation underwent cardiac computed tomography (CCT) to rule out obstructive coronary artery disease. A and B: Left ventricular outflow tract long axis (A) and short axis (B) reformatted CCT images (upper: Mid systole at 20% of the R-R interval; lower: Mid diastole at 80% of the R-R interval) show thickened anterior and posterior mitral valve leaflets (arrowhead) and restricted mitral valve opening, representing mitral stenosis. Associated severe enlargement of left atrium is also found; C: Axial early phase CCT image shows triangular filling defect in left atrial appendage (LAA, upper, arrow). Axial delayed phase CCT image also shows filling defect in LAA confirming LAA thrombus (lower, arrow); D: Atrial functional analysis shows severely impaired LA function. LA end-systolic volume, end-diastolic volume, and ejection fraction were 180.3 mL, 166.3 mL, and 8%, respectively.
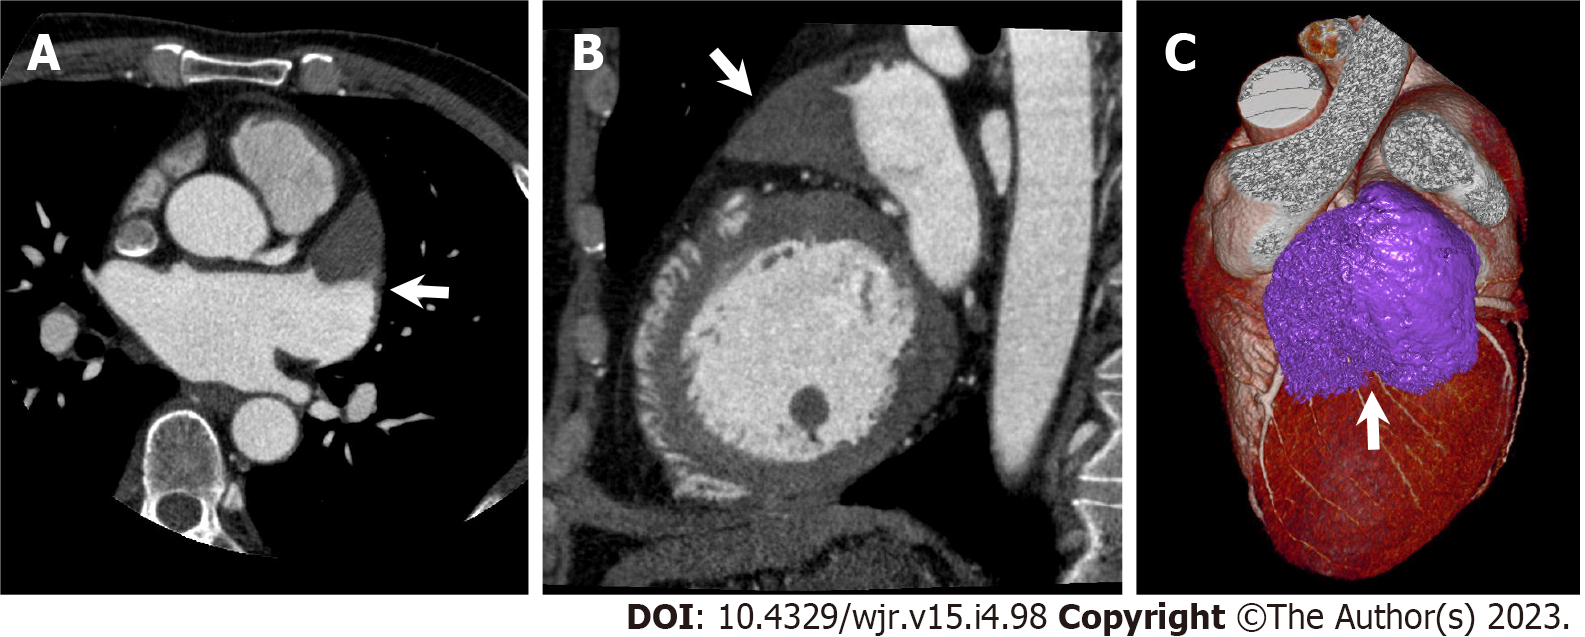
Figure 5 Left atrial appendage aneurysm.
A 56-year-old man with atrial fibrillation (Af) underwent cardiac computed tomography (CCT) to rule out obstructive coronary artery disease before catheter ablation for Af. A and B: Axial (A) and sagittal (B) reformatted CCT images show enlarged left atrial appendage (LAA, arrow) with triangular filling defect inside. LAA orifice diameter, body width, and length were 3.4 cm, 5.2 cm, and 6.8 cm, respectively; C: Three-dimensional volume-rendered image of CCT shows LAA aneurysm. CCT-derived maximum LAA volume was 56 mL.
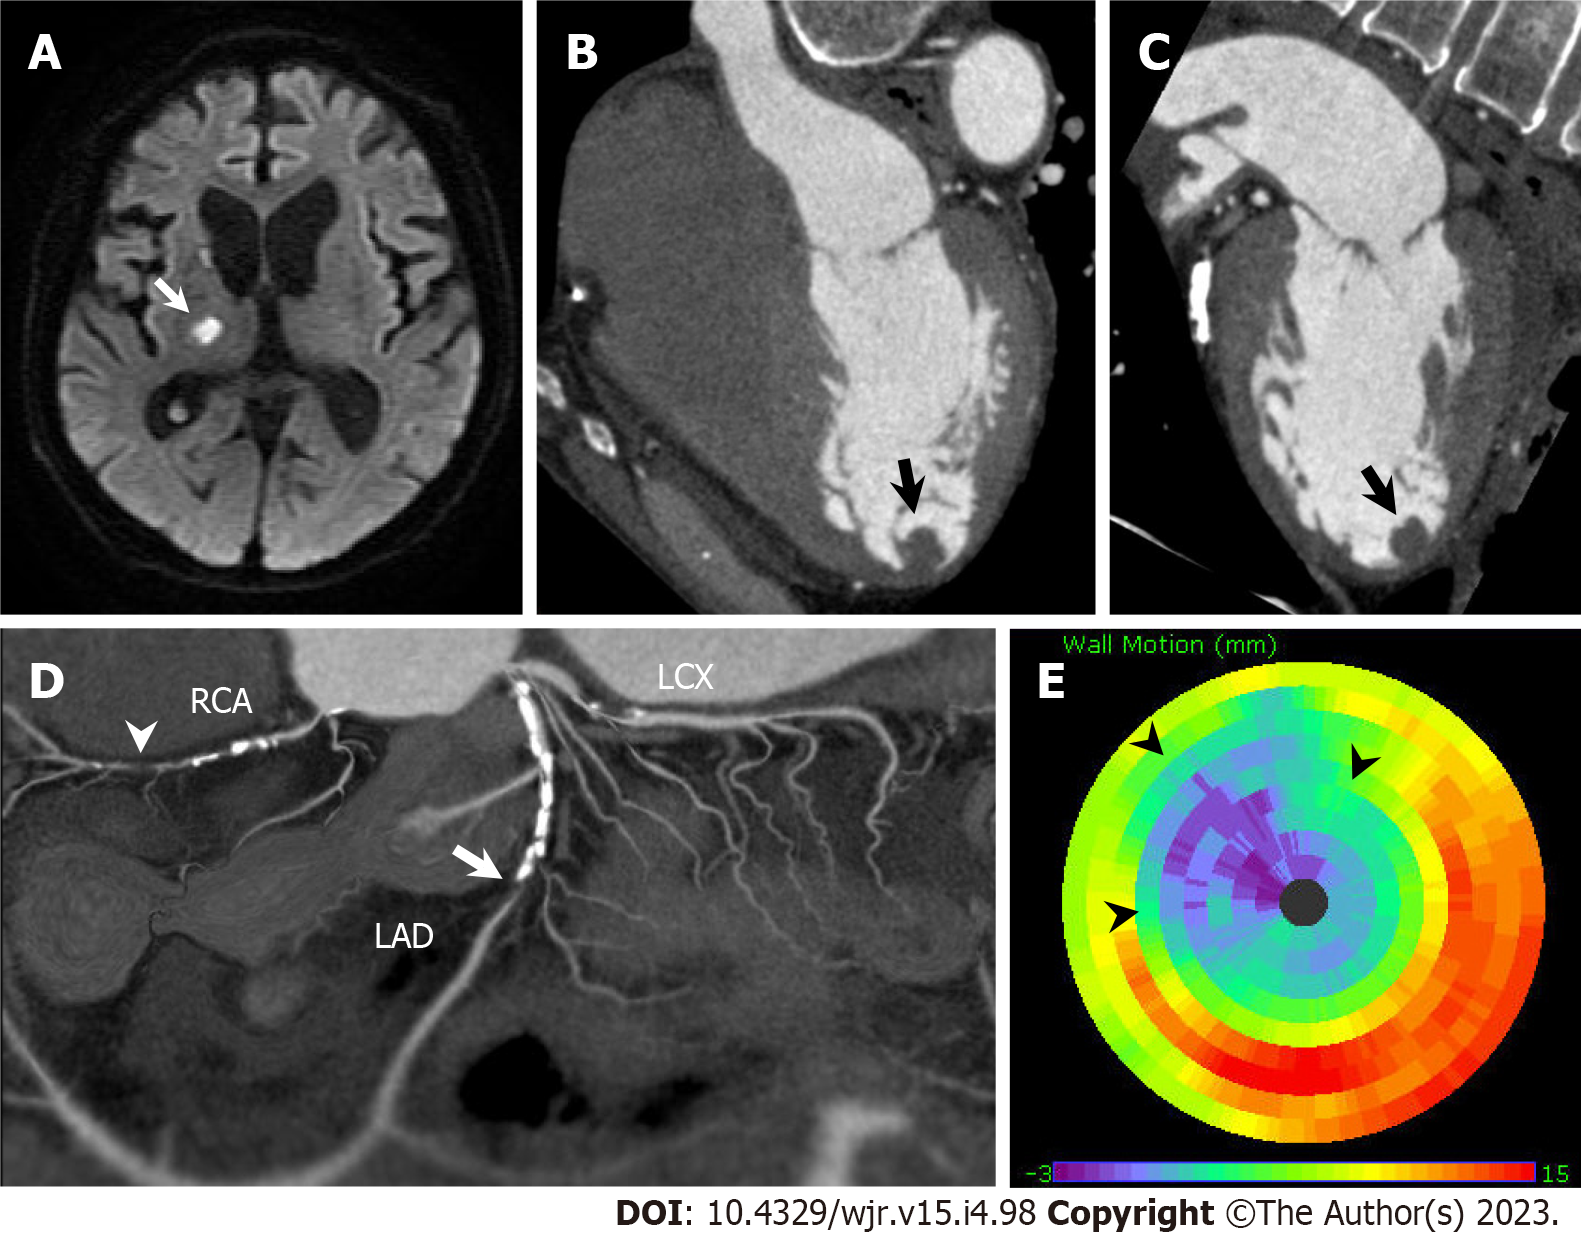
Figure 6 Left ventricular thrombus complicated with anteroseptal myocardial infarction.
An 80-year-old man hospitalized with acute ischemic stroke underwent cardiac computed tomography (CCT) to rule out obstructive coronary artery disease. A: Diffusion-weighted brain magnetic resonance imaging shows hyperintense lesions in right thalamus and right posterior limb of internal capsule (arrow); B and C: Horizontal long axis (B) and vertical long axis (C) reformatted CCT images show round-shaped thrombus in left ventricular apex (arrow); D: Soap-bubble maximum intensity projection reconstruction image of whole coronary artery shows total occlusion of left anterior descending coronary artery (LAD, arrow) and right coronary artery (RCA, arrowhead); E: Polar map of left ventricular wall motion shows severely reduced anterior to anteroseptal wall motion perfused by LAD (arrowheads). LCX: left circumflex coronary artery.
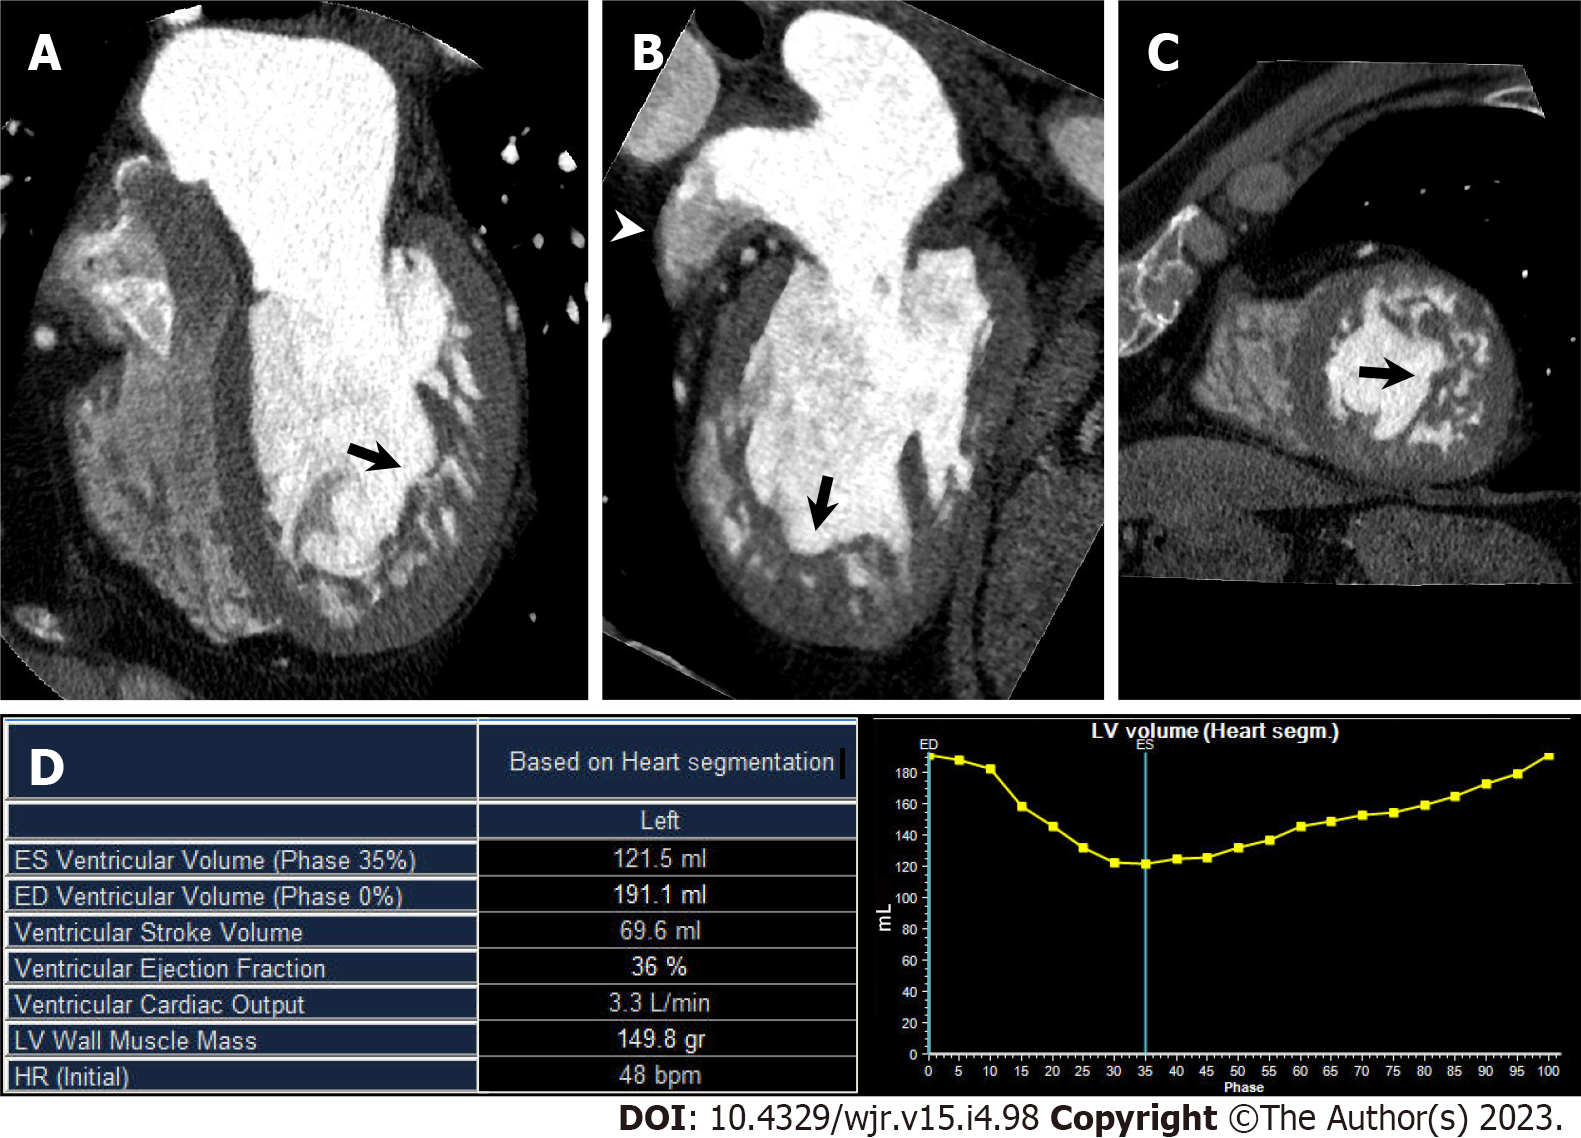
Figure 7 Left ventricular noncompaction.
A 60-year-old man with congestive heart failure underwent cardiac computed tomography (CCT) in search of underlying heart disease. A–C Horizontal long axis (A), vertical long axis (B), and short axis (C) reformatted CCT images show increased trabeculations from mid to apical portion of left ventricle (arrows). Noncompacted-to-compacted layer ratio at end-diastolic was 2.6. Note contrast heterogeneity within left atrial appendage (LAA), which reflects blood stasis in LAA (arrowhead); D: Left ventricular (LV) functional analysis shows impaired LV function. LV end-diastolic volume, end-systolic volume, and ejection fraction were 191.1 mL, 121.5 mL, and 36%, respectively.
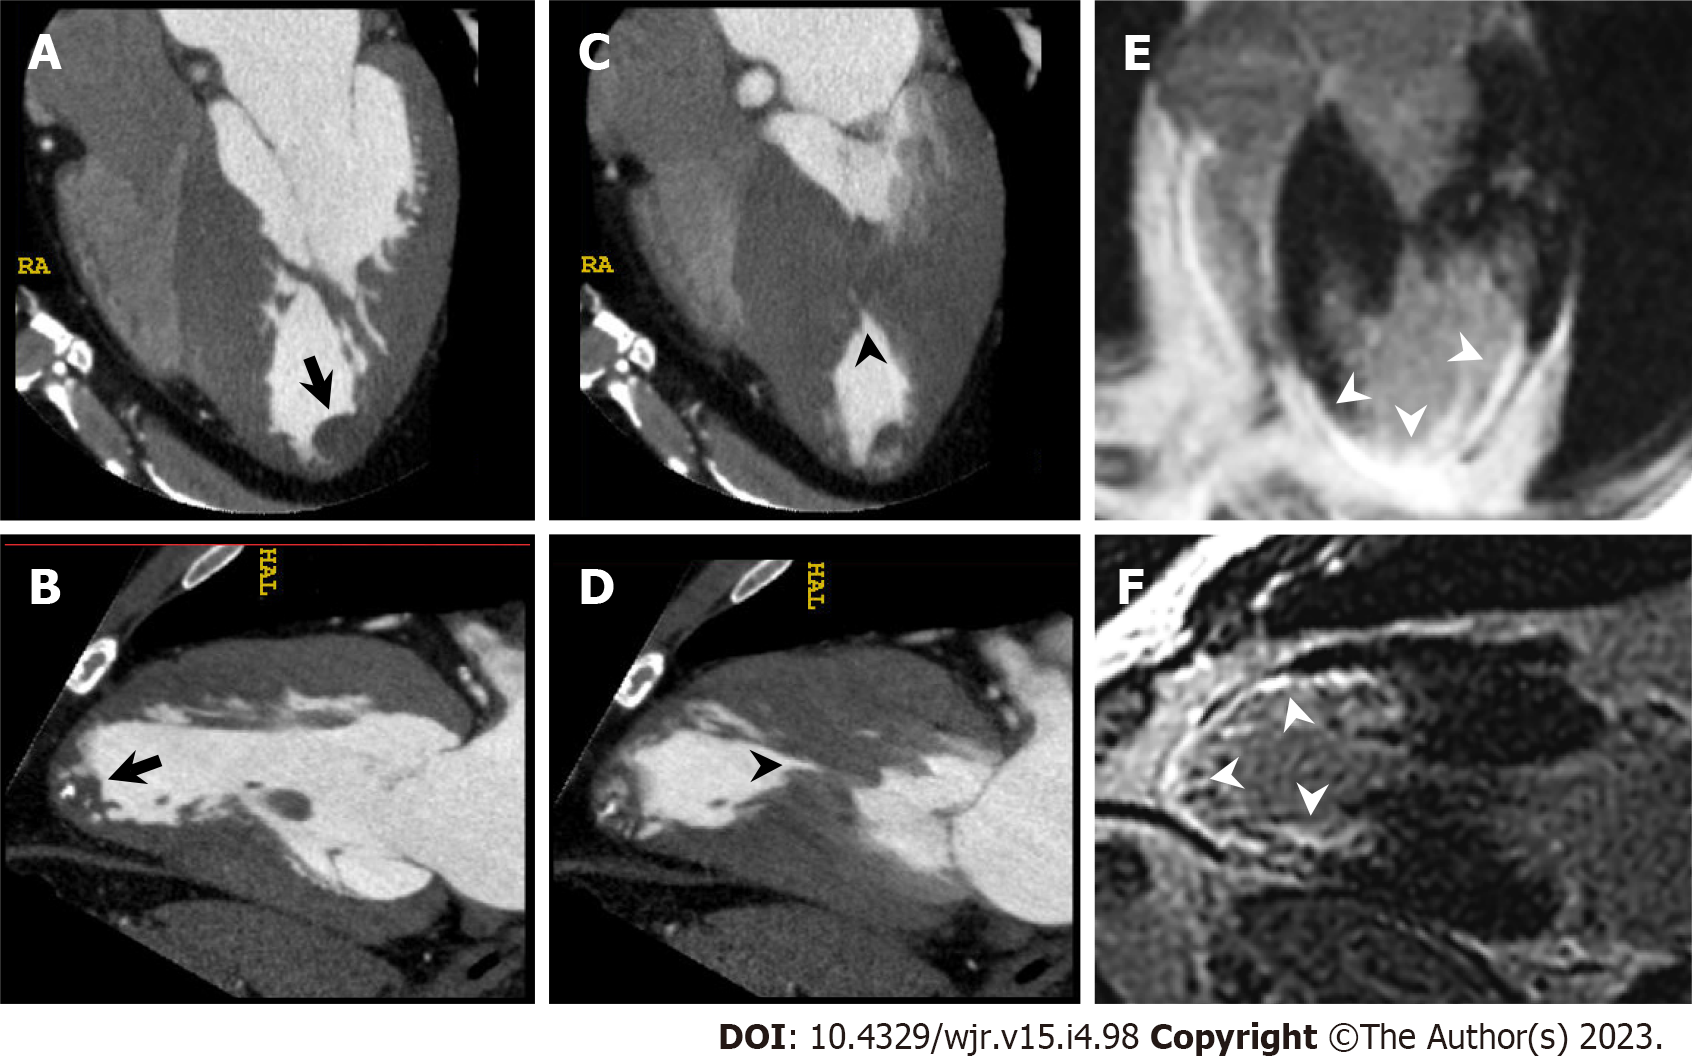
Figure 8 Left ventricular apical thrombus complicated with mid-ventricular obstructive hypertrophic cardiomyopathy.
A 56-year-old man with unsustained ventricular tachycardia underwent cardiac computed tomography (CCT) in search of underlying heart disease. A and B: Horizontal long axis (A) and vertical long axis (B) reformatted CCT images at end diastole show partially calcified round-shaped thrombus in left ventricular apex (arrow). C and D: Horizontal long axis (C) and vertical long axis (D) reformatted CCT images at end systole show mid-ventricular hypertrophy and mid-cavitary obliteration of left ventricle (arrowhead) with thin-walled left ventricular apical aneurysm; E and F: Horizontal long axis (E) and vertical long axis (F) reformatted images of delayed enhanced cardiac magnetic resonance imaging show transmural late gadolinium enhancement in mid to apical portion of left ventricle (arrowheads).
Figure 9 Interventricular membranous septal aneurysm.
A 78-year-old man underwent cardiac computed tomography (CCT) to further evaluate pathologic outpouching from the left ventricular outflow tract (LVOT) observed on transthoracic echocardiography. A–C: Axial (A), horizontal long axis (B), and sagittal (C) reformatted CCT images show multi-lobular outpouching projecting into right ventricle from LVOT (arrows) consistent with interventricular membranous septal aneurysm (IVMSA), with no evidence of a shunt. Note contrast heterogeneity within IVMSA, which reflects blood stasis in IVMSA.
Figure 10 Atrial myxoma.
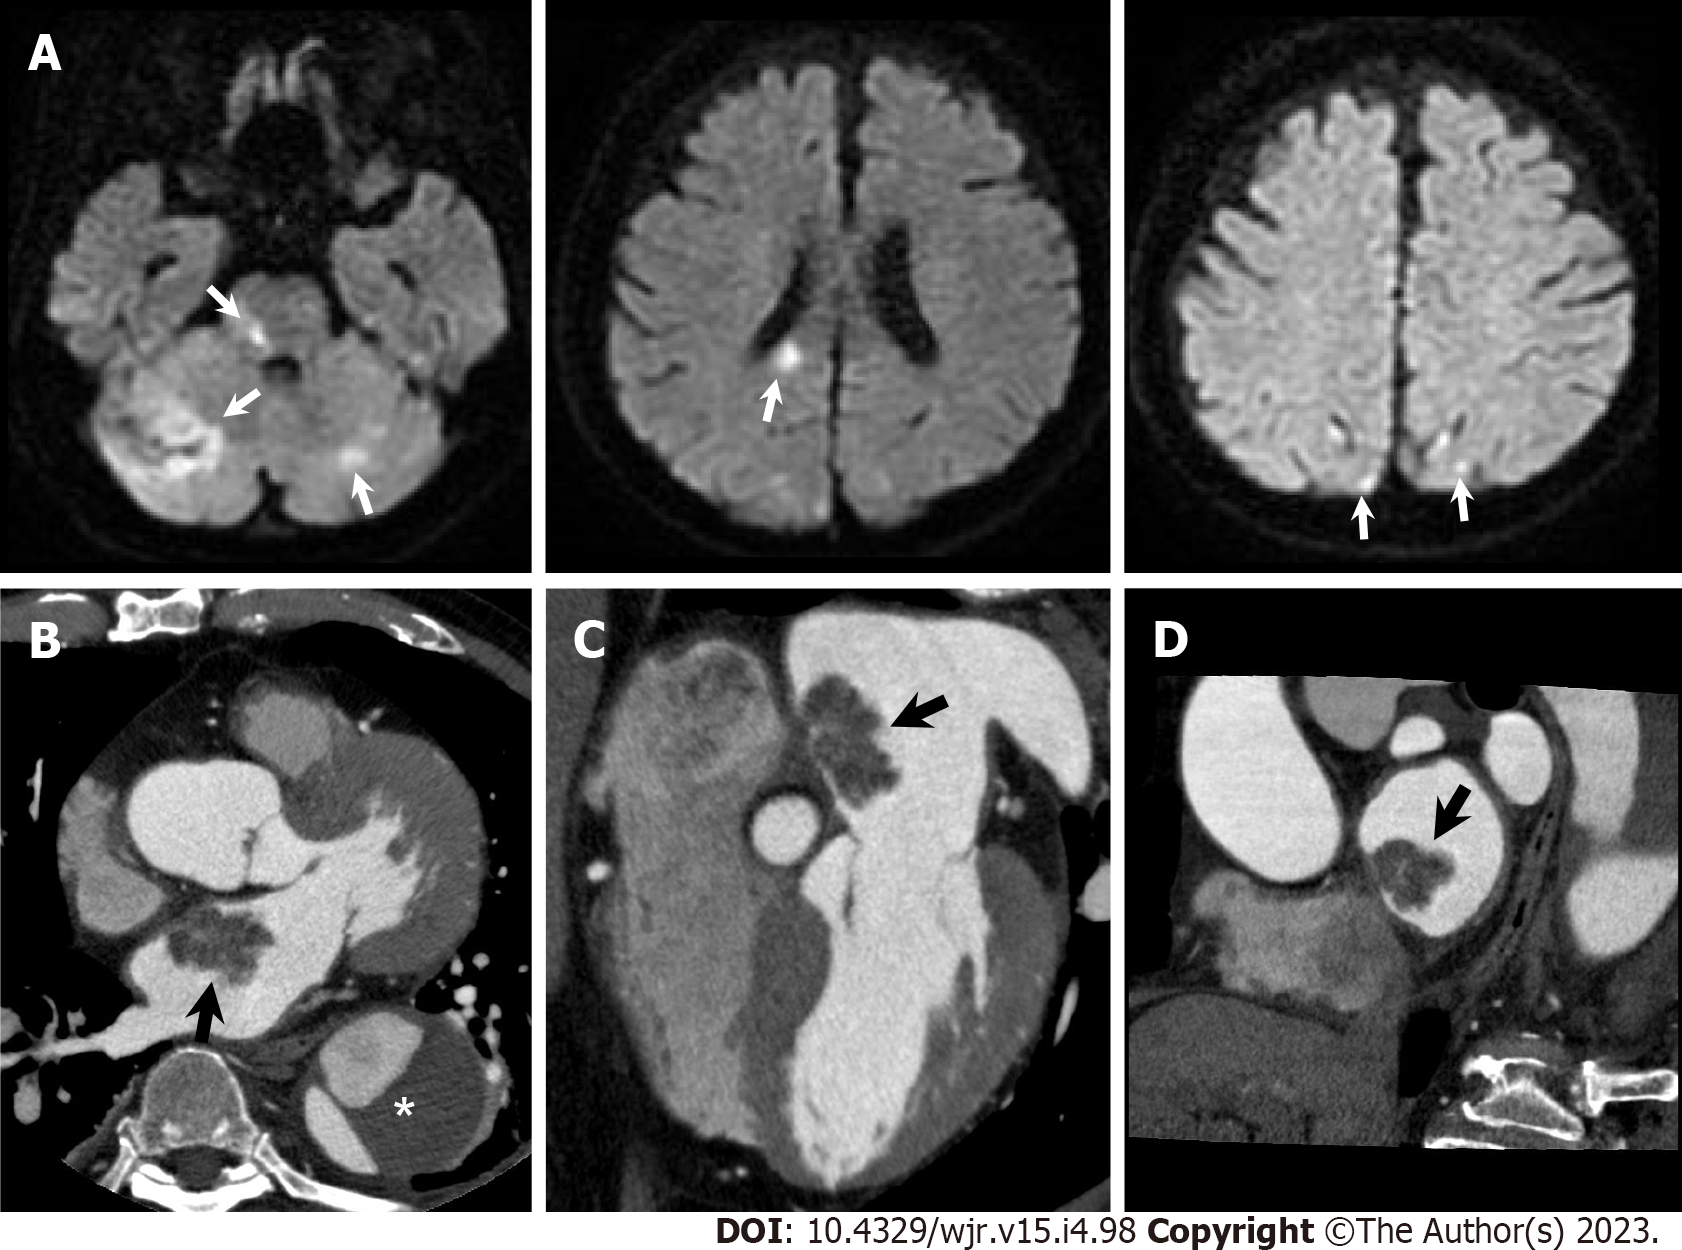
A 76-year-old man hospitalized with acute ischemic stroke underwent cardiac computed tomography (CCT) to further evaluate a left atrial mass observed on transthoracic echocardiography. A: Diffusion-weighted brain magnetic resonance imaging shows hyperintense lesions in bilateral cerebellar hemisphere, pons, splenium of corpus callosum, and bilateral occipital lobe (arrows); B–D: Axial (B), horizontal long axis (C), and short axis (D) reformatted CCT images show a 31-mm-sized lobulated left atrial mass attached to the interatrial septum (arrows). He had a previous history of chronic aortic dissection (asterisk). Urgent surgical mass resection was performed. Histological examination confirmed cardiac myxoma.
Figure 11 Gradually increased atrial myxoma.
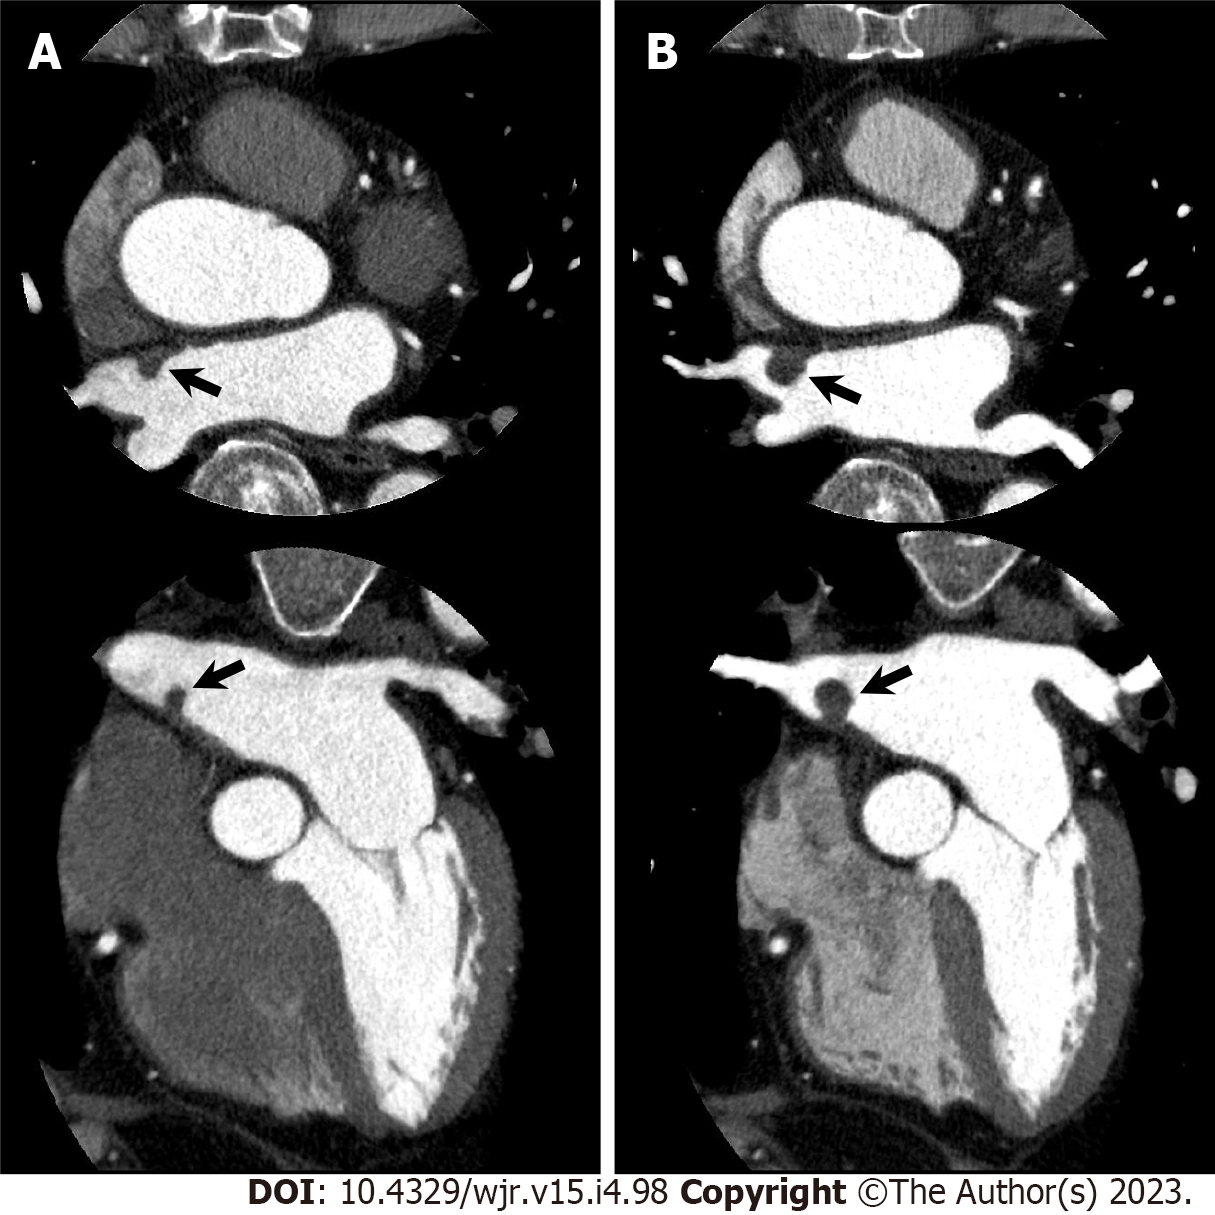
An 80-year-old man with chest pain underwent cardiac computed tomography (CCT) to evaluate obstructive coronary artery disease. CCT showed severe stenosis in the left anterior descending coronary artery, and percutaneous coronary intervention was performed. Simultaneously, CCT incidentally demonstrated a left atrial mass that could not be visualized on transthoracic echocardiography. A: Axial (upper) and horizontal long axis (lower) reformatted CCT images show left atrial mass of 7 mm by 5 mm in diameter attached to interatrial septum (arrows); B: Axial (upper) and horizontal long axis (lower) reformatted CCT images performed one year later show increased mass size of 11 mm by 11 mm in diameter. Subsequently, elective surgical mass resection was performed. Histological examination confirmed cardiac myxoma.
Figure 12 Infective endocarditis.
A 73-year-old man hospitalized with infective endocarditis and acute ischemic stroke underwent cardiac computed tomography (CCT) to rule out obstructive coronary artery disease before urgent surgical aortic valve replacement. A: Diffusion-weighted brain magnetic resonance imaging shows hyperintense lesions in bilateral cerebral hemisphere (arrows). B: Left ventricular outflow tract long axis reformatted CCT image shows irregularly shaped aortic valve vegetations adherent to left coronary cusp (LCC); C: Surgically resected LCC of aortic valve with fragile vegetations. NCC: Noncoronary cusp.
Figure 13 Mechanical mitral valve dysfunction.
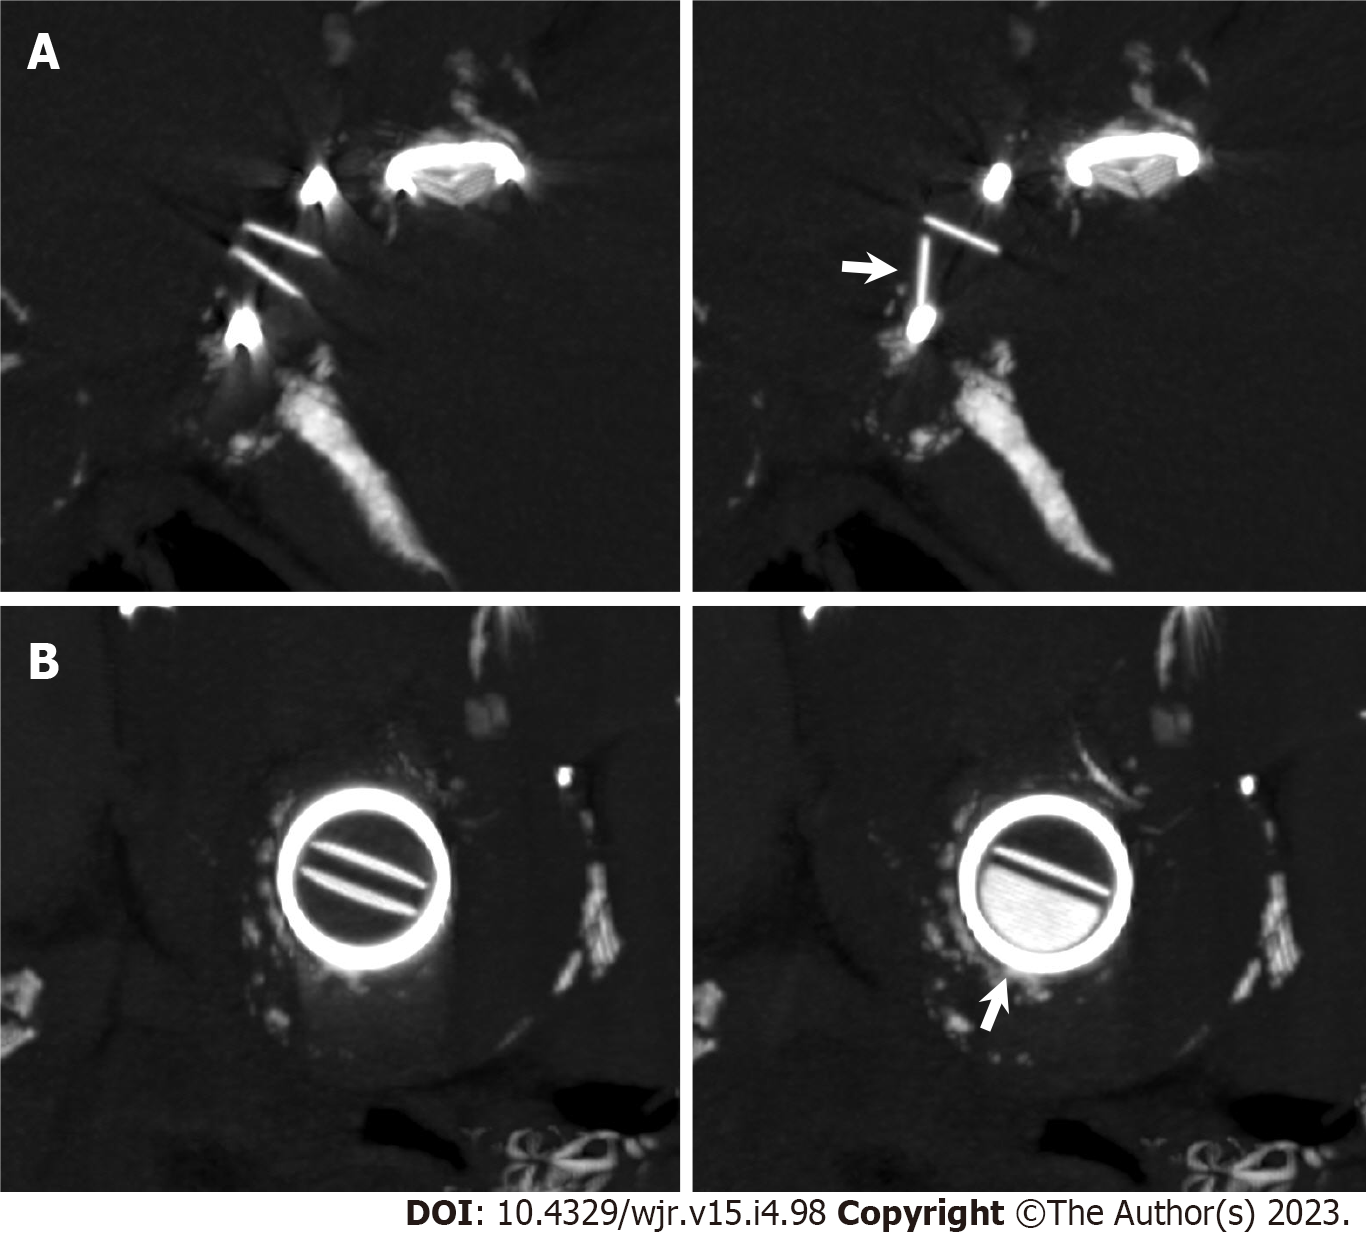
An 86-year-old woman who had undergone St. Jude Medical 29 mm-sized mitral valve replacement 17 years earlier and now presented with congestive heart failure underwent non-contrast cardiac computed tomography (CCT) to evaluate the etiology of mitral regurgitation observed on transthoracic echocardiography. A and B: Multiplanar reformatted images perpendicular to valve leaflet (A) and short axis images (B) of non-contrast CCT show incomplete opening of bileaflet mechanical mitral valve (arrows).
Figure 14 Aortic stenosis.
A man in his seventies with chronic renal failure requiring hemodialysis and aortic stenosis underwent cardiac computed tomography (CCT) on two occasions to evaluate obstructive coronary artery disease. A: 19 years after initiation of hemodialysis. Left: Short axis reformatted CCT image in diastole shows tricuspid aortic valve with calcification. Middle: Aortic valve calcium score (AVCS) by Agatston method and aortic valve calcium volume were 2534 and 1988 mm3, respectively. Right: Quantification of aortic valve area (AVA) by planimetry is 1.14 cm2; B: 24 years after initiation of hemodialysis. Left: Extent of aortic valve calcification has increased. Middle: AVCS by Agatston method and aortic valve calcium volume were 5888 and 4447 mm3, respectively. Right: Quantification of AVA by planimetry is 0.65 cm2; C: Surgical aortic valve replacement was performed after second CCT examination. Gross specimen of surgically resected aortic valve is shown.
Figure 15 Caseous mitral annular calcification.
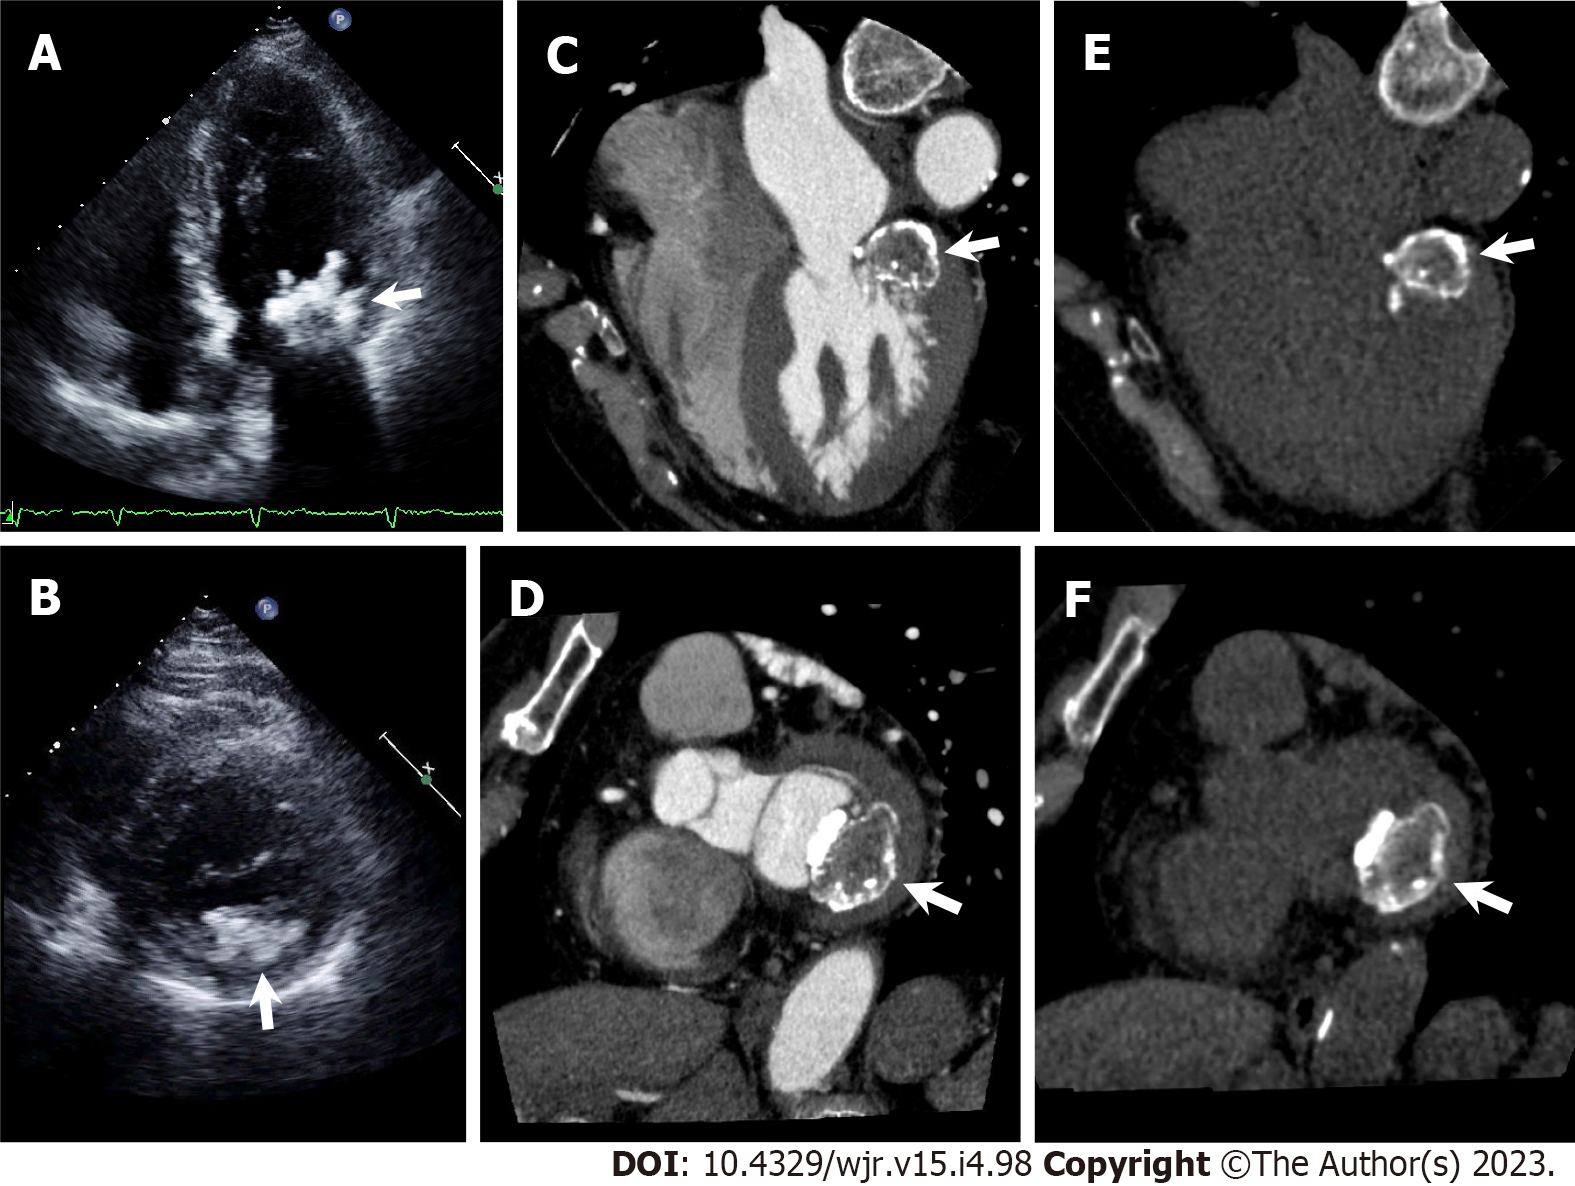
A and B: Apical four chamber view (A) and parasternal short axis view (B) of transthoracic echocardiography show irregularly shaped calcific mass attached to mitral annulus adjacent to posterior mitral valve leaflet (arrows); C–F: Cardiac computed tomography (CCT) images with (C, D) and without (E, F) contrast medium. Horizontal long axis (C, E) and short axis (D, F) reformatted CCT images show a centrally hypodense mass with irregular calcified borders attached to mitral annulus adjacent to posterior mitral valve leaflet (arrows).
Figure 16 Patent foramen ovale.
A: Horizontal long axis (left) and short axis oblique (right) reformatted cardiac computed tomography (CCT) images show passage of higher-contrast jet (arrow) from left atrium (LA) via patent foramen ovale (PFO) with channel-like appearance (arrowhead) into adjacent right atrium (RA). B: Horizontal long axis (left) and short axis oblique (right) reformatted CCT images show passage of lower-contrast jet (arrow) from RA via PFO with channel-like appearance (arrowhead) into adjacent LA.
Figure 17 Classification of atrial septal aneurysm.
A: Cardiac computed tomography (CCT) image of right bulging atrial septal aneurysm [Atrial septal aneurysm (ASA), arrow] in which bulging during cardiac cycle is right atrium (RA) only; B: CCT image of left bulging ASA (arrow) in which bulging during cardiac cycle is left atrium (LA) only; C: CCT image of bidirectional ASA (arrowheads) in which ASA movement during cardiac cycle is bidirectional.
Figure 18 Atrial septal aneurysm with patent foramen ovale.
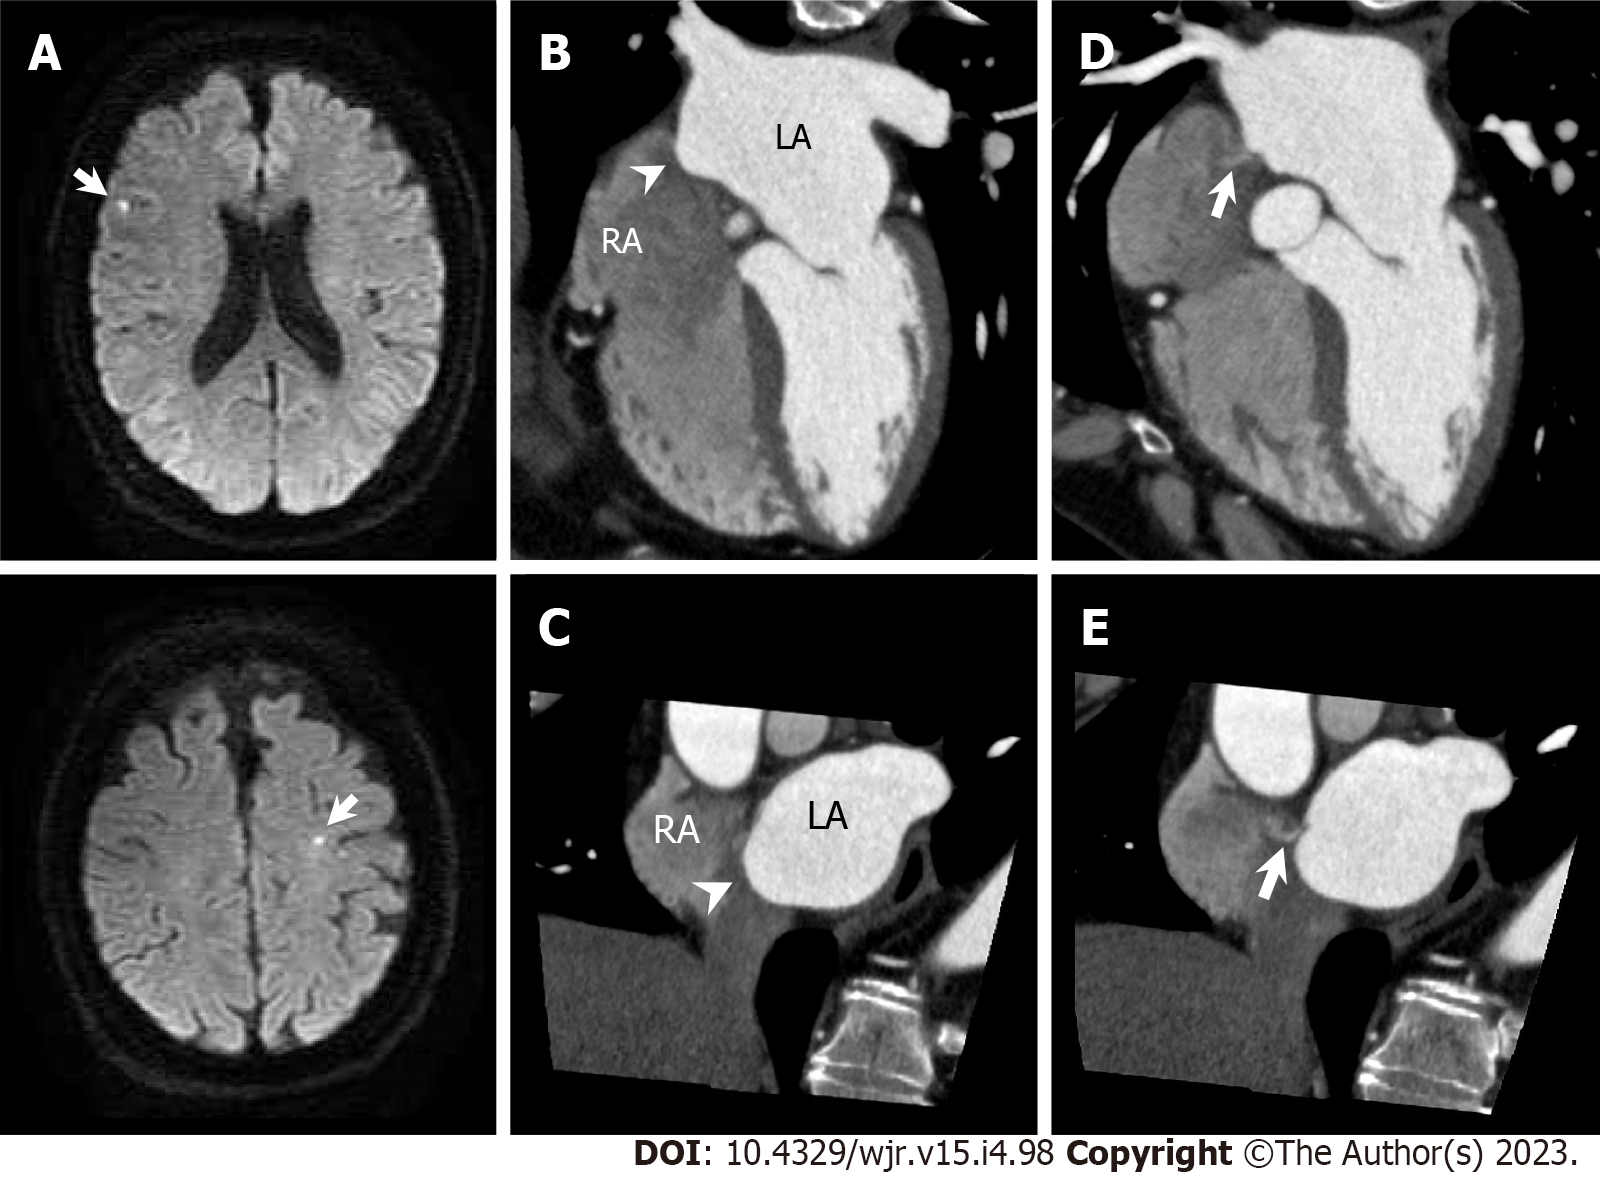
A 53-year-old man with acute ischemic stroke underwent cardiac computed tomography (CCT) to rule out obstructive coronary artery disease. A: Diffusion-weighted brain magnetic resonance imaging shows hyperintense lesions in right frontal lobe and left precentral gyrus (arrows); B and C: Horizontal long axis (B) and short axis oblique (C) reformatted cardiac computed tomography (CCT) images show right bulging atrial septal aneurysm (arrowheads); D and E: Horizontal long axis (D) and short axis oblique (E) reformatted CCT images show small pinhole-like jet from LA via patent foramen ovale into RA (arrows). LA: Left atrium; RA: Right atrium.
Figure 19 Atrial septal aneurysm with atrial septal defect.
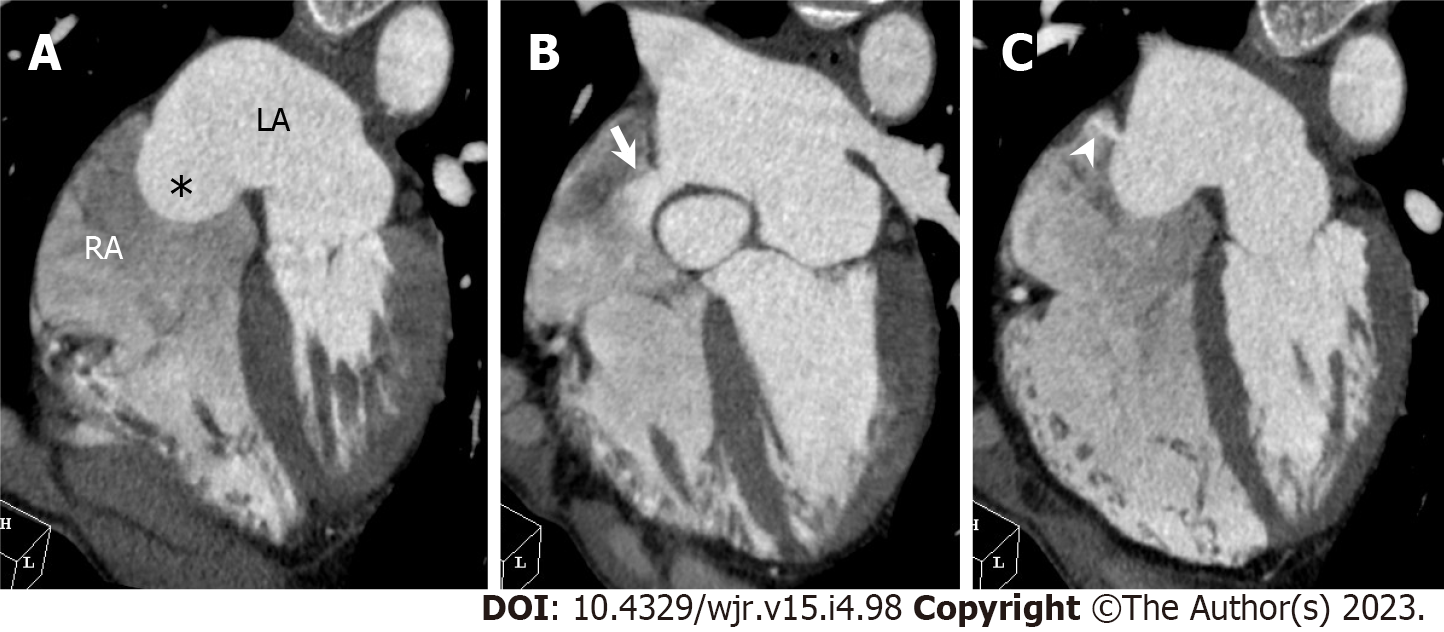
A 66-year-old man underwent cardiac computed tomography (CCT) to further evaluate outpouching of the interatrial septum observed on transthoracic echocardiography. Transthoracic echocardiography did not detect interatrial shunt flow. A: Horizontal long axis reformatted CCT image shows right bulging atrial septal aneurysm [Atrial septal aneurysm (ASA), asterisk]. B: Above ASA, in upper portion of interatrial septum just below aortic valve, atrial septal defect (ASD) with contrast shunt from LA into RA is found (arrow). Measured size of ASD is 14 mm by 10 mm; C: Below ASA, in lower portion of interatrial septum, another 5 mm-sized ASD with left to right shunt is found (arrowhead). LA: Left atrium; RA: Right atrium.
Figure 20 Superior sinus venosus atrial septal defect.
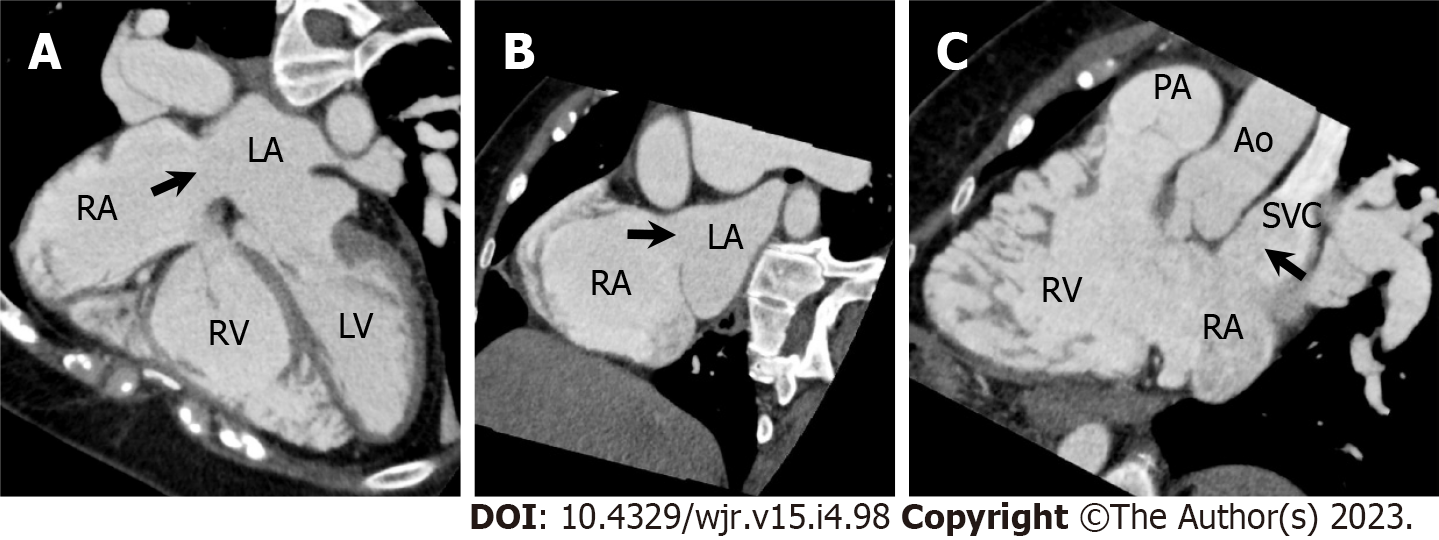
A 57-year-old woman underwent cardiac computed tomography (CCT) to evaluate right ventricular (RV) morphology and function because transthoracic echocardiography revealed gradual RV dilatation over time. She had a previous history of cryptogenic ischemic stroke when she was 3 years old. A–C: Horizontal long axis (A), short axis oblique (B), and RV long axis reformatted CCT images show atrial septal defect (ASD) in superior aspect of interatrial septum at level of entry of superior vena cava (SVC, arrows). Measured size of ASD is 26 mm by 25 mm. Partial anomalous pulmonary venous return is not complicated. Subsequently, she underwent right and left heart catheterization. The Qp/Qs ratio and mean pulmonary artery pressure measured using right heart catheterization were 4.8 and 23 mmHg, respectively. Surgical ASD closure was performed. LA: Left atrium; LV: Left ventricle; RA: Right atrium; PA: Pulmonary artery; Ao: Aorta.
Figure 21 Pulmonary arteriovenous malformation.
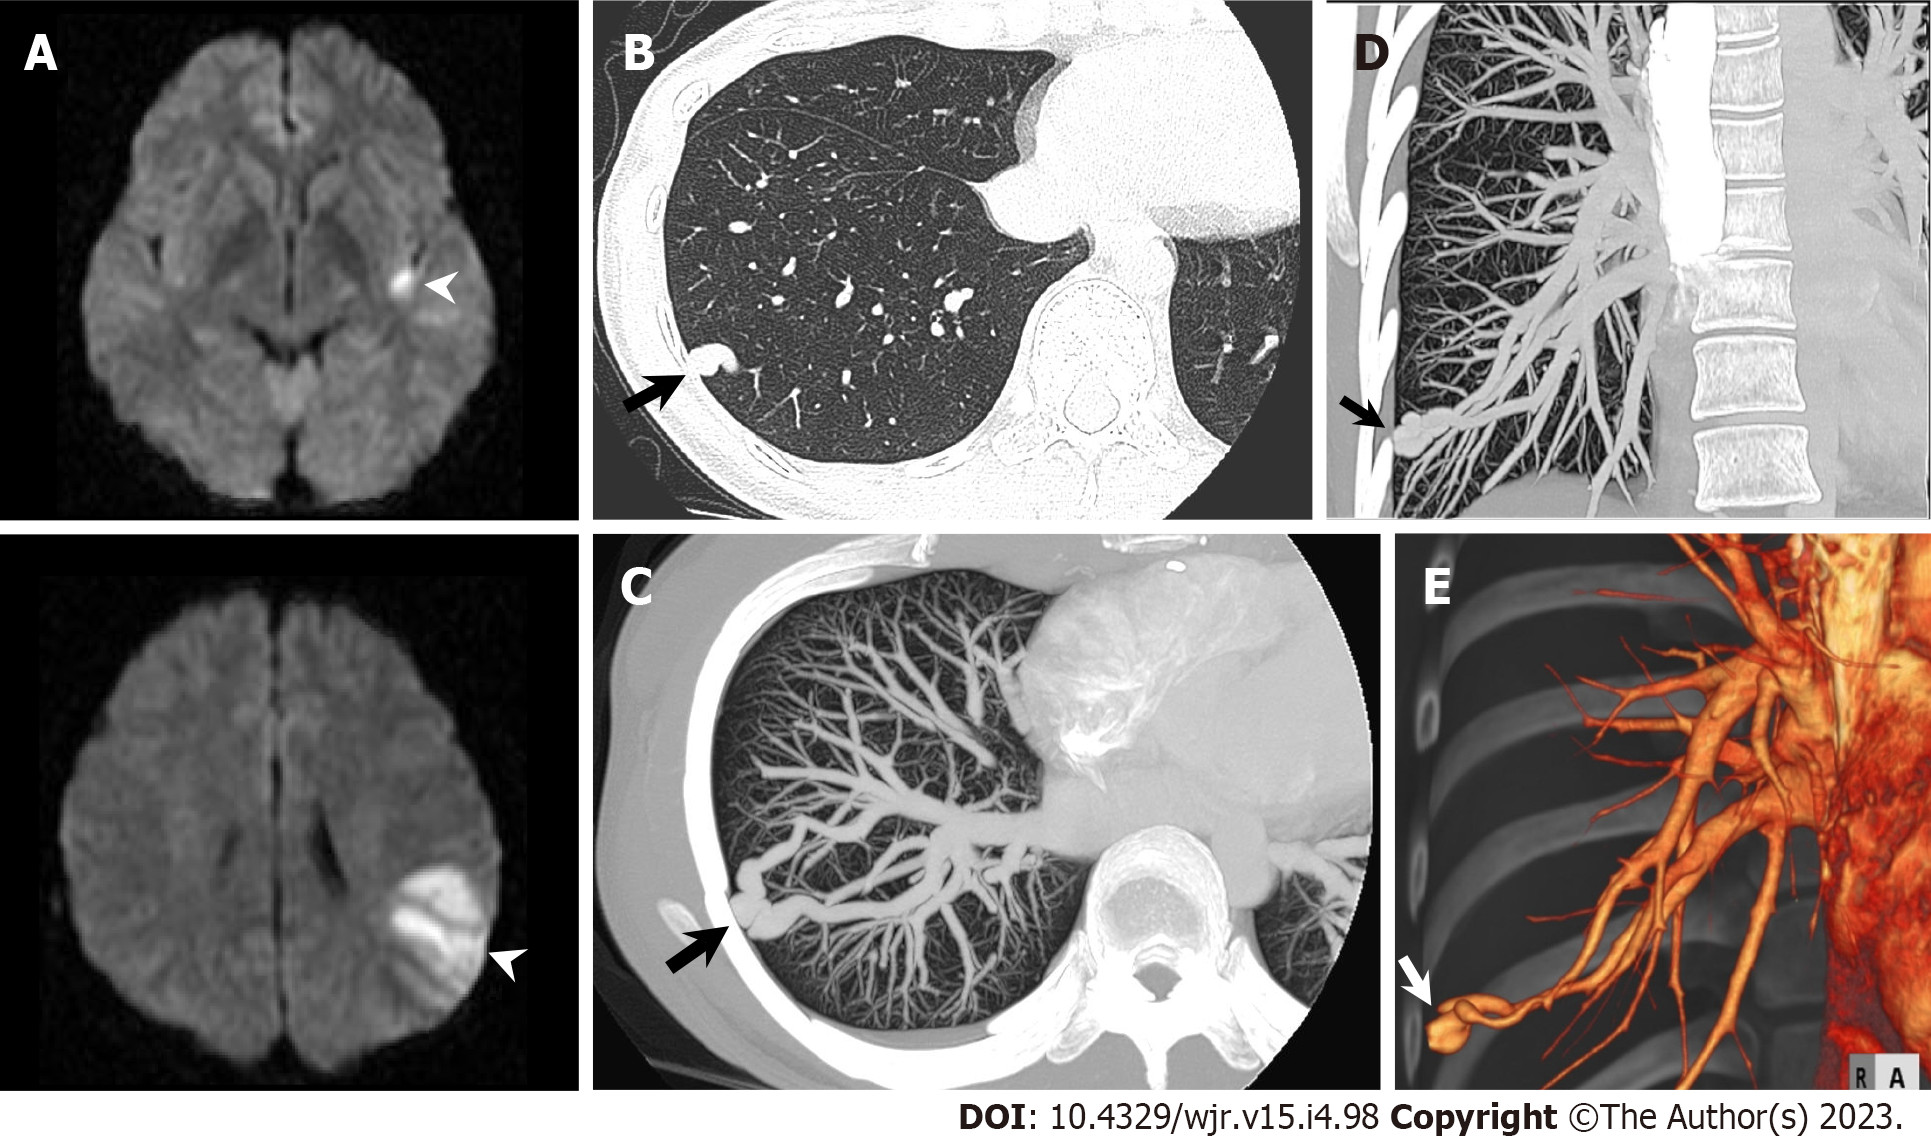
A 31-year-old woman hospitalized with acute ischemic stroke underwent chest computed tomography (CT) to further evaluate a nodular shadow in right lower lung field on chest radiography. A: Diffusion-weighted brain magnetic resonance imaging shows hyperintense lesions in left insula and left parietal lobe (arrowheads); B: Non-contrast chest CT shows nodular shadow in lateral basal segment of right inferior lobe (arrow); C–E: Maximum intensity projection reconstruction images (C: Axial; D: Coronal) and three-dimensional volume-rendered image (E) of contrast-enhanced CT show pulmonary arteriovenous malformation in lateral basal segment of right inferior lobe (arrow).
- Citation: Yoshihara S. Evaluation of causal heart diseases in cardioembolic stroke by cardiac computed tomography. World J Radiol 2023; 15(4): 98-117
- URL: https://www.wjgnet.com/1949-8470/full/v15/i4/98.htm
- DOI: https://dx.doi.org/10.4329/wjr.v15.i4.98


