Copyright
©The Author(s) 2023.
World J Radiol. Oct 28, 2023; 15(10): 293-303
Published online Oct 28, 2023. doi: 10.4329/wjr.v15.i10.293
Published online Oct 28, 2023. doi: 10.4329/wjr.v15.i10.293
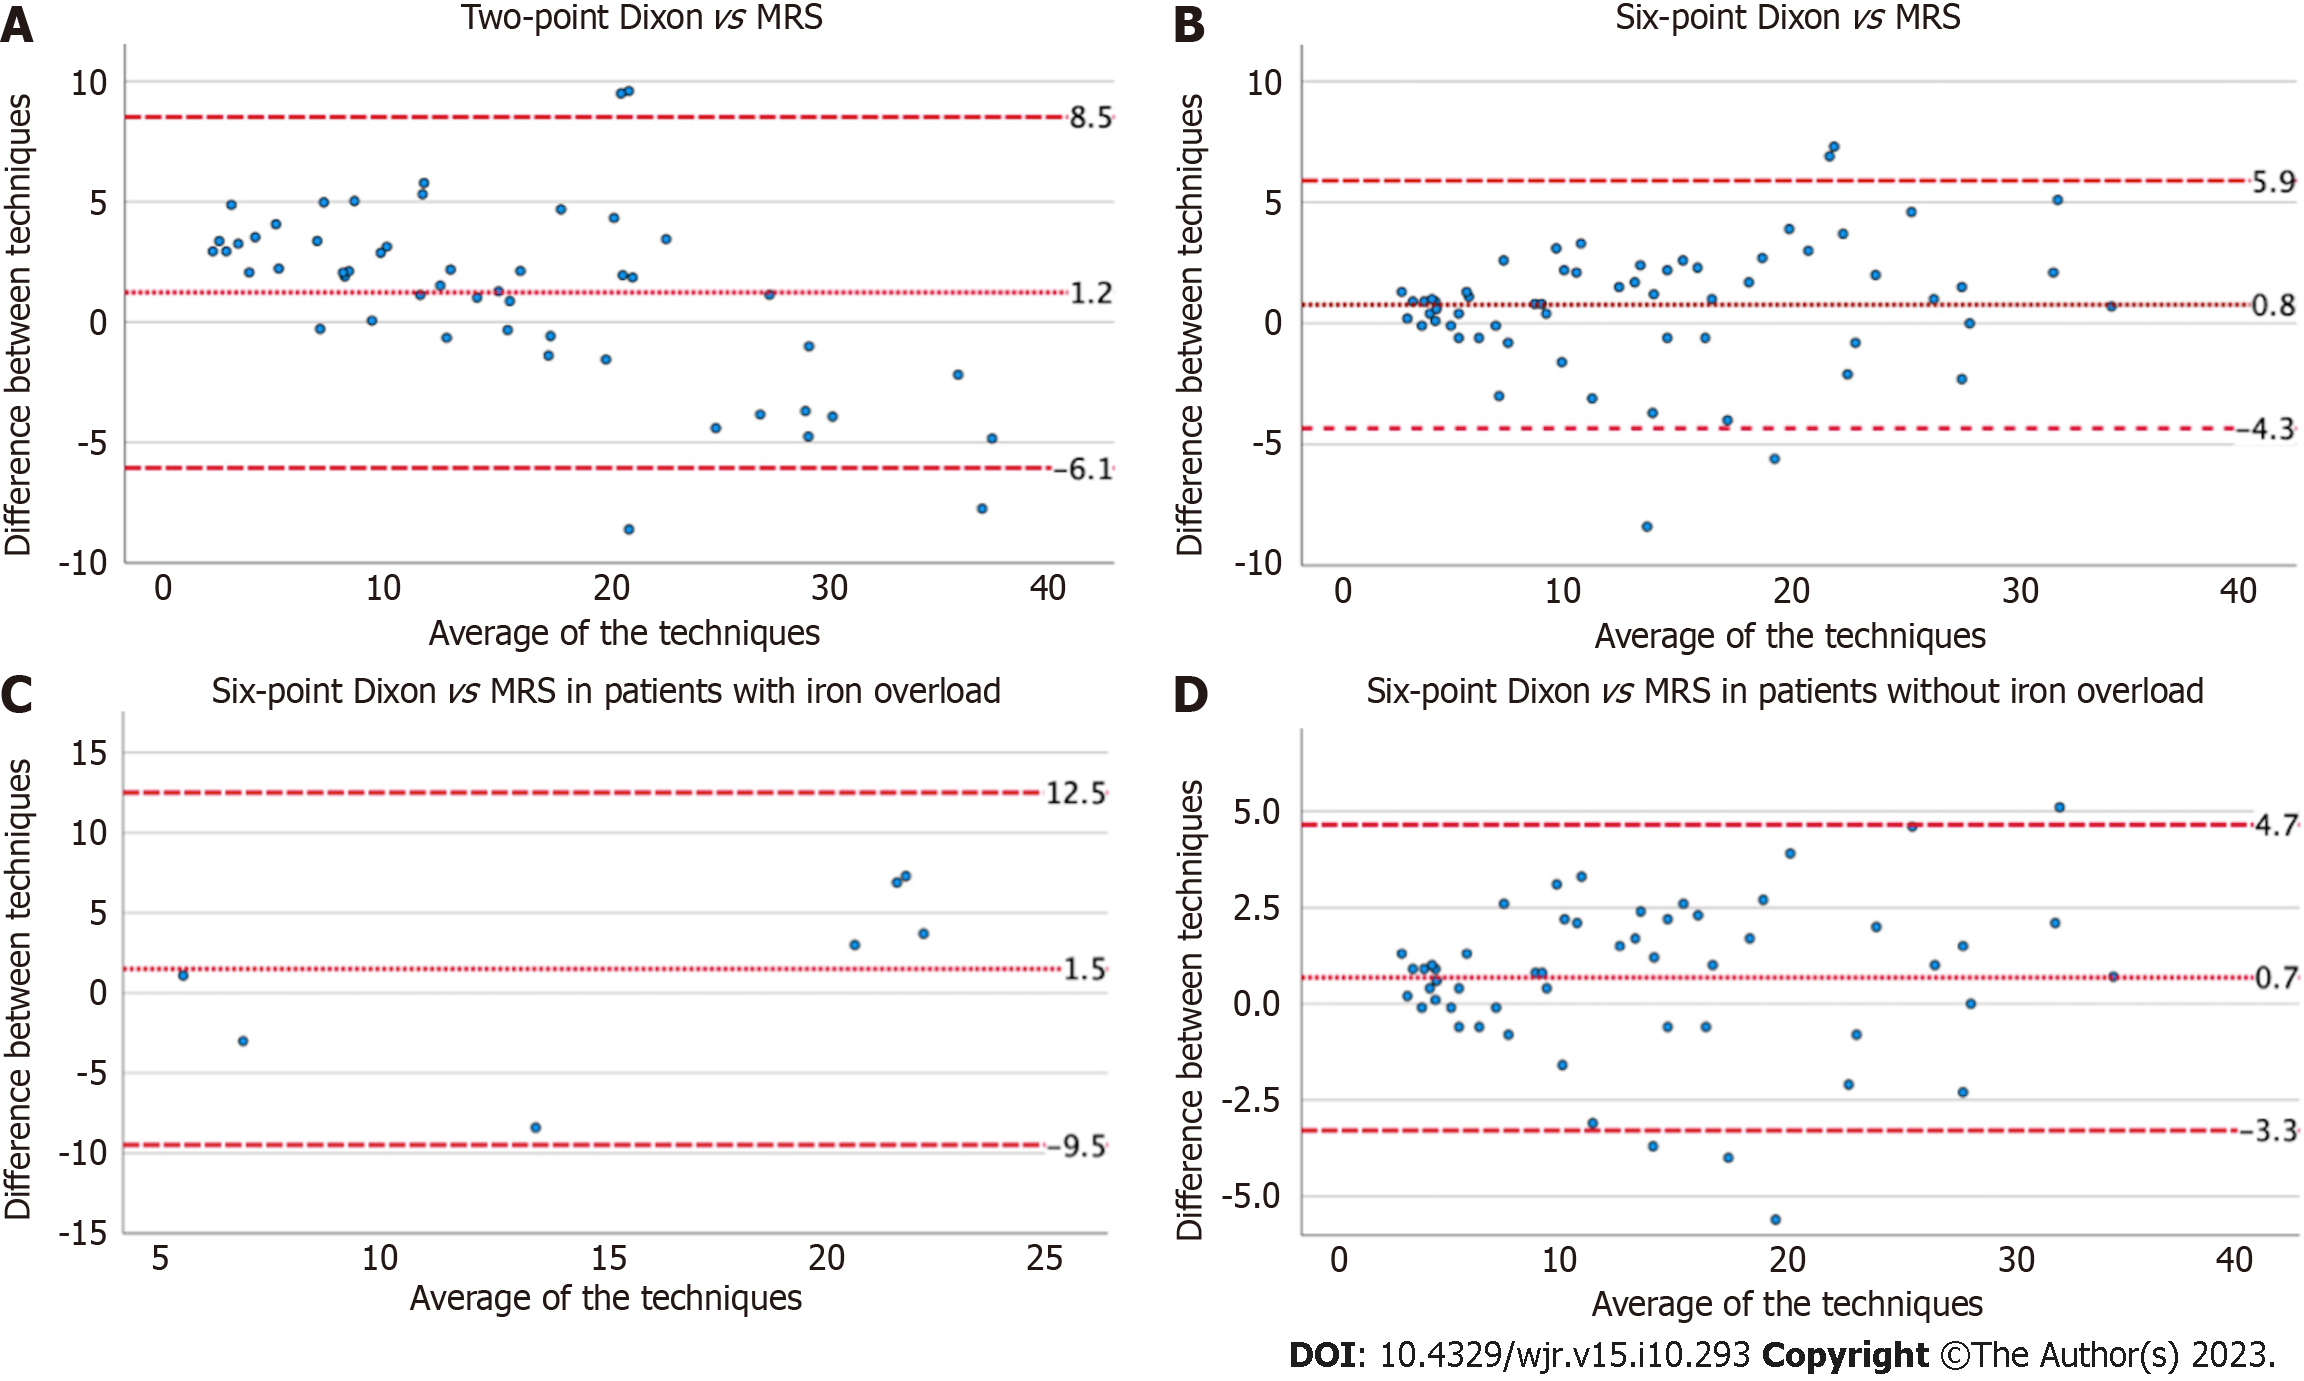
Figure 1 Bland Altman plots demonstrate the inter-test variability for fat fraction estimates.
A: Two-point Dixon vs magnetic resonance spectroscopy (MRS); B: Six-point Dixon vs MRS; C and D: Patients with and without liver iron overload on six-point Dixon vs MRS. MRS: Magnetic resonance spectroscopy.
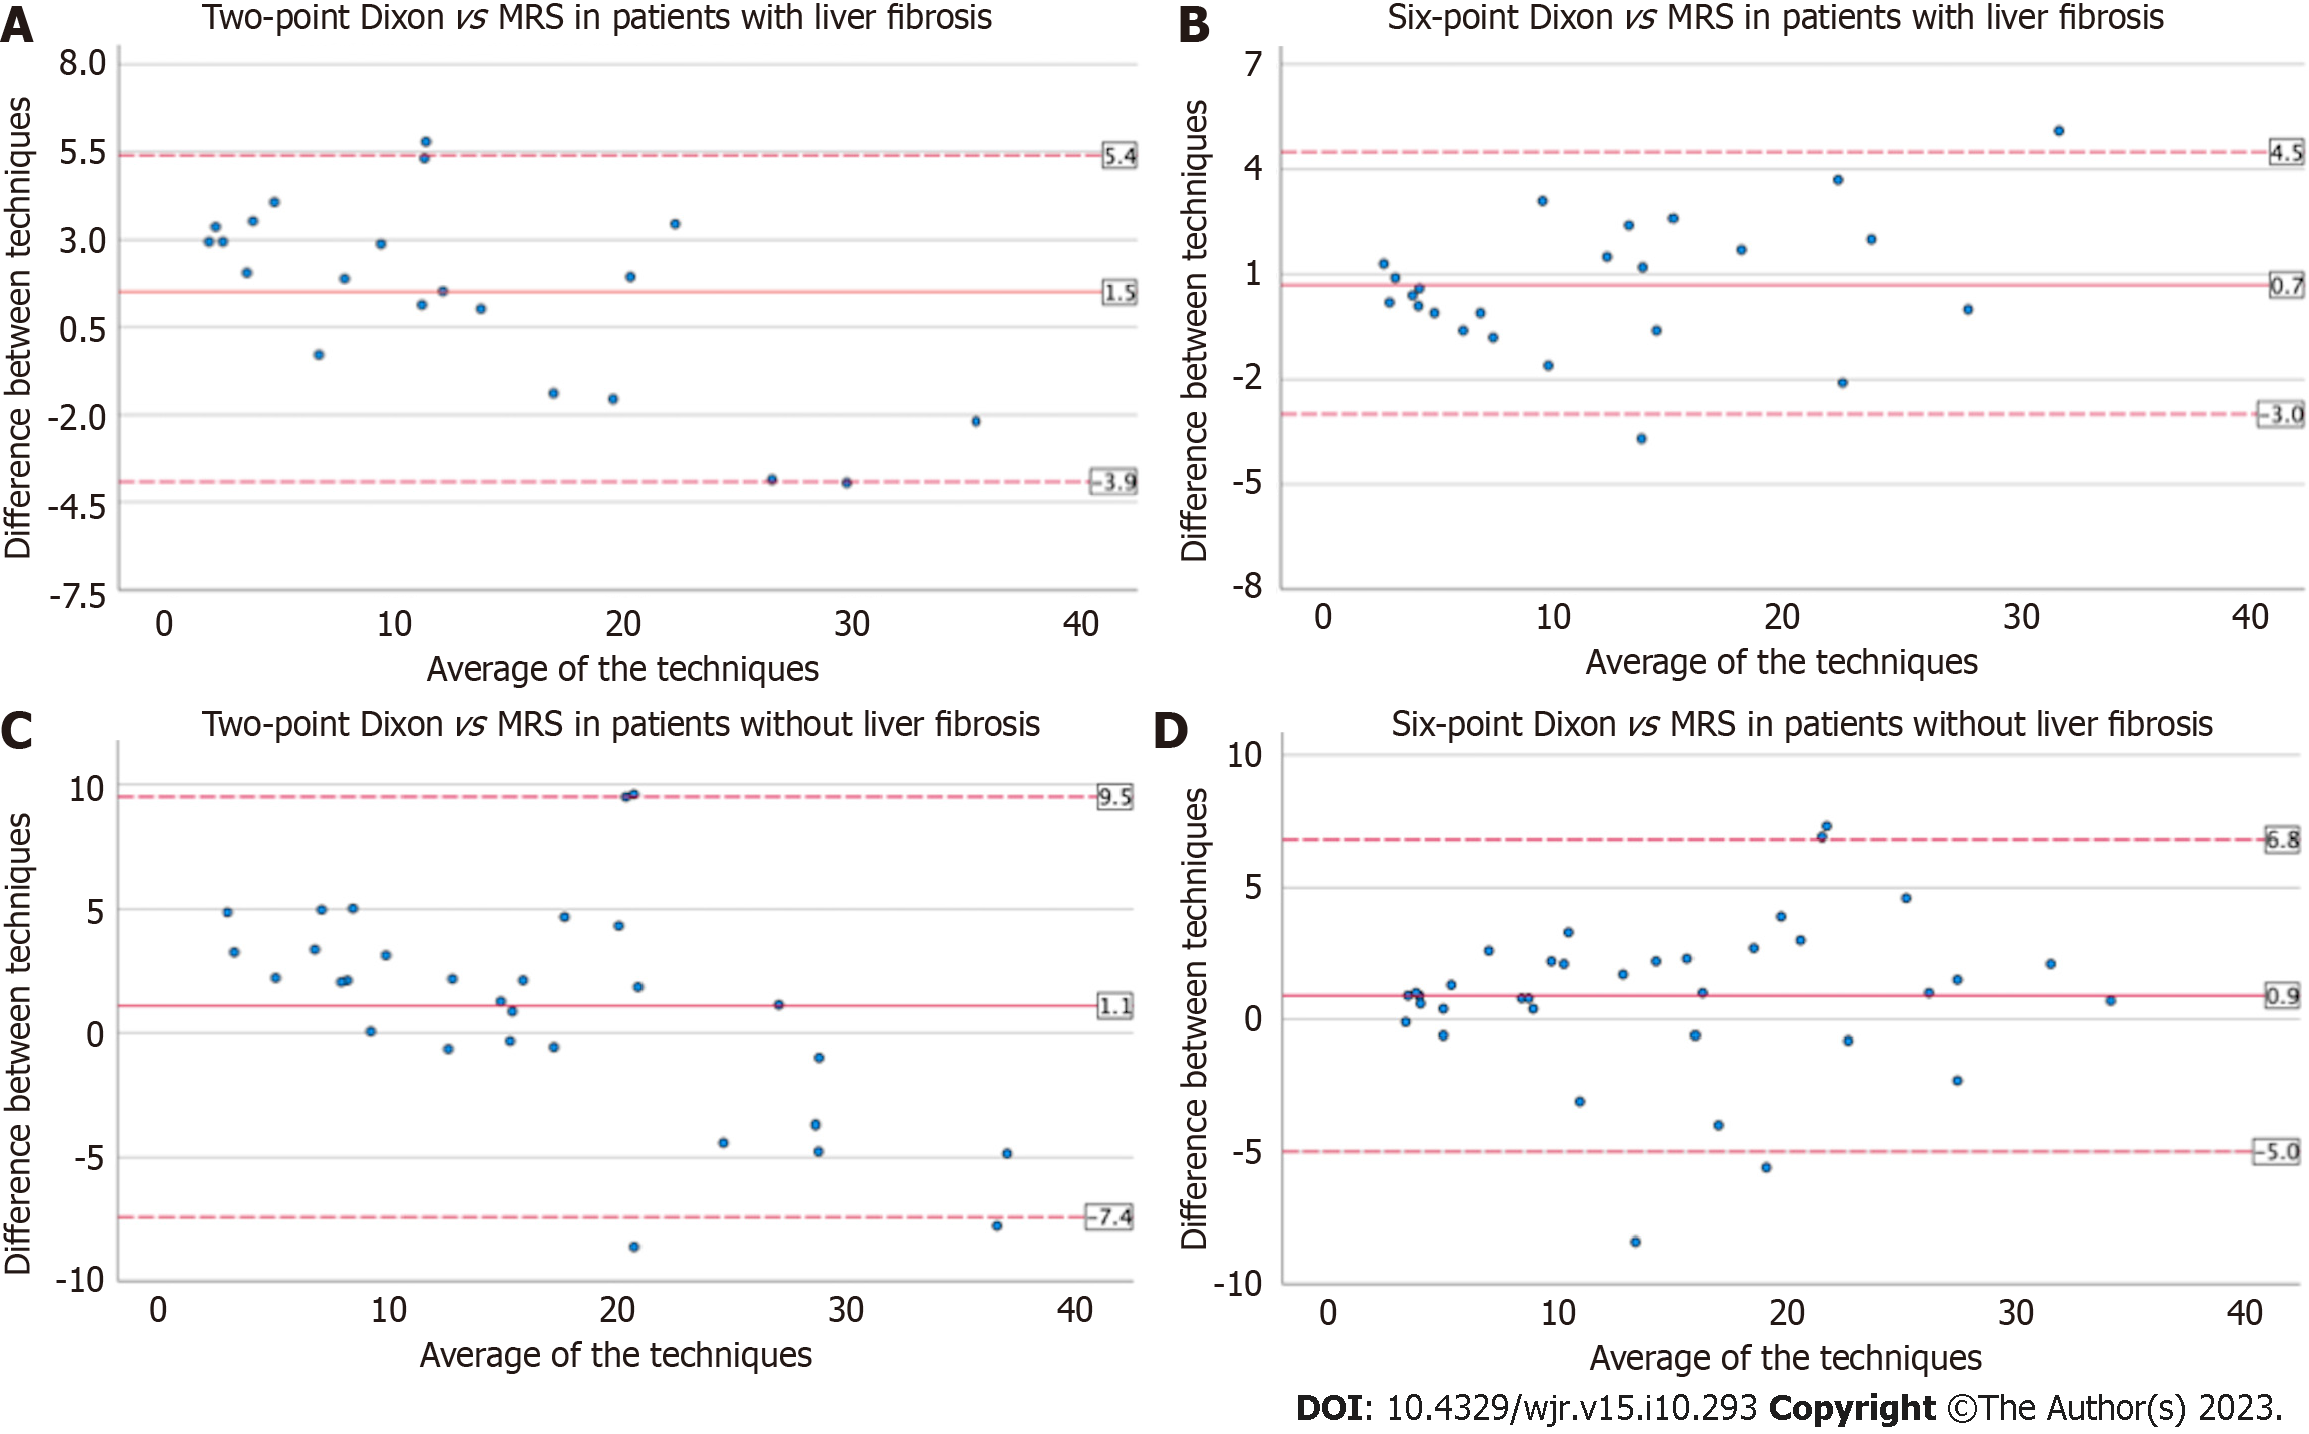
Figure 2 Bland Altman plots demonstrate the inter-test variability for fat fraction estimates vs magnetic resonance spectroscopy for patients with and without liver fibrosis on two-point Dixon and six-point Dixon.
A: Two-point Dixon vs magnetic resonance spectroscopy (MRS) in patients with liver fibrosis; B: Six-point Dixon vs MRS in patients with liver fibrosis; C: Two-point Dixon vs MRS in patients without liver fibrosis; D: Six-point Dixon vs MRS in patients without liver fibrosis. MRS: Magnetic resonance spectroscopy.
Figure 3 Scatterplots demonstrate a strong linear relationship.
A: Scatterplots demonstrate a strong linear relationship between two-point Dixon vs magnetic resonance spectroscopy (MRS); B: Scatterplots demonstrate a strong linear relationship between six-point Dixon vs MRS for liver fat quantification. MRS: Magnetic resonance spectroscopy; PDFF: Proton density fat fraction.
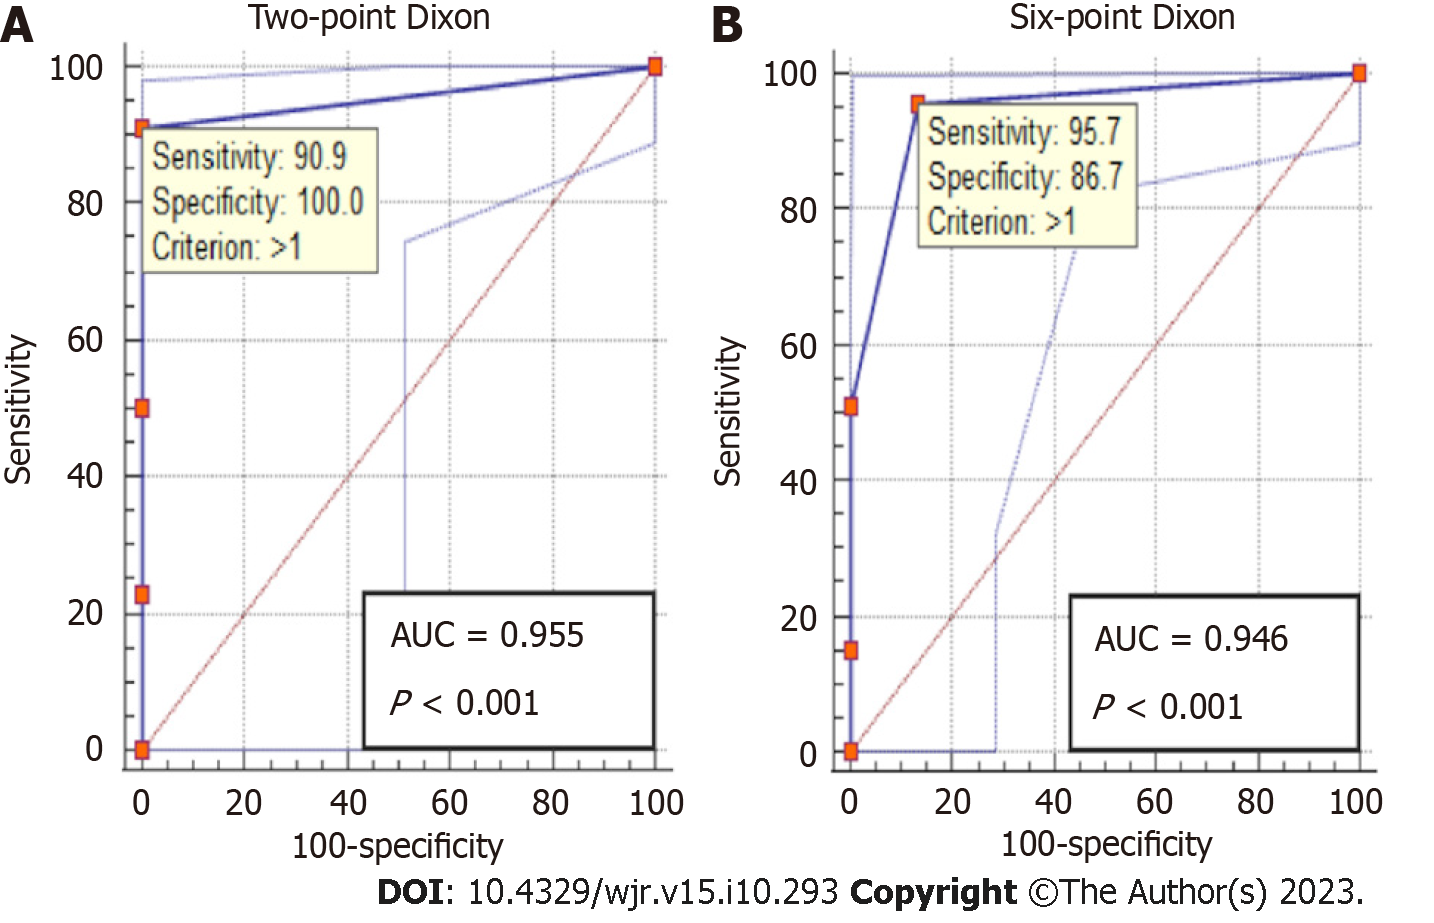
Figure 4 Receiver operating characteristic analysis demonstrates excellent accuracy for detecting hepatic steatosis on two-point Dixon and six-point Dixon.
A: Two-point Dixon; B: Six-point Dixon. AUC: Area under the curve.
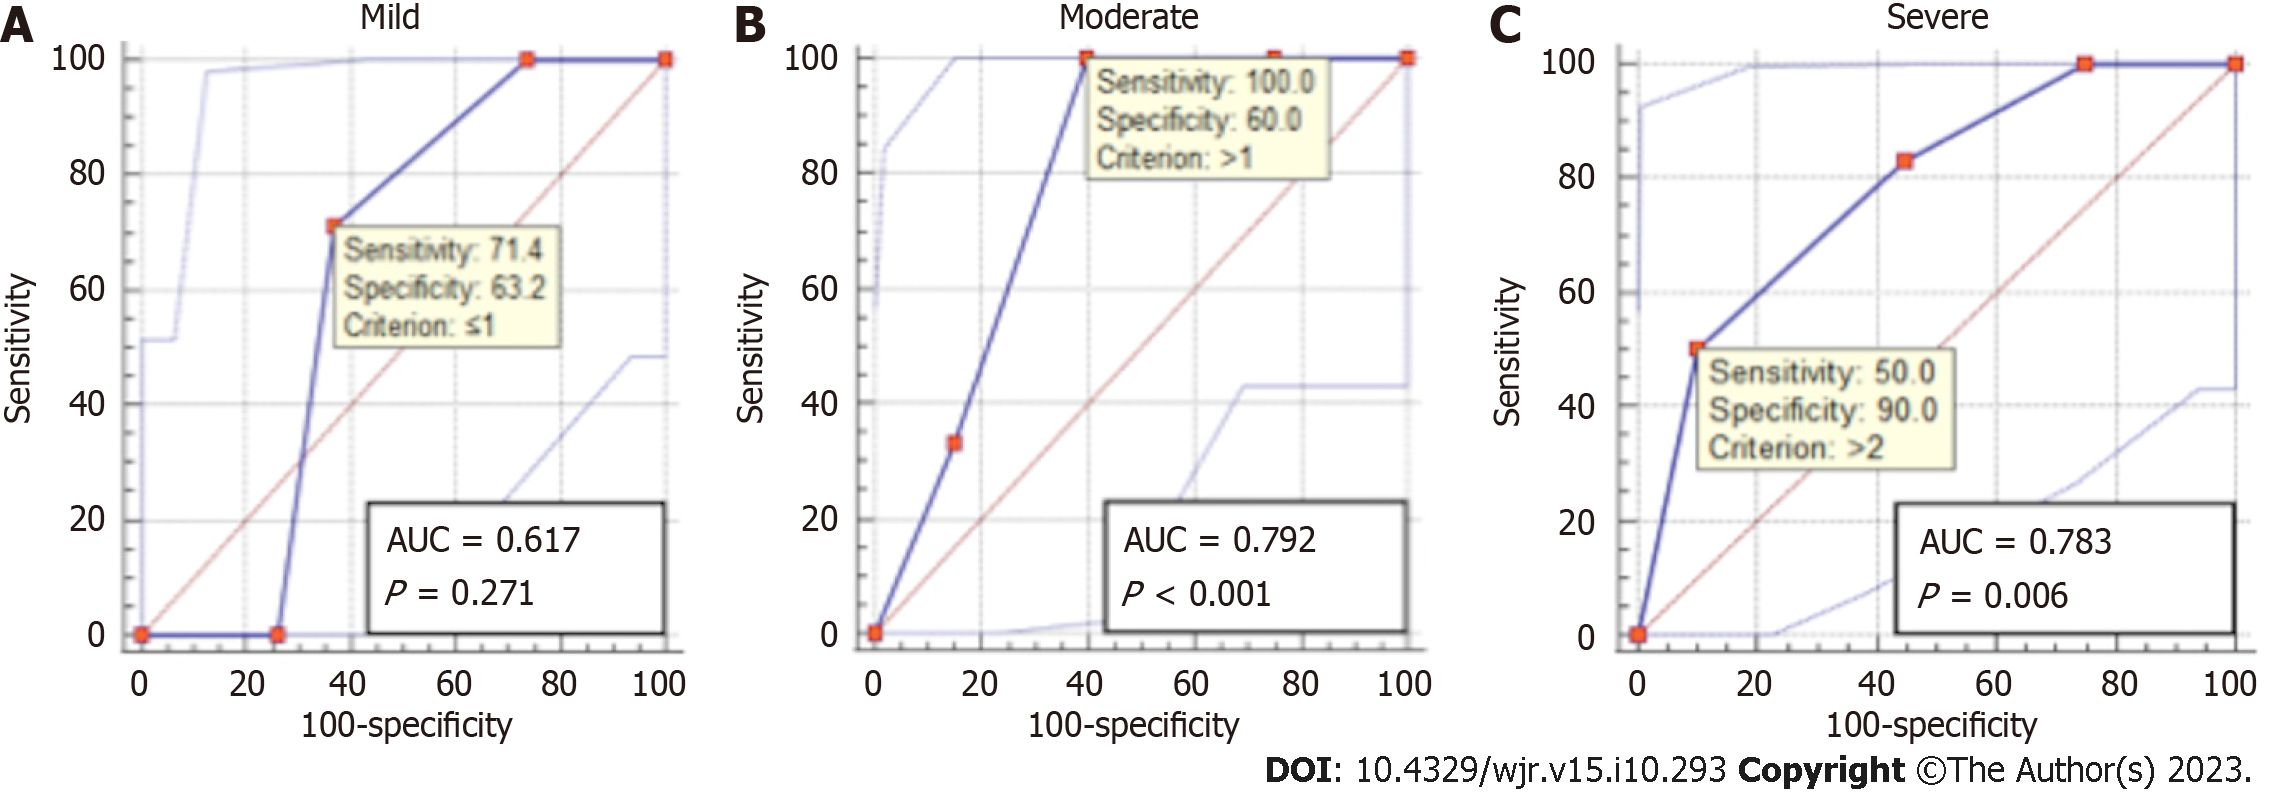
Figure 5 Receiver operating characteristic analysis.
A: The accuracy for grading mild hepatic steatosis on two-point Dixon and six-point Dixon; B: The accuracy for grading moderate hepatic steatosis on two-point Dixon and six-point Dixon; C: The accuracy for grading severe hepatic steatosis on two-point Dixon and six-point Dixon. Two-point Dixon was performed in patients with no iron overload while six-point Dixon was performed in a mixed cohort of patients with and without iron overload. AUC: Area under the curve.
Figure 6 Receiver operating characteristic analysis.
A: Receiver operating characteristic (ROC) analysis demonstrates excellent accuracy for grading mild hepatic steatosis on six-point Dixon in patients with no iron overload; B: ROC analysis demonstrates good accuracy for detecting hepatic steatosis on ultrasound. AUC: Area under the curve.
Figure 7 Receiver operating characteristic analysis shows the accuracy for grading mild, moderate and severe hepatic steatosis on ultrasound.
A: The accuracy for grading mild hepatic steatosis on ultrasound; B: The accuracy for grading moderate hepatic steatosis on ultrasound; C: The accuracy for grading severe hepatic steatosis on ultrasound. AUC: Area under the curve.
- Citation: Elfaal M, Supersad A, Ferguson C, Locas S, Manolea F, Wilson MP, Sam M, Tu W, Low G. Two-point Dixon and six-point Dixon magnetic resonance techniques in the detection, quantification and grading of hepatic steatosis. World J Radiol 2023; 15(10): 293-303
- URL: https://www.wjgnet.com/1949-8470/full/v15/i10/293.htm
- DOI: https://dx.doi.org/10.4329/wjr.v15.i10.293


