Copyright
©The Author(s) 2023.
World J Radiol. Jan 28, 2023; 15(1): 20-31
Published online Jan 28, 2023. doi: 10.4329/wjr.v15.i1.20
Published online Jan 28, 2023. doi: 10.4329/wjr.v15.i1.20
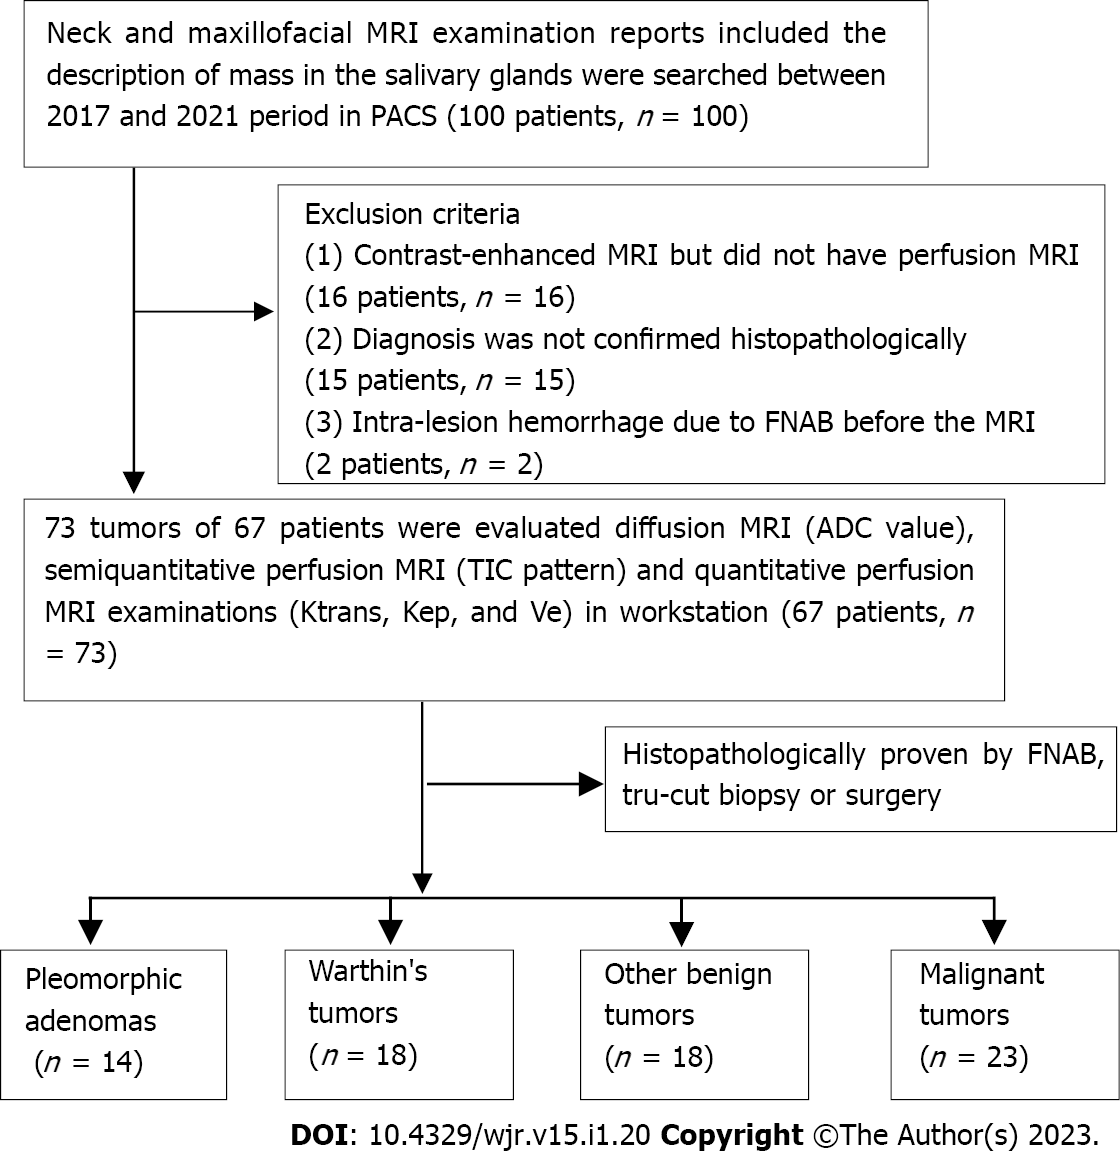
Figure 1 Patient inclusion and exclusion flowchart.
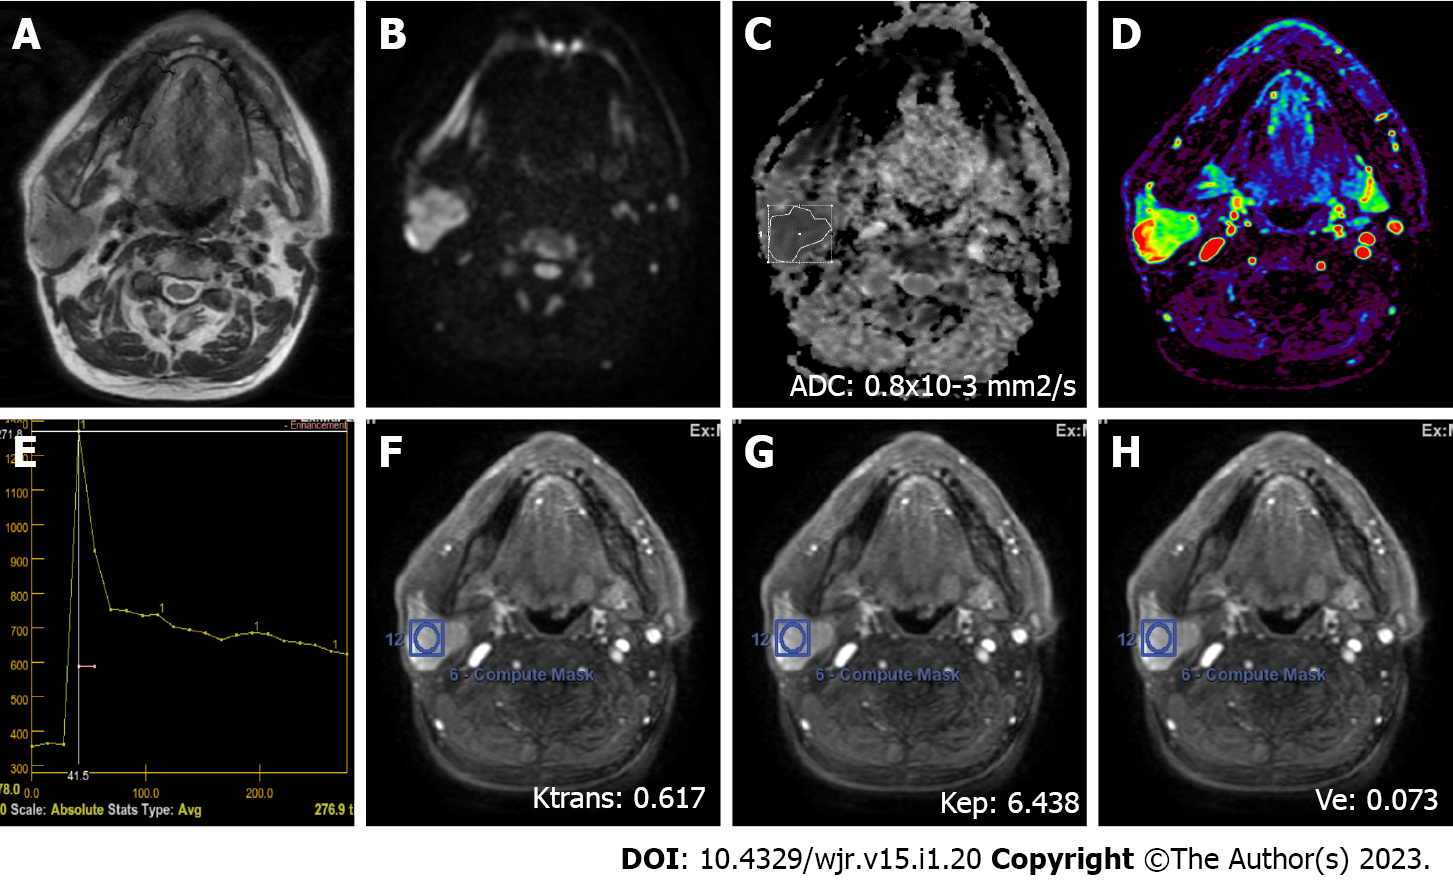
Figure 2 A 72-year-old male patient with a Warthin’s tumor in the right parotid gland.
A: On axial plane T2-weighted image, a mildly hypointense (compared to the gland), smooth-contoured mass localized in the center of the parotid gland is observed; B: On the diffusion-weighted image, the mass appears to be hyperintense; C: ADC value was 0.8 × 10⁻³ mm2/s on the apparent diffusion coefficient map; D: The mass is hyperperfused on color-coded perfusion image; E: Type B time intensity curve shows a washout ratio of 75%; F, G, and H: Ktrans, Kep, and Ve values on quantitative perfusion images were 0.617 min-1, 6.438 min-1, and 0.073, respectively. ADC: Apparent diffusion coefficient.
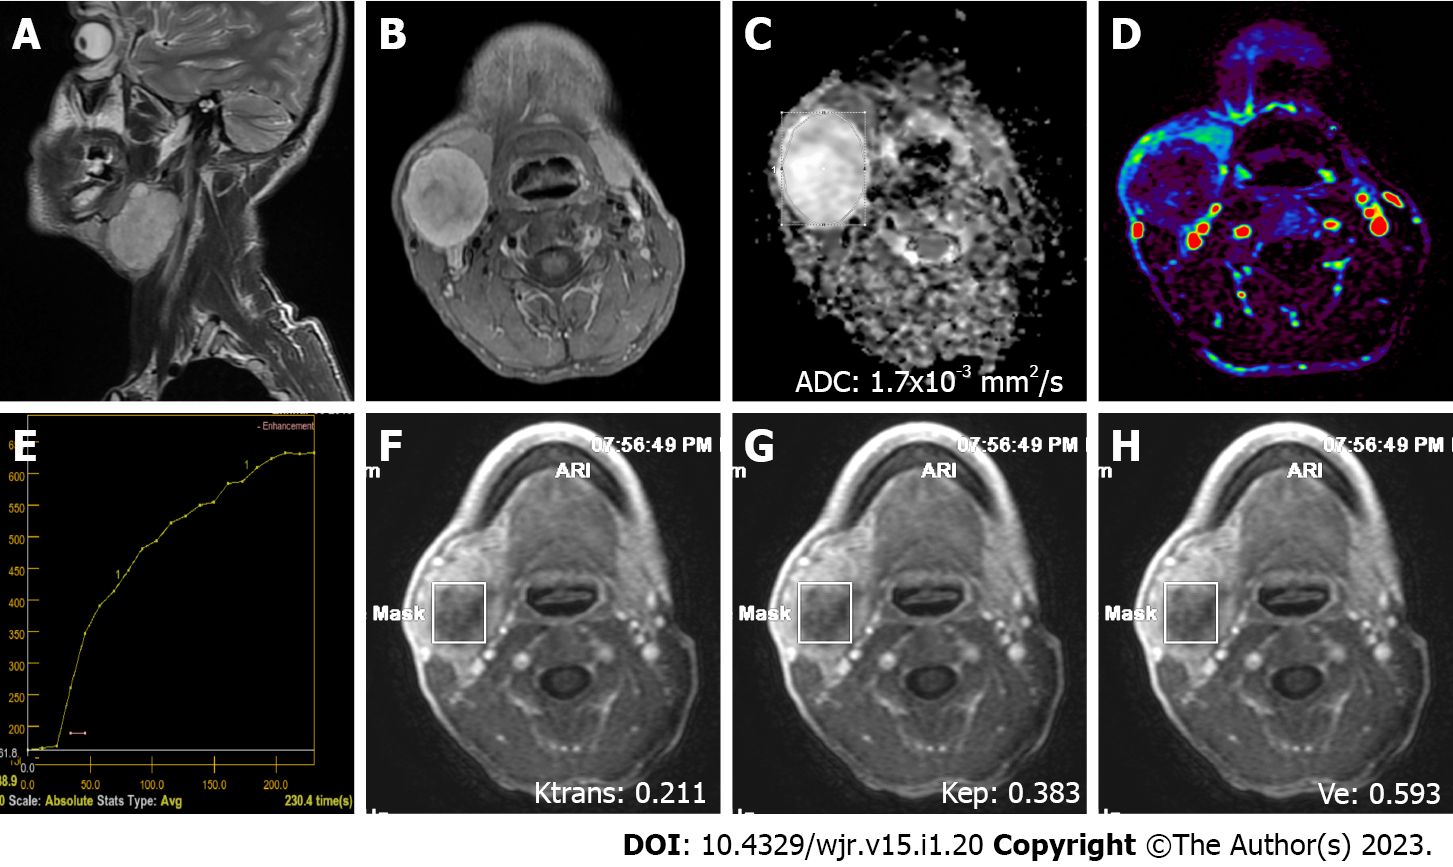
Figure 3 A 38-year-old male patient with a pleomorphic adenoma in the right submandibular gland.
A: On sagittal plane T2-weighted image, a hyperintense (compared to the gland), smooth, slightly lobule-contoured mass is observed; B: On contrast-enhanced axial plane T1-weighted image, intense contrast-enhancement is observed in the mass; C: The mass is hyperintense on the apparent diffusion coefficient map due to facilitated diffusion (ADC value: 1.7 × 10⁻³ mm2/s); D: The mass is hypoperfused on color coded perfusion image; E: The tumor has type A time intensity curve; F, G, and H: Ktrans, Kep, and Ve values on quantitative perfusion images were 0.211 min-1, 0.383 min-1, and 0.593, respectively. ADC: Apparent diffusion coefficient.
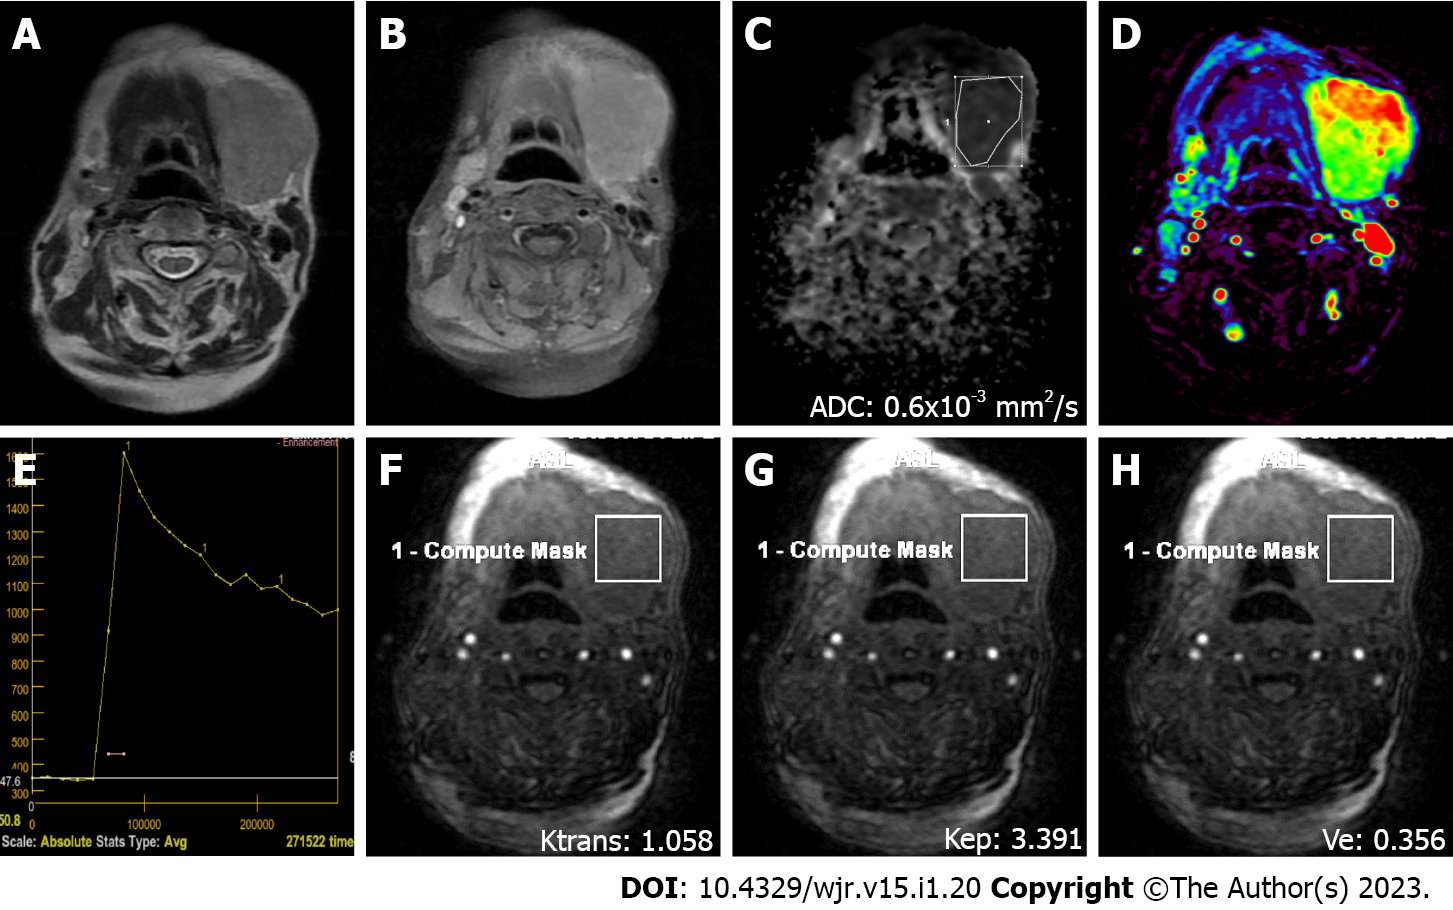
Figure 4 A 76-year-old female patient with diffuse large B cell lymphoma and a mass in the left submandibular gland region.
A: On axial T2-weighted image, a smooth-contoured mass with homogeneous internal structure and an intensity similar to that of the submandibular gland is observed; B: Axial contrast-enhanced image shows the intense homogeneous contrast enhancement of the mass; C: On the apparent coefficient mapping image, the mass features prominent diffusion restriction (ADC value: 0.6 × 10⁻³ mm2/s); D: The mass is hyperperfused on color coded perfusion image; E: Type B time intensity curve shows a 48% washout ratio; F, G, and H: Ktrans, Kep, and Ve values on quantitative perfusion images were 1.058 min-1, 3.391 min-1, and 0.356, respectively. ADC: Apparent diffusion coefficient.
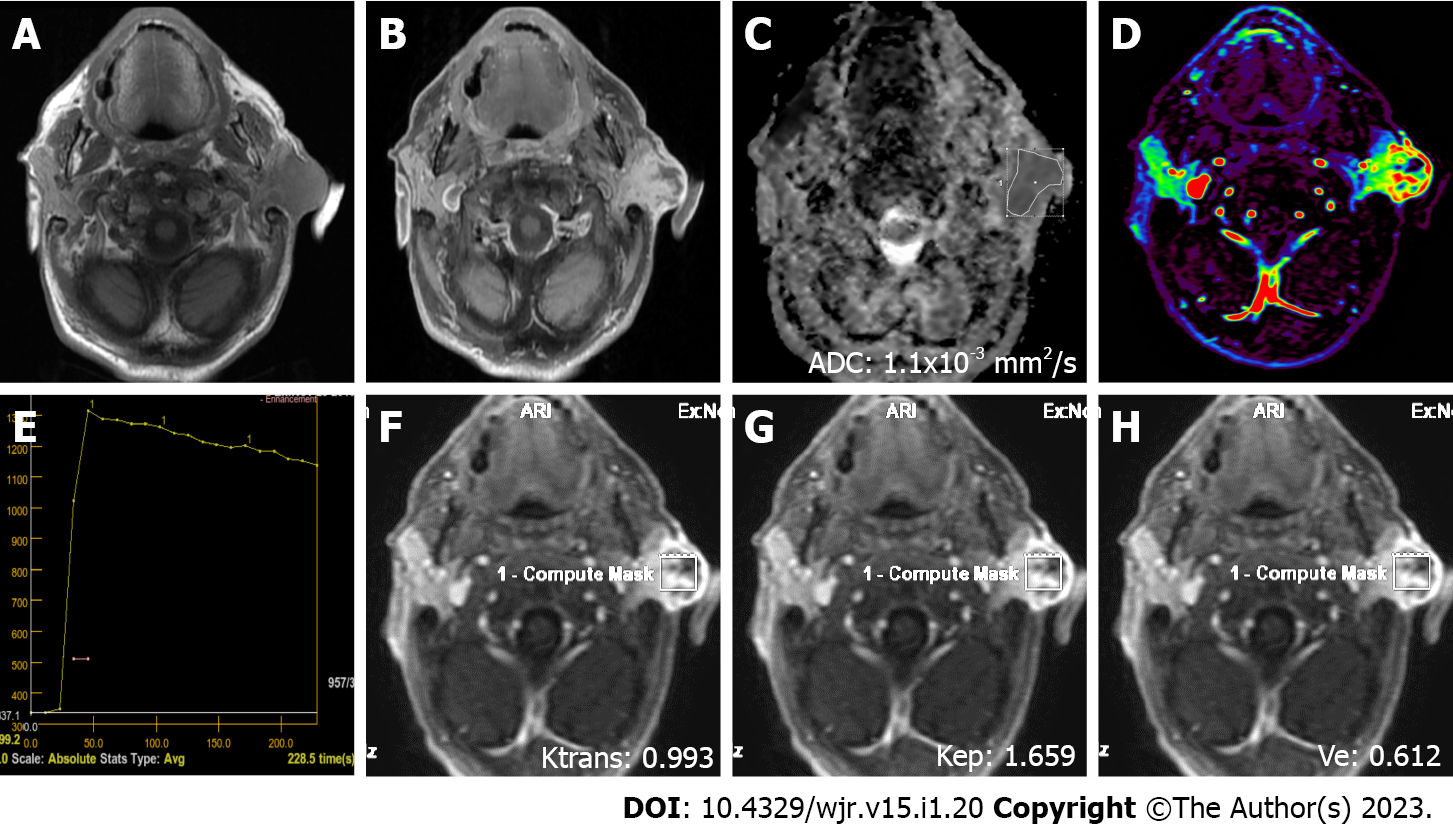
Figure 5 A 79-year-old male patient with squamous cell cancer in the left parotid gland.
A: On axial plane T1-weighted image, an irregularly contoured, hypointense mass involving skin and subcutaneous tissues is observed; B: On axial contrast-enhanced T1-weighted image, the mass shows an intense heterogeneous contrast enhancement; C: ADC value on the apparent diffusion coefficient map was 1.1 × 10⁻³ mm2/s; D: The mass is heterogeneously hyperperfused on color coded perfusion image; E: Type C time intensity curve shows a 10% washout ratio; F, G, and H: Ktrans, Kep, and Ve values on quantitative perfusion images were 0.993 min-1, 1.659 min-1, and 0.612, respectively. ADC: Apparent diffusion coefficient.
- Citation: Gökçe E, Beyhan M. Diagnostic efficacy of diffusion-weighted imaging and semiquantitative and quantitative dynamic contrast-enhanced magnetic resonance imaging in salivary gland tumors. World J Radiol 2023; 15(1): 20-31
- URL: https://www.wjgnet.com/1949-8470/full/v15/i1/20.htm
- DOI: https://dx.doi.org/10.4329/wjr.v15.i1.20


