Copyright
©The Author(s) 2022.
World J Radiol. Sep 28, 2022; 14(9): 319-328
Published online Sep 28, 2022. doi: 10.4329/wjr.v14.i9.319
Published online Sep 28, 2022. doi: 10.4329/wjr.v14.i9.319
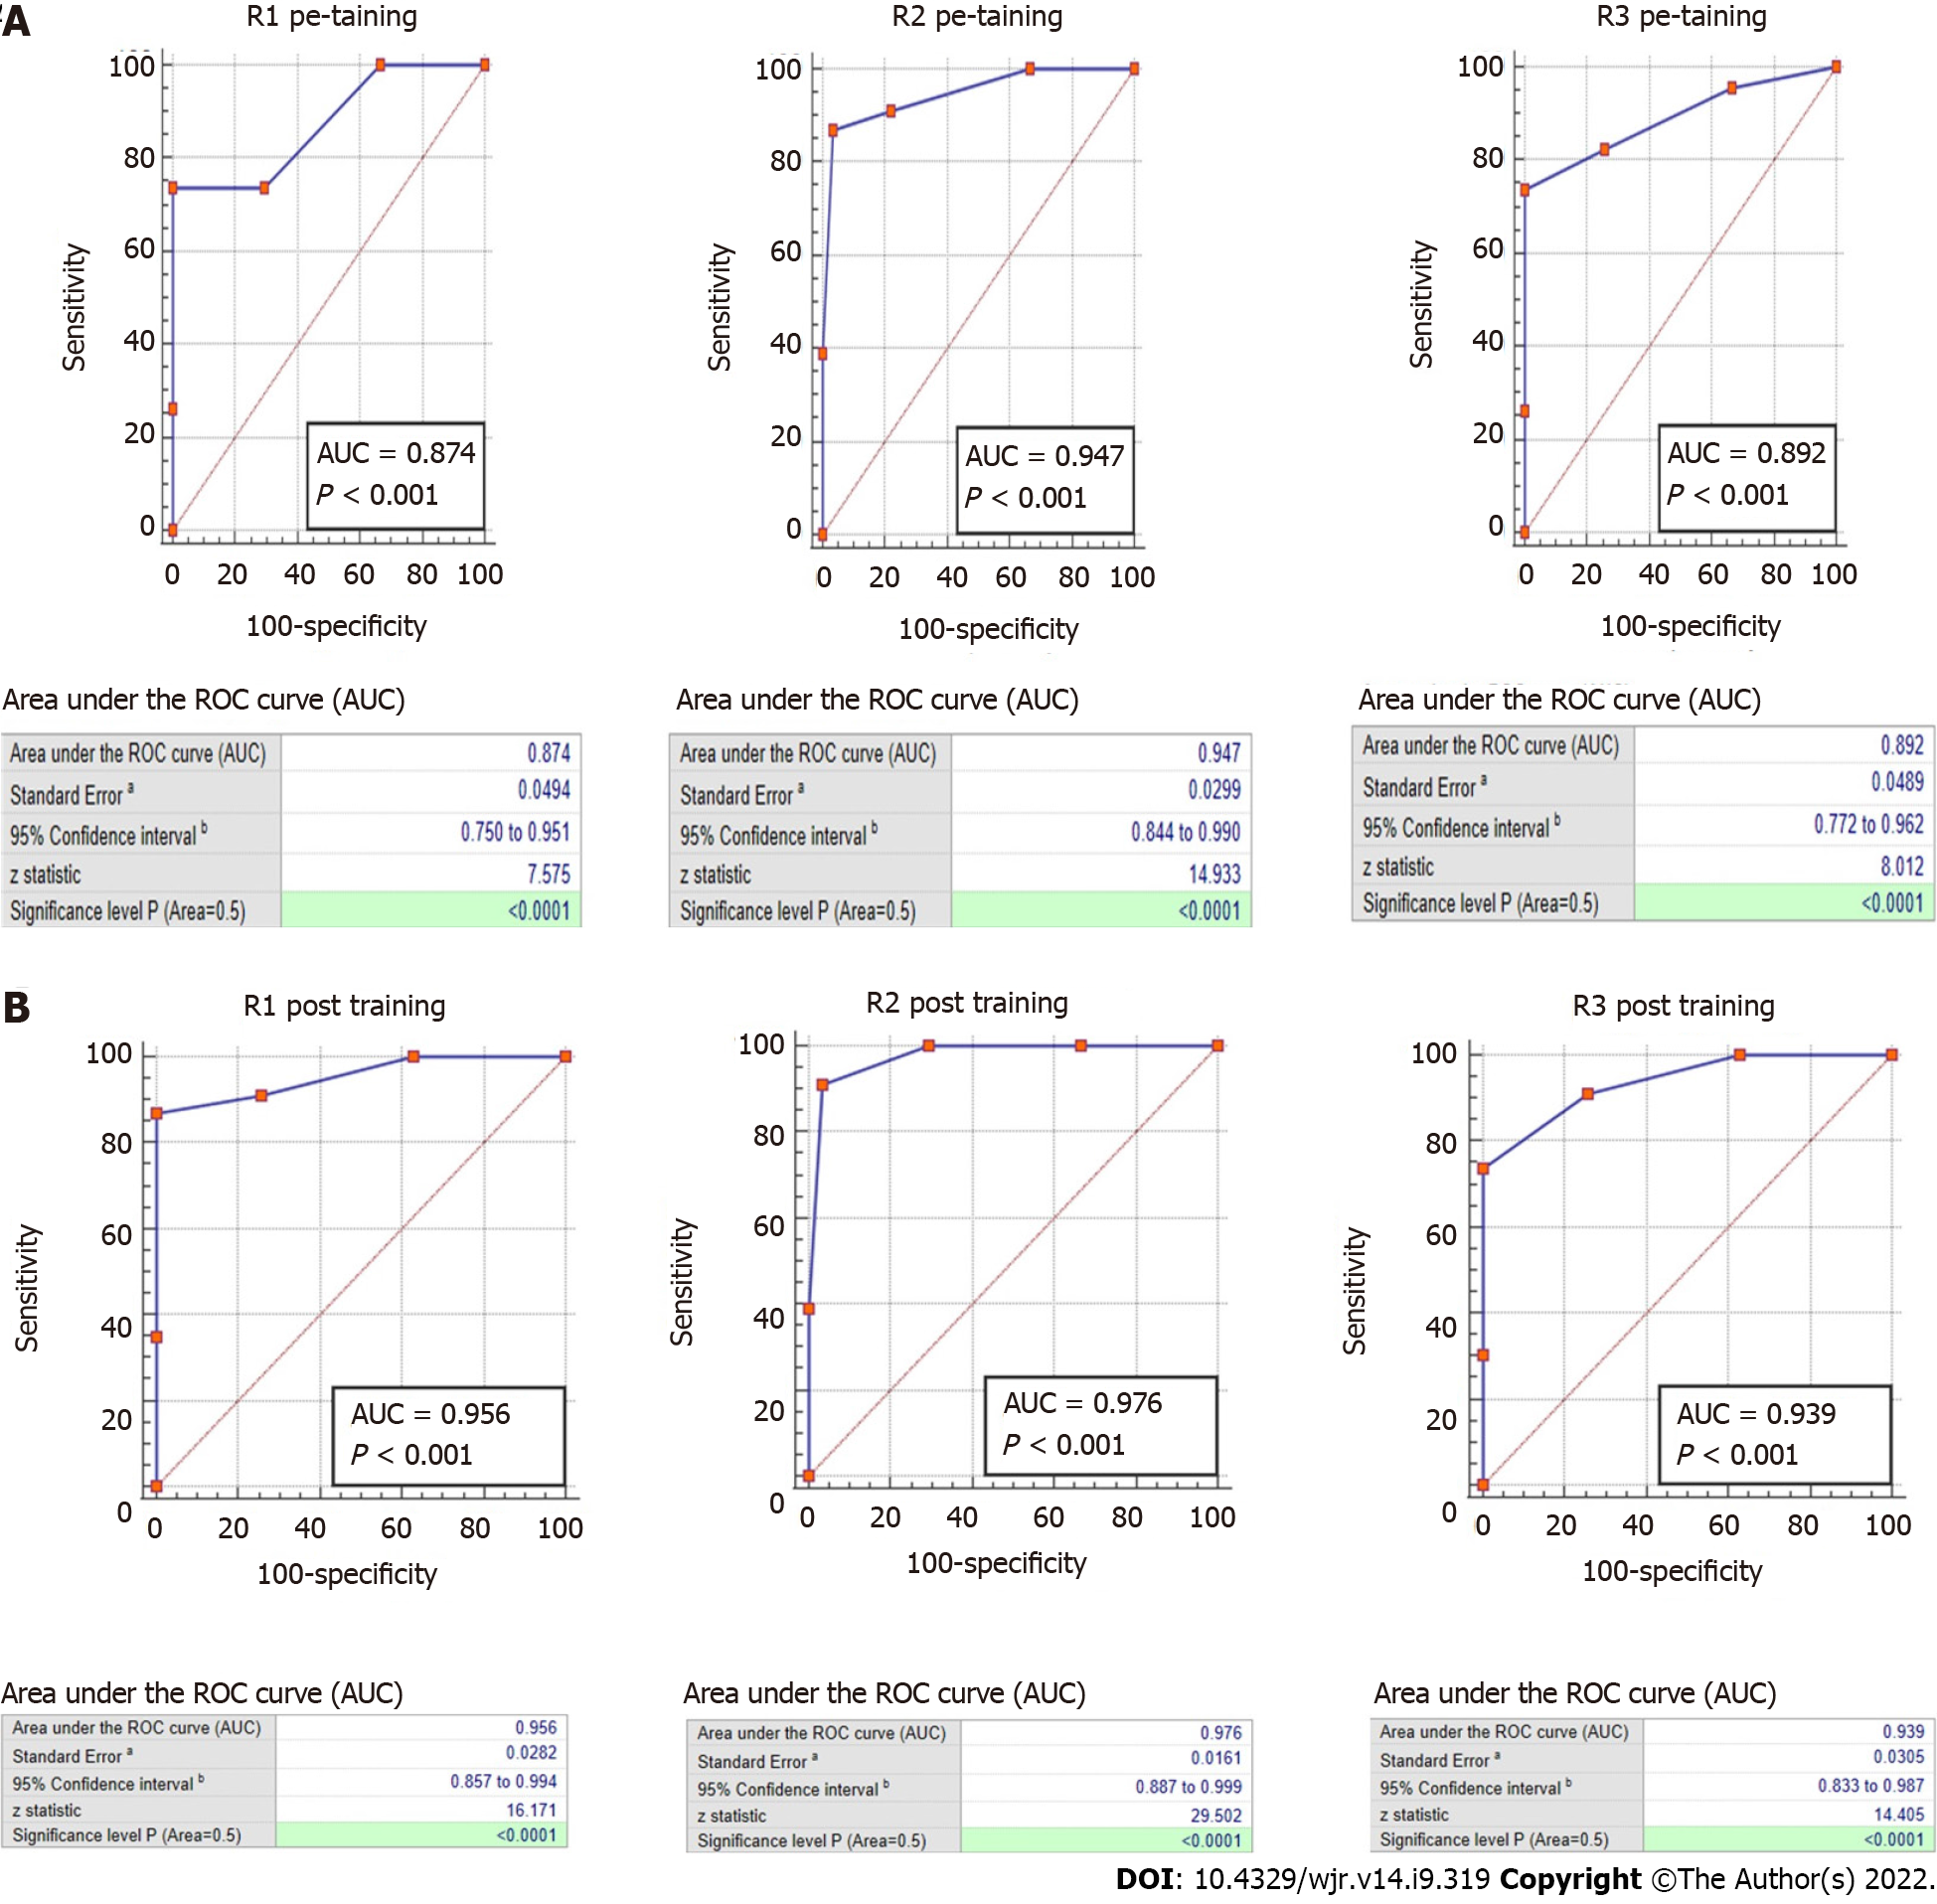
Figure 1 Receiver operating characteristic curve.
A: Receiver operating characteristic (ROC) curve of each reader on the pre-training assessment; B: ROC curve of each reader on the post-training assessment. AUC: Area under the curve.
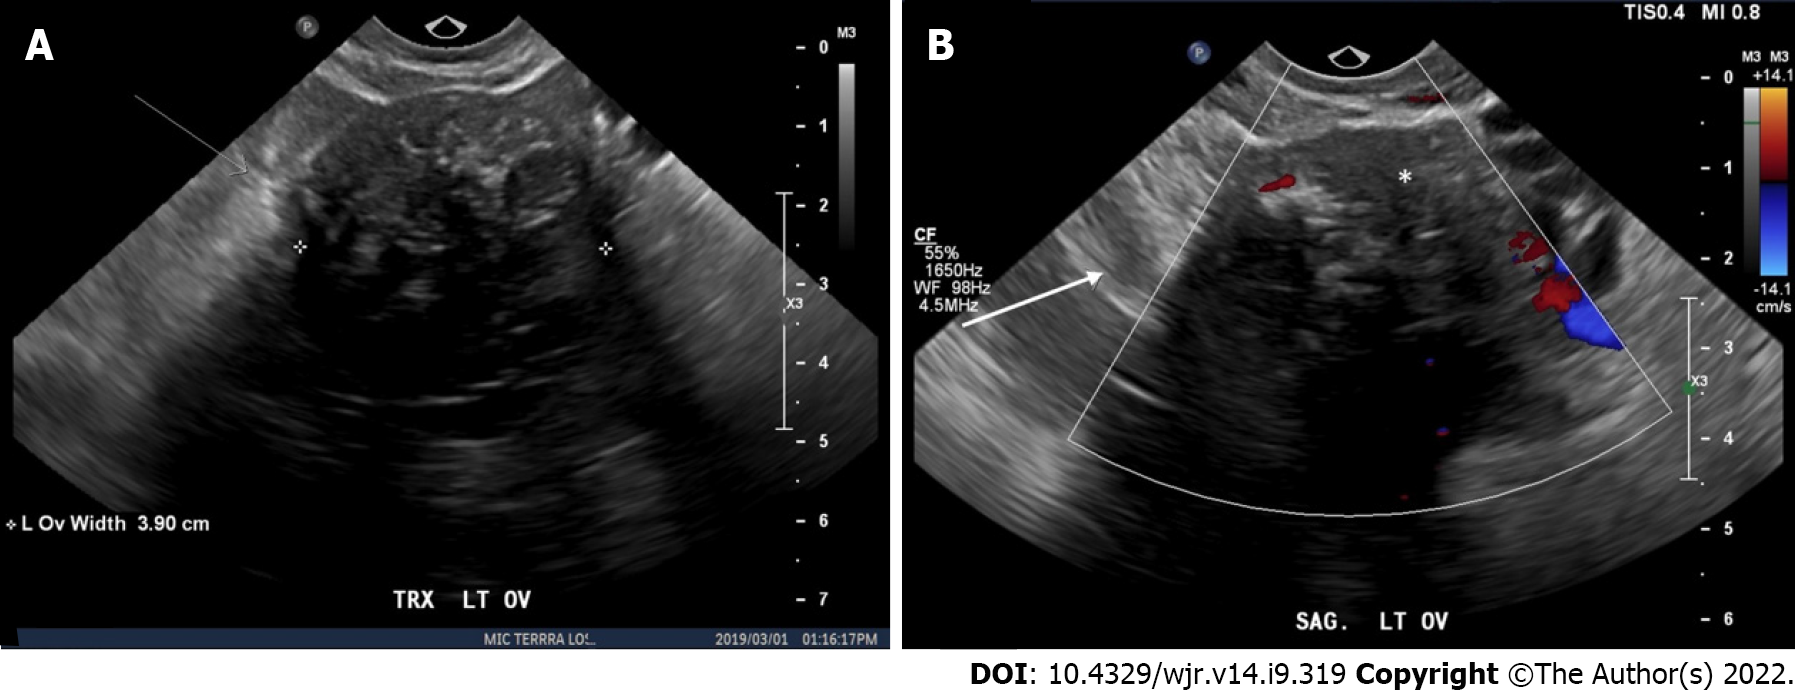
Figure 2 An example of a left ovarian solid lesion misclassified as a typical ovarian dermoid.
A: Static gray-scale images; B: Static color Doppler ultrasound images. Static gray-scale and color Doppler ultrasound images shows a solid hypoechoic lesion with a non-uniform (irregular) margin demonstrated on the color Doppler image (Ovarian-Adnexal Reporting and Data System 5). The lesion demonstrates punctate echogenic areas (white asterisk) which are less echogenic than the surrounding pelvic fat (white arrow). Further, the echogenic areas do not fulfill one of the three descriptors required to characterize as a “typical dermoid cyst < 10 cm” according to ovarian-adnexal reporting and data system criteria (2). The hypoechoic lesion with posterior shadowing suggests a fibrous lesion.
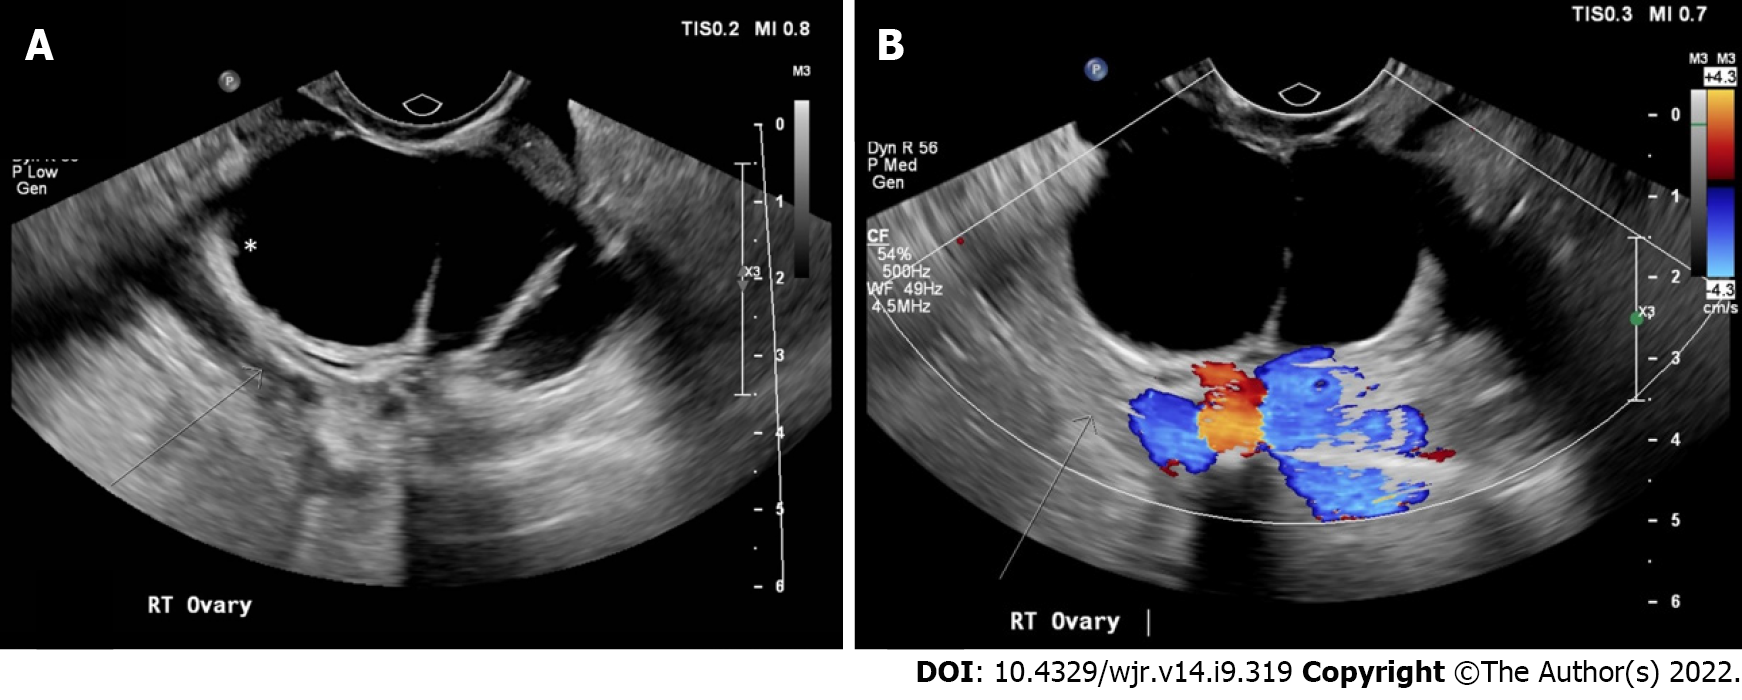
Figure 3 An example of a right ovarian cystic lesion misclassified as a “multilocular cyst < 10 cm, smooth inner wall, color score 1-3” (Ovarian-Adnexal Reporting and Data System 3).
A: Static gray-scale images; B: Static color Doppler ultrasound images. Static gray-scale and color Doppler ultrasound images show a multilocular cyst with a subtle non-uniform (irregular) inner wall with solid components < 3 mm in height (white asterisk) (ovarian-adnexal reporting and data system 4) (2).
- Citation: Katlariwala P, Wilson MP, Pi Y, Chahal BS, Croutze R, Patel D, Patel V, Low G. Reliability of ultrasound ovarian-adnexal reporting and data system amongst less experienced readers before and after training. World J Radiol 2022; 14(9): 319-328
- URL: https://www.wjgnet.com/1949-8470/full/v14/i9/319.htm
- DOI: https://dx.doi.org/10.4329/wjr.v14.i9.319


