Copyright
©The Author(s) 2022.
World J Radiol. Aug 28, 2022; 14(8): 293-310
Published online Aug 28, 2022. doi: 10.4329/wjr.v14.i8.293
Published online Aug 28, 2022. doi: 10.4329/wjr.v14.i8.293
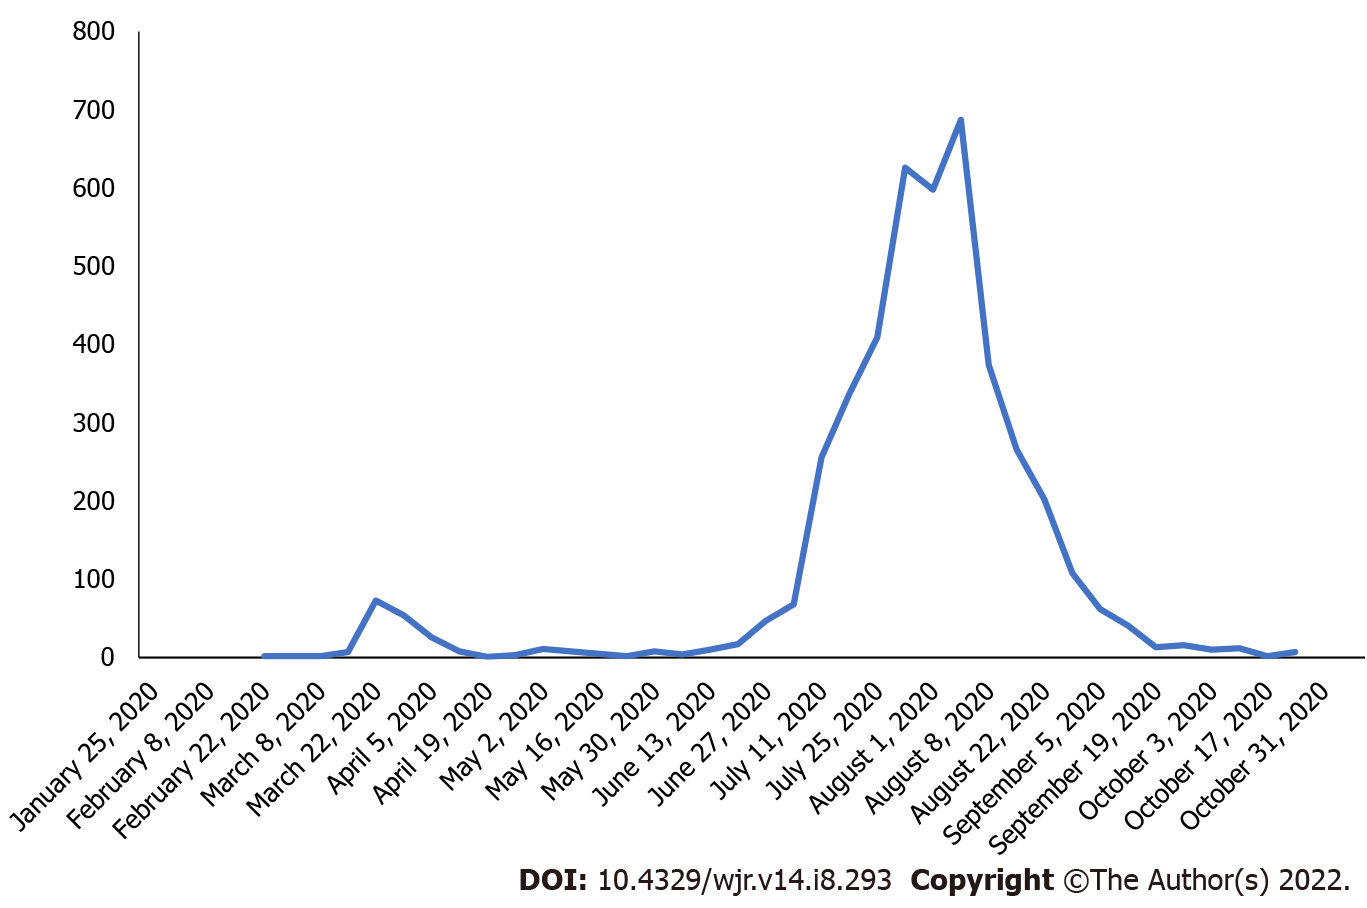
Figure 1
Victorian new the coronavirus disease 2019 case numbers by date from January 2020-November 2020.
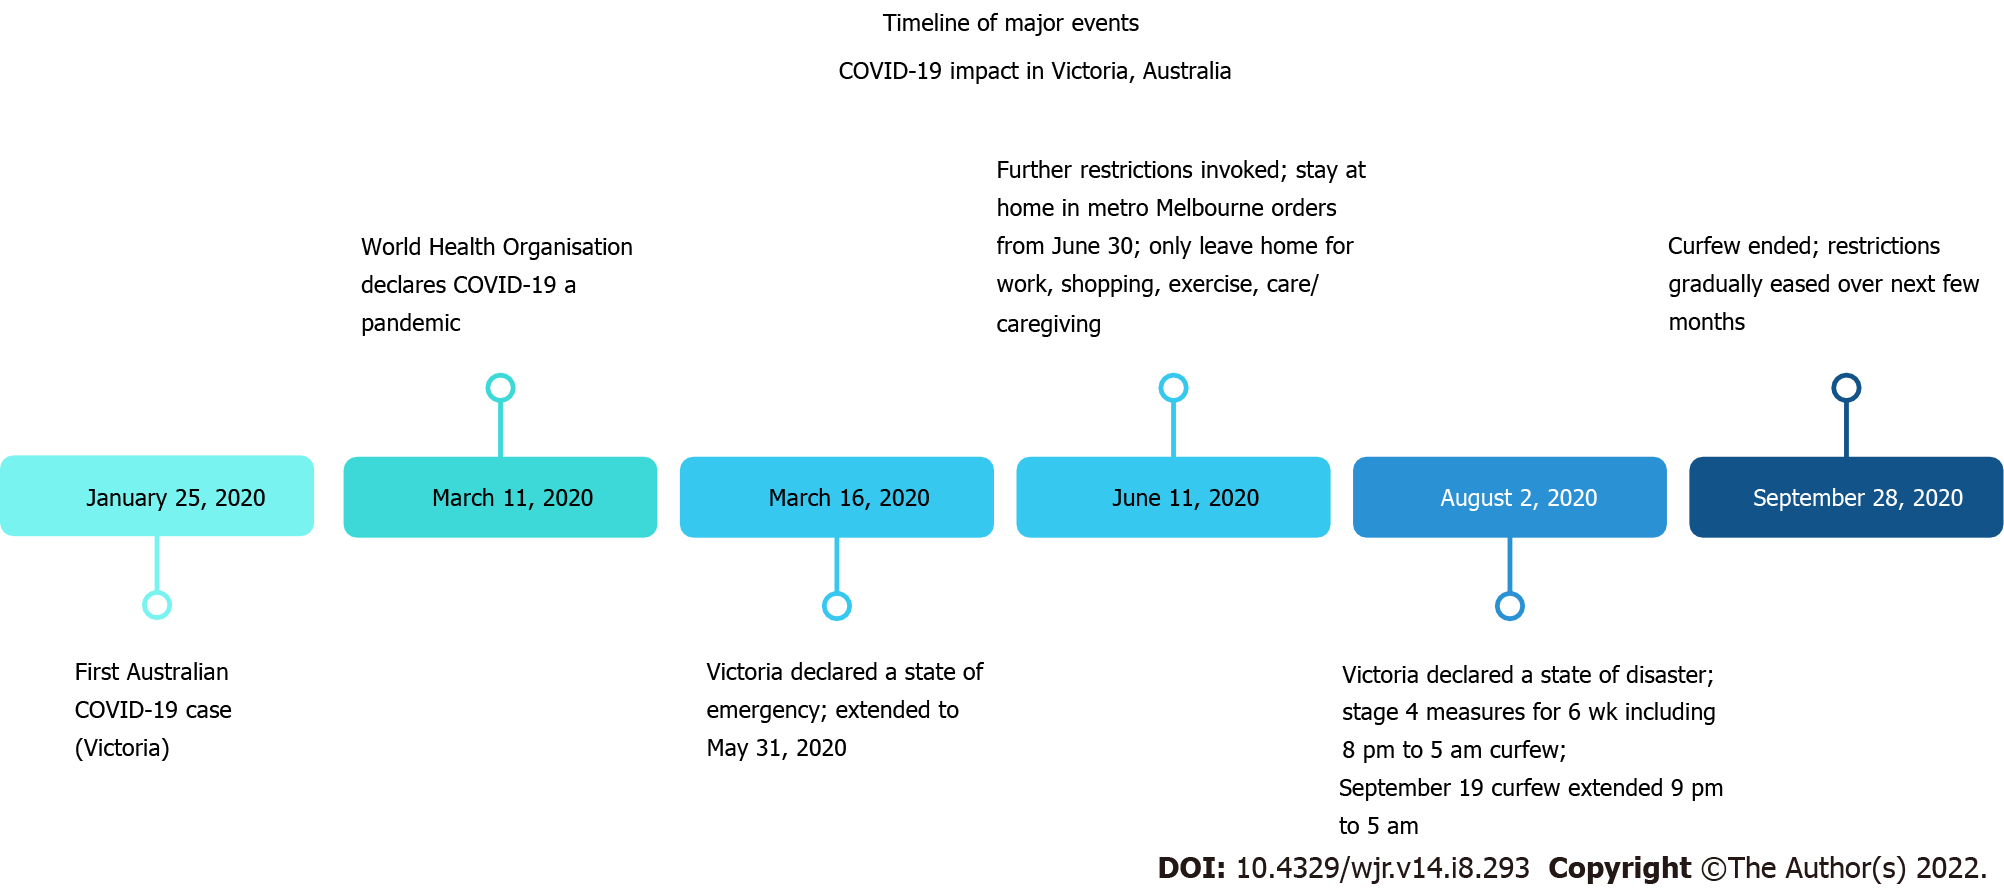
Figure 2 Timeline of significant events in Victoria, Australia during the first and second waves of the coronavirus disease 2019 pandemic.
COVID-19: The coronavirus disease 2019.
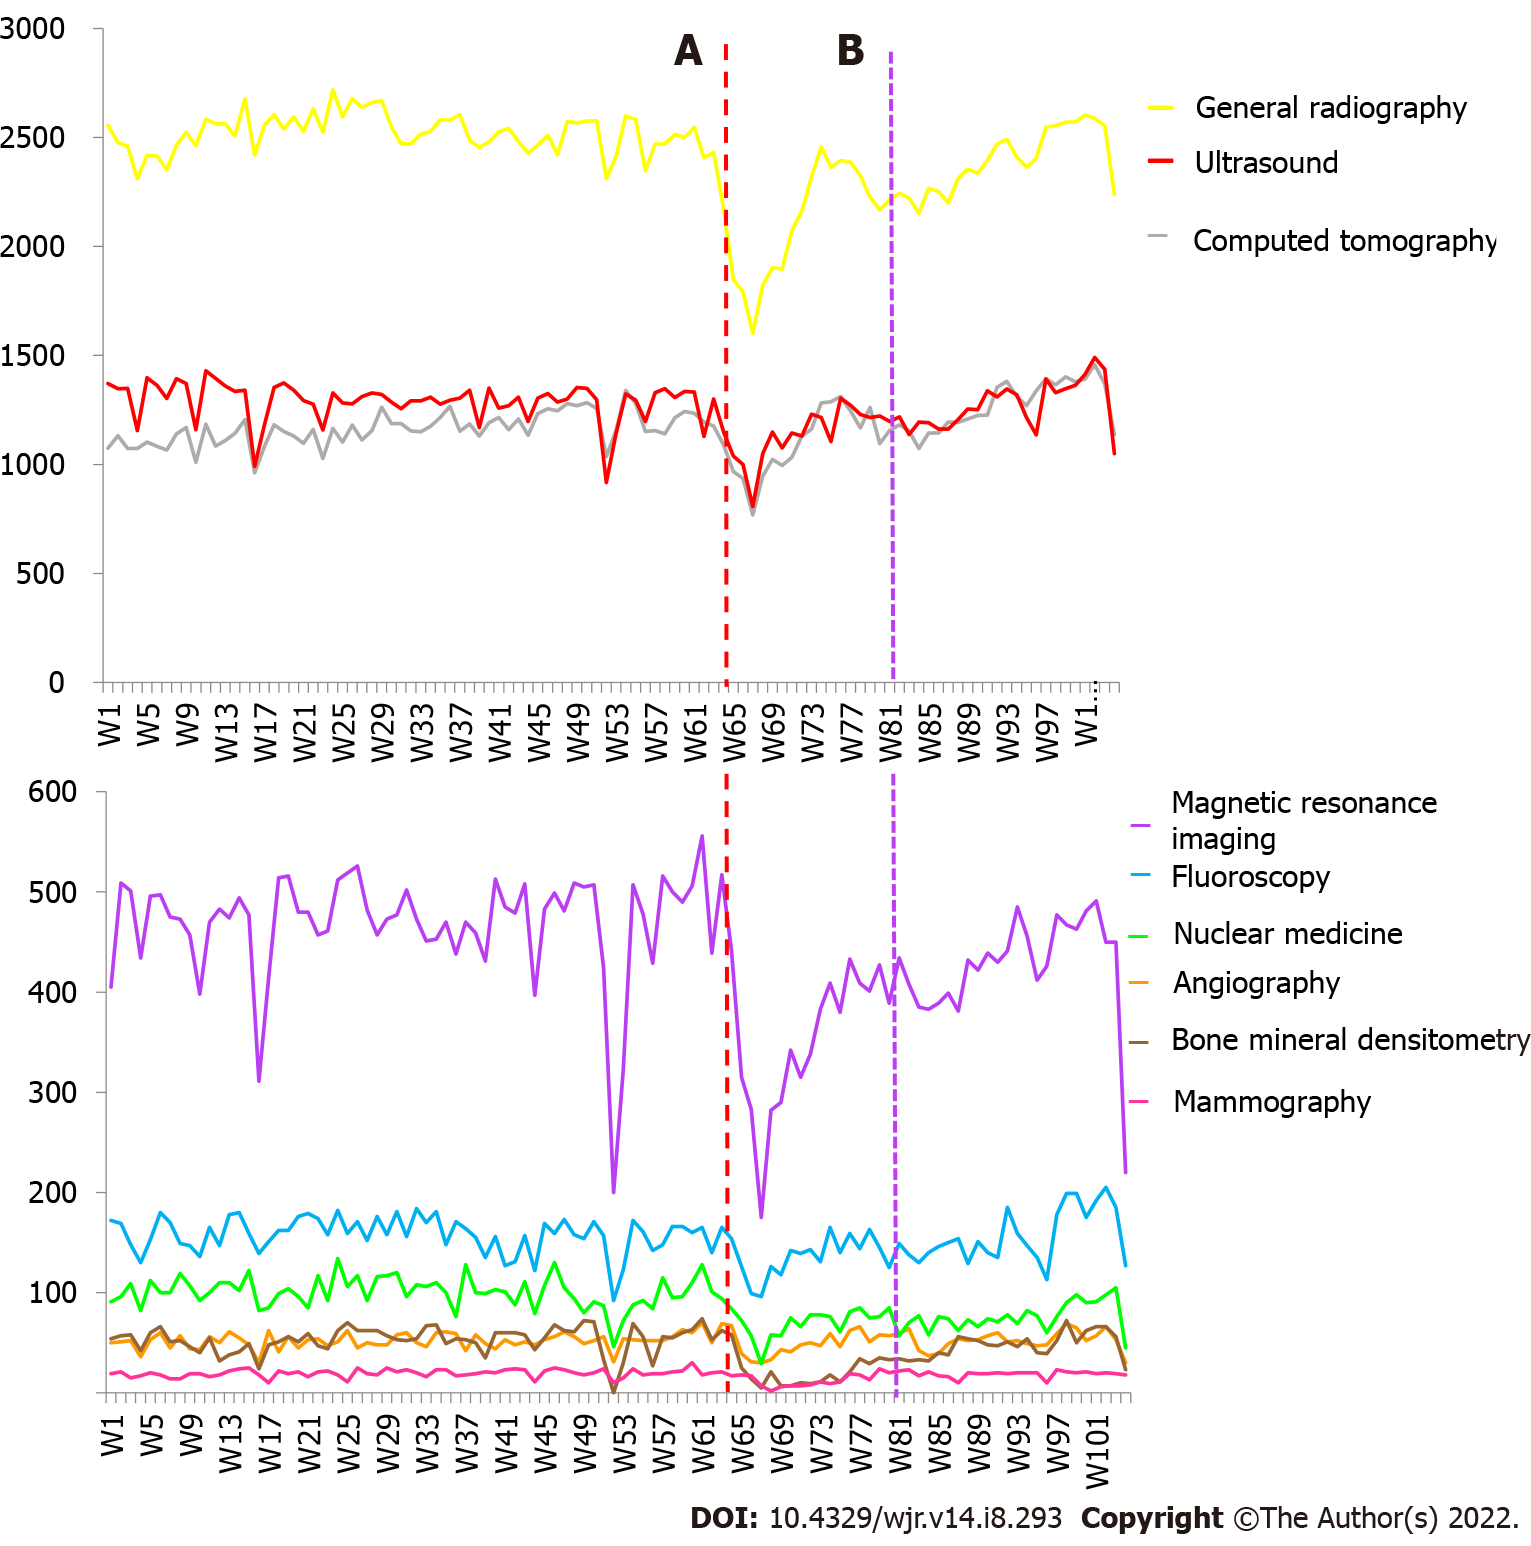
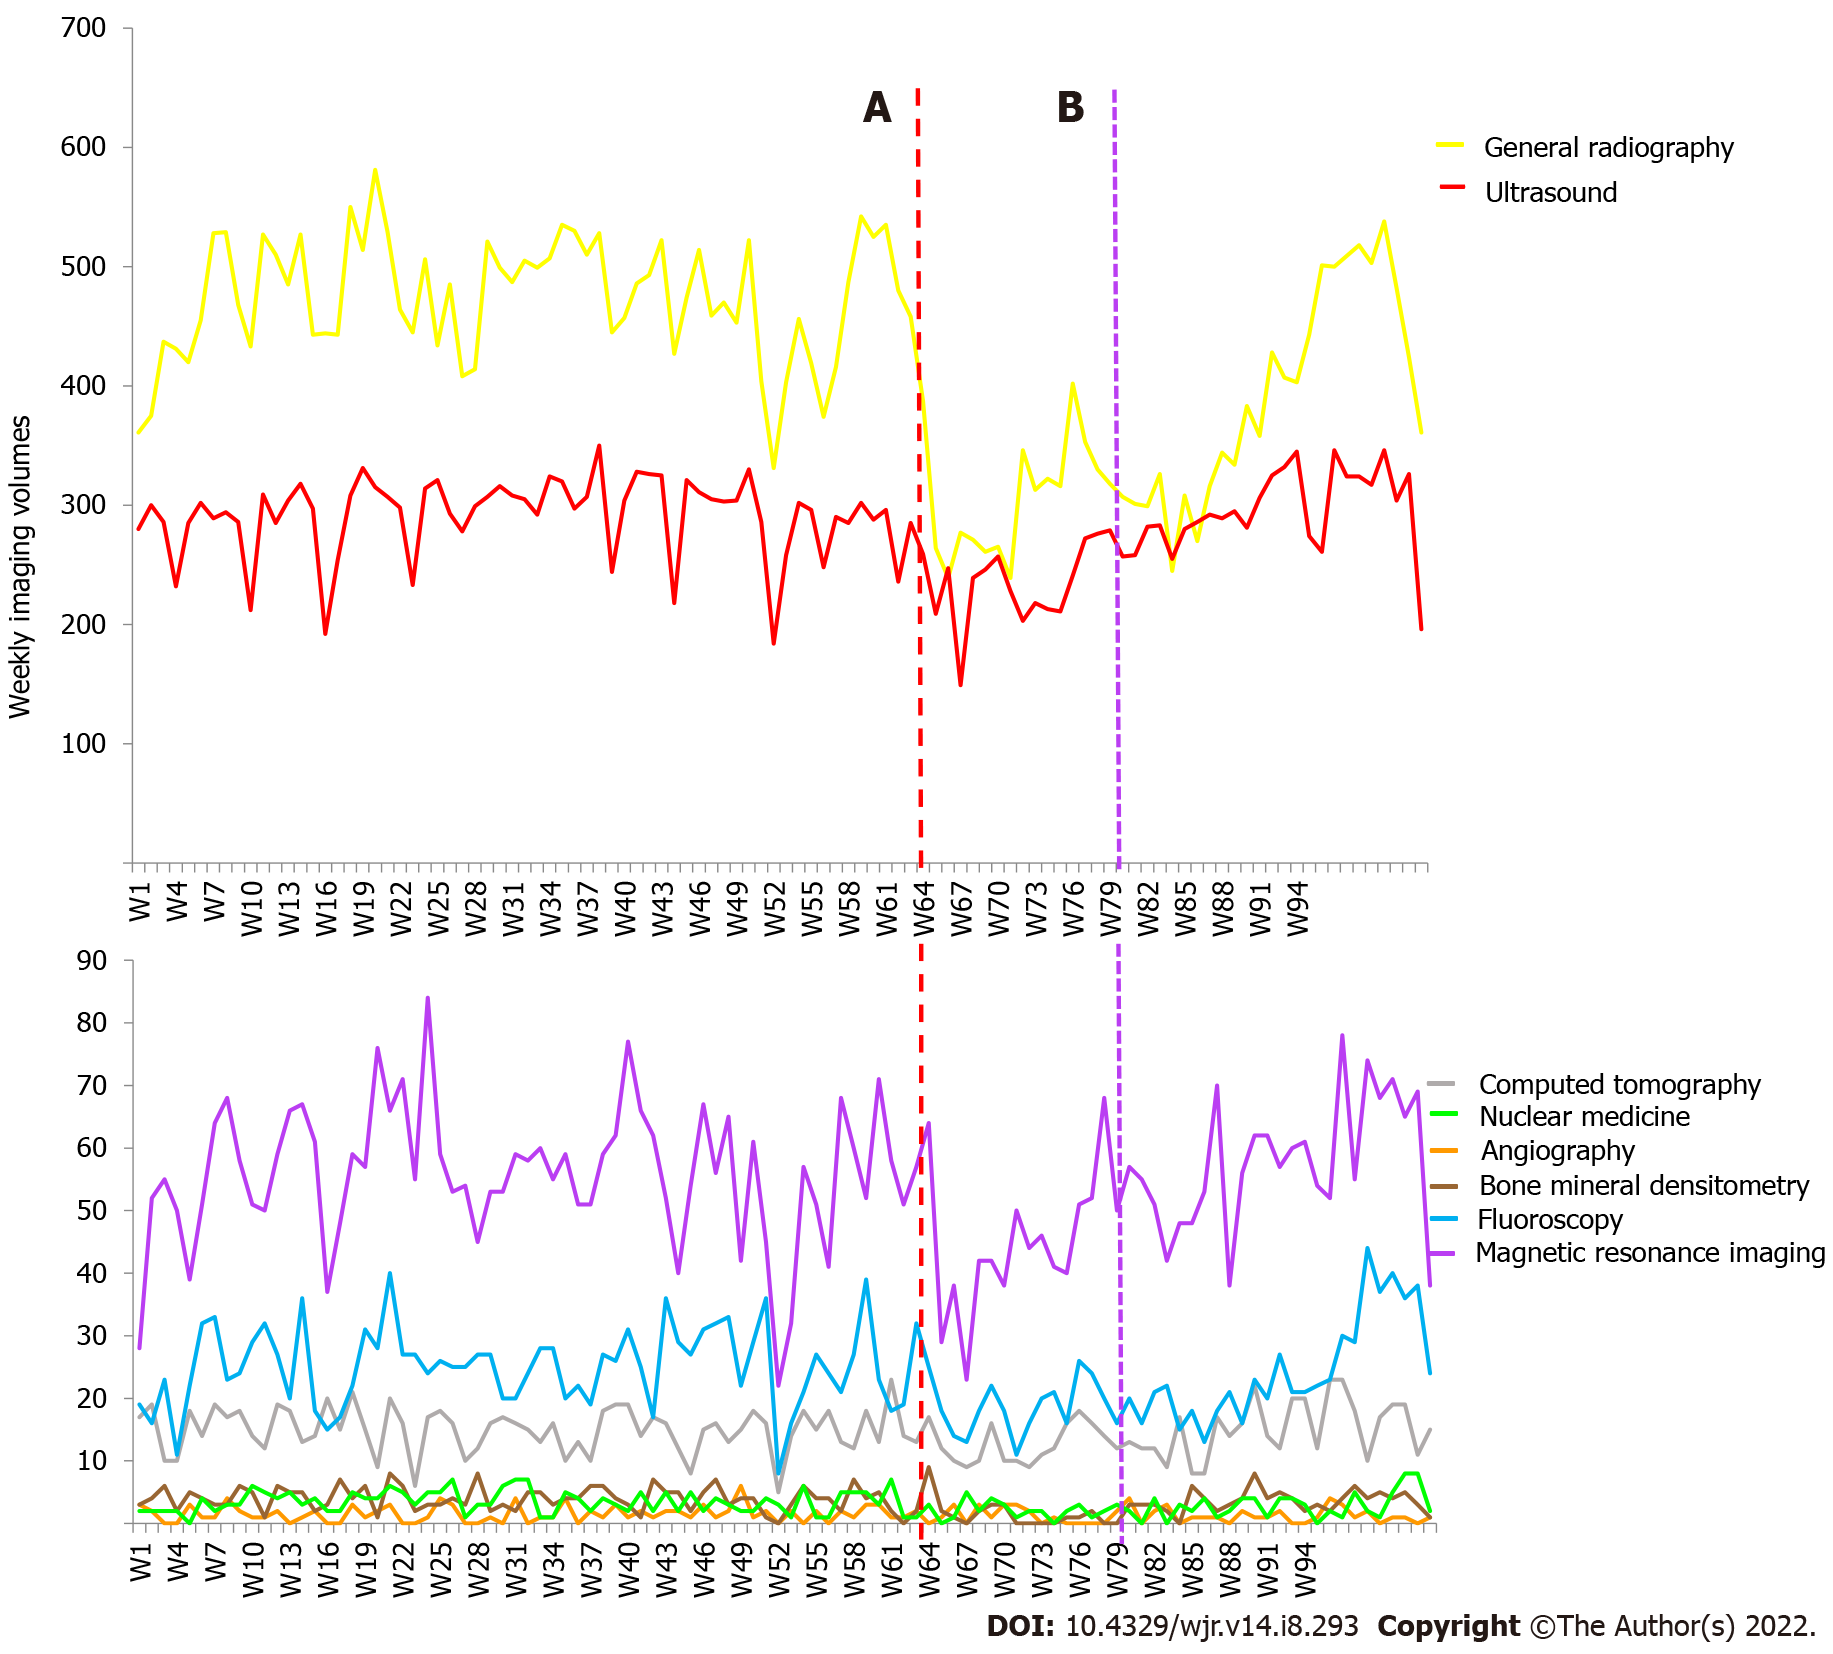
Figure 3 Weekly adult imaging volumes by modality from January 2019 to December 2020 (Weeks 1 to 104).
A: Week 63-commencement of first wave; B: Week 80-commencement of second wave.
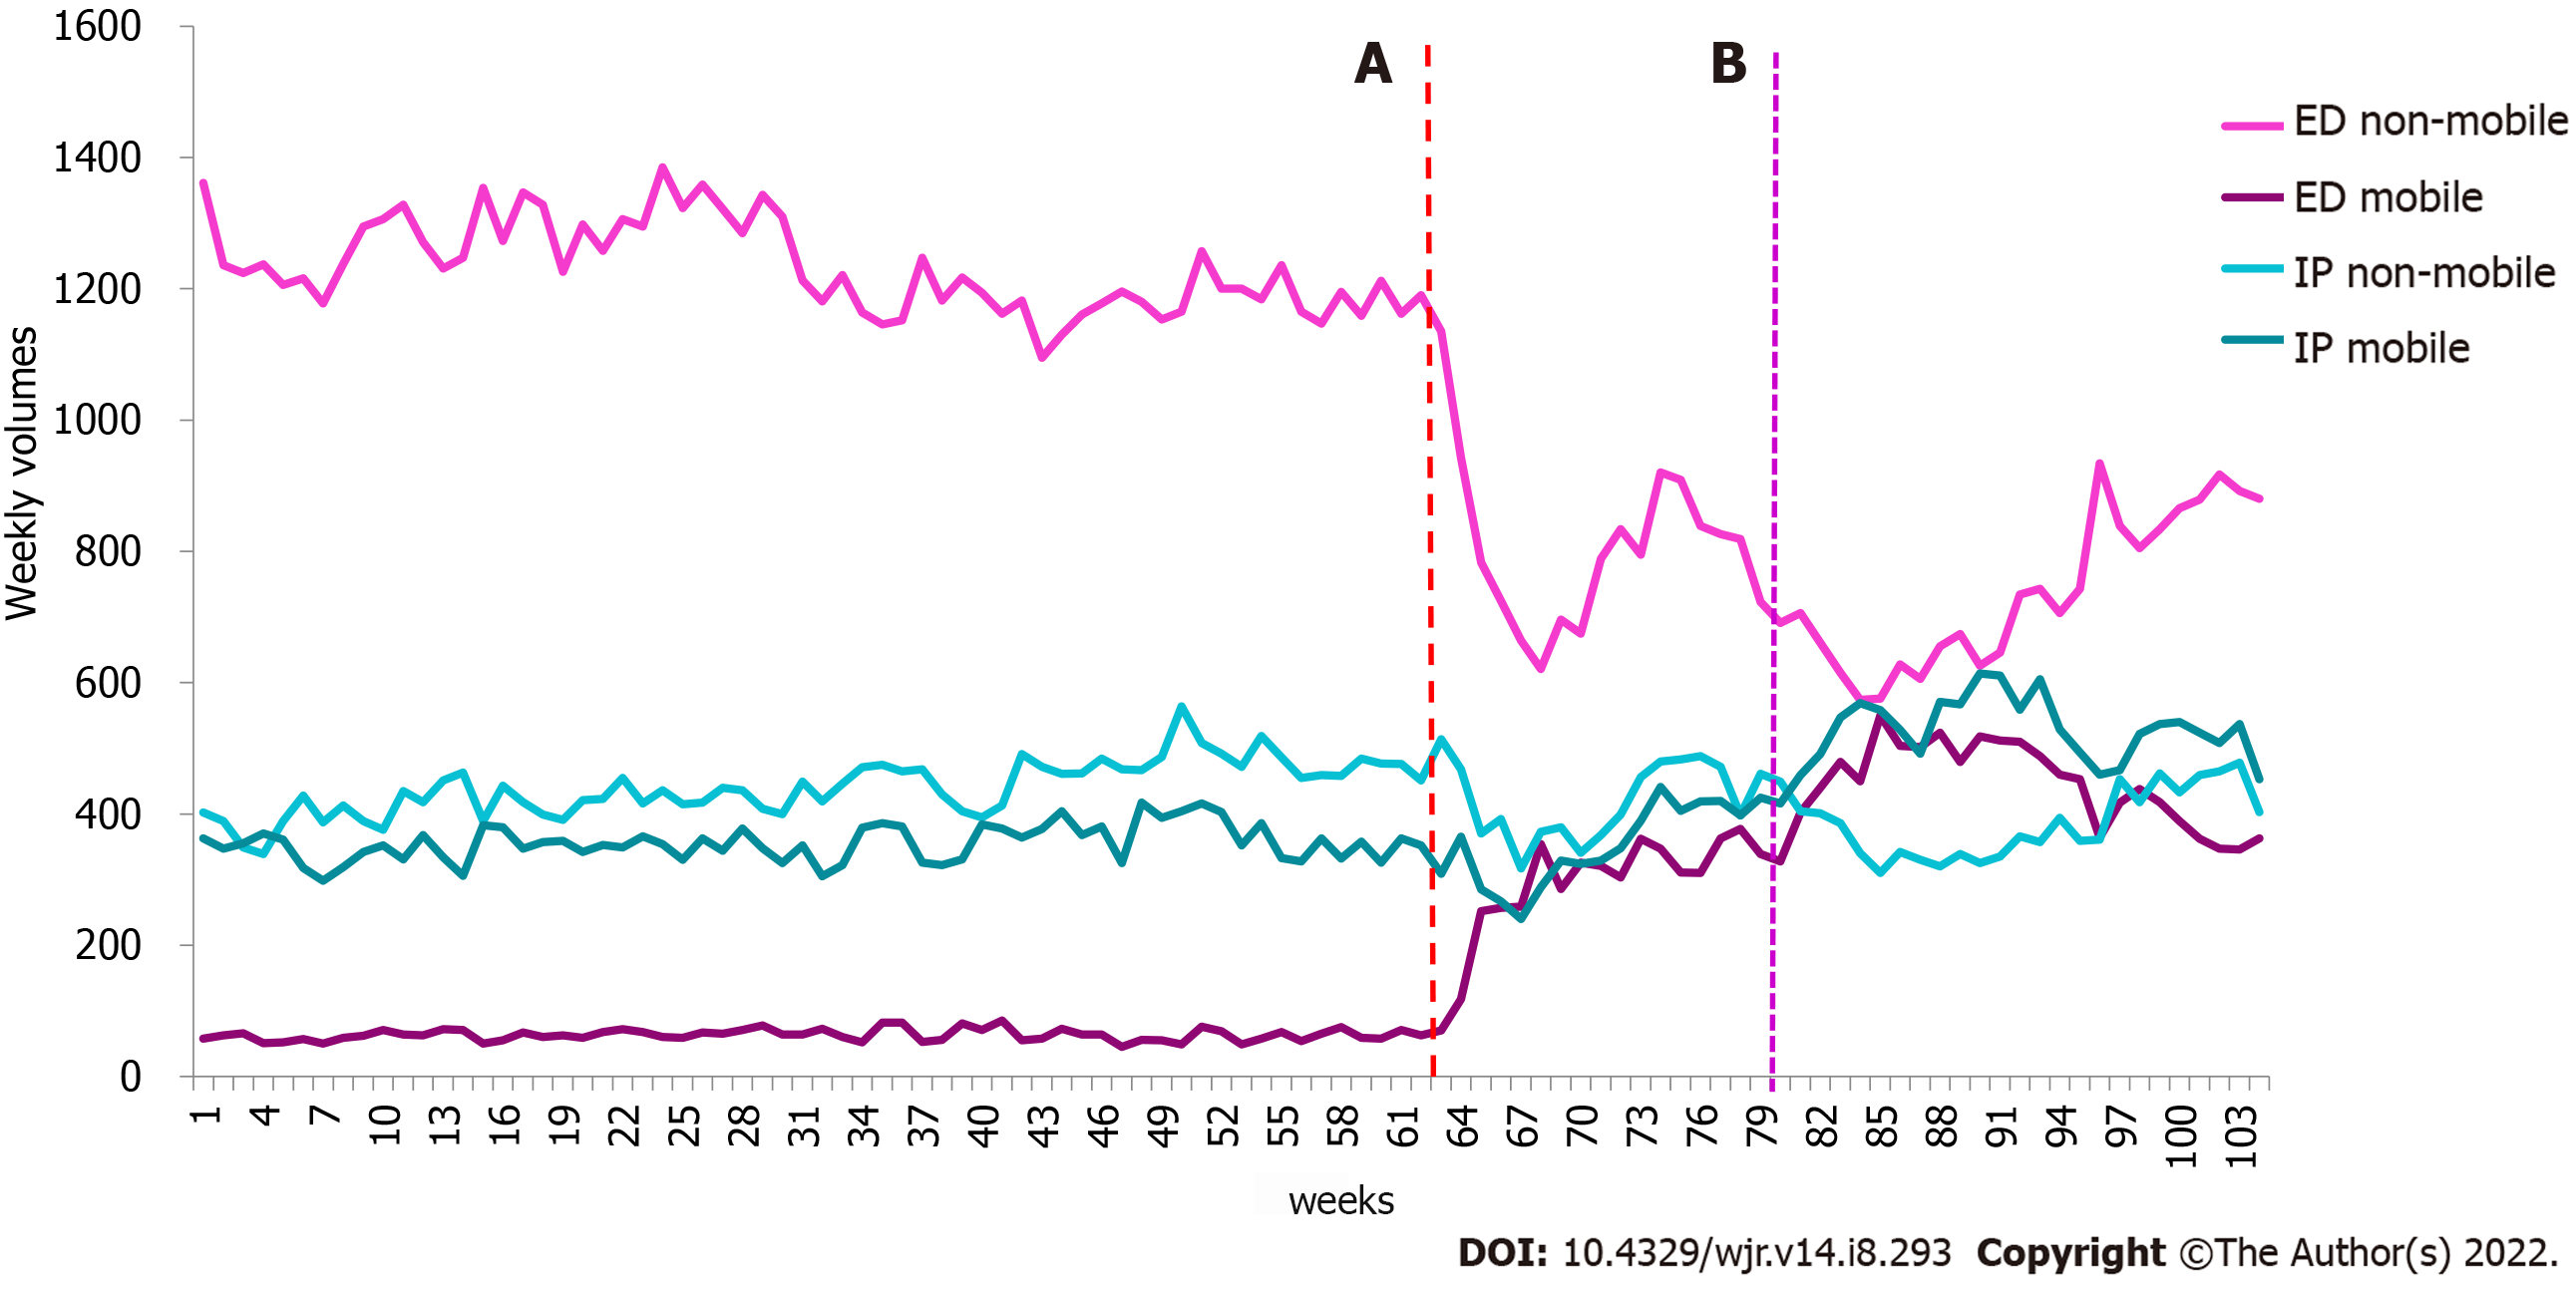
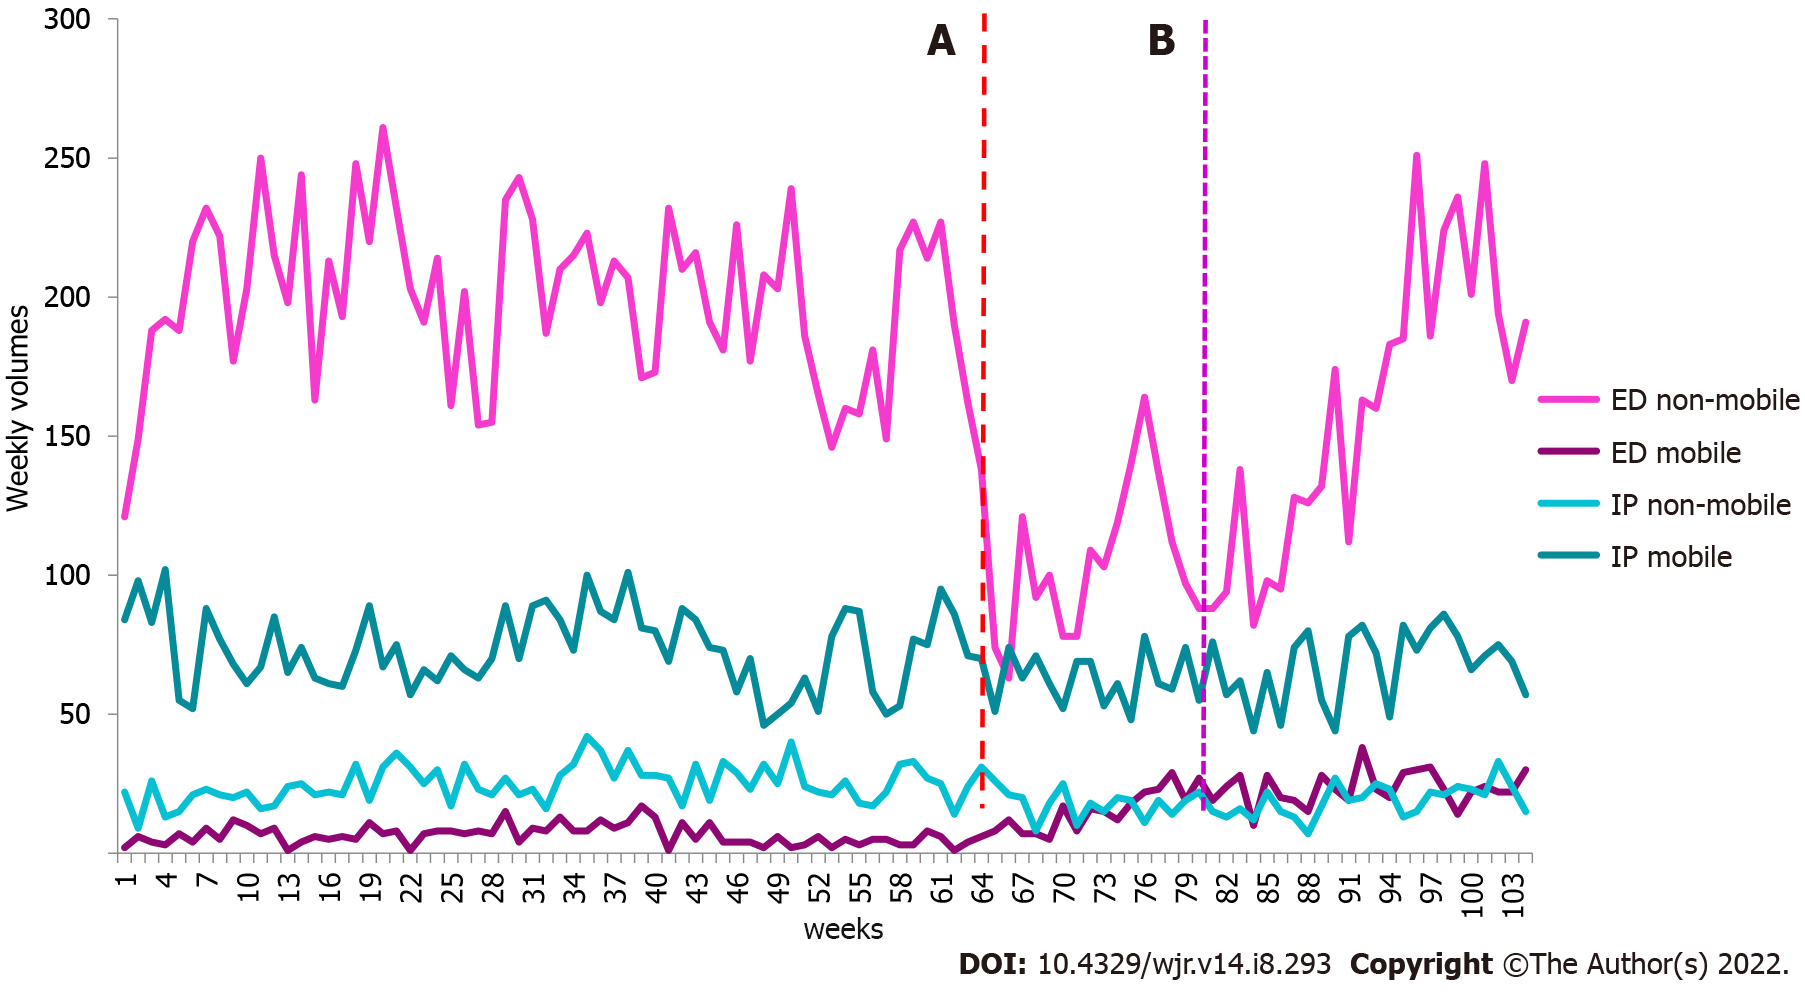
Figure 4 Weekly adult X-ray mobile and non-mobile imaging volumes from January 2019 to December 2020 (Weeks 1 to 104).
A: Week 63-commencement of first wave; B: Week 80 commencement of second wave. ED: Emergency department; IP: Inpatient.
Figure 5 Weekly paediatric imaging volumes by modality from January 2019 to December 2020 (Weeks 1 to 104).
A: Week 63-commencement of first wave; B: Week 80 commencement of second wave.
Figure 6 Weekly paediatric X-ray mobile and non-mobile imaging volumes from January 2019 to December 2020 (Weeks 1 to 104).
A: Week 63-commencement of first wave; B: Week 80 commencement of second wave. ED: Emergency department; IP: Inpatient.
- Citation: Pinson JA, Diep ML, Krishnan V, Aird C, Cooper C, Leong C, Chen J, Ardley N, Paul E, Badawy MK. Imaging volumes during COVID-19: A Victorian health service experience. World J Radiol 2022; 14(8): 293-310
- URL: https://www.wjgnet.com/1949-8470/full/v14/i8/293.htm
- DOI: https://dx.doi.org/10.4329/wjr.v14.i8.293


