Copyright
©The Author(s) 2022.
World J Radiol. Jul 28, 2022; 14(7): 180-193
Published online Jul 28, 2022. doi: 10.4329/wjr.v14.i7.180
Published online Jul 28, 2022. doi: 10.4329/wjr.v14.i7.180
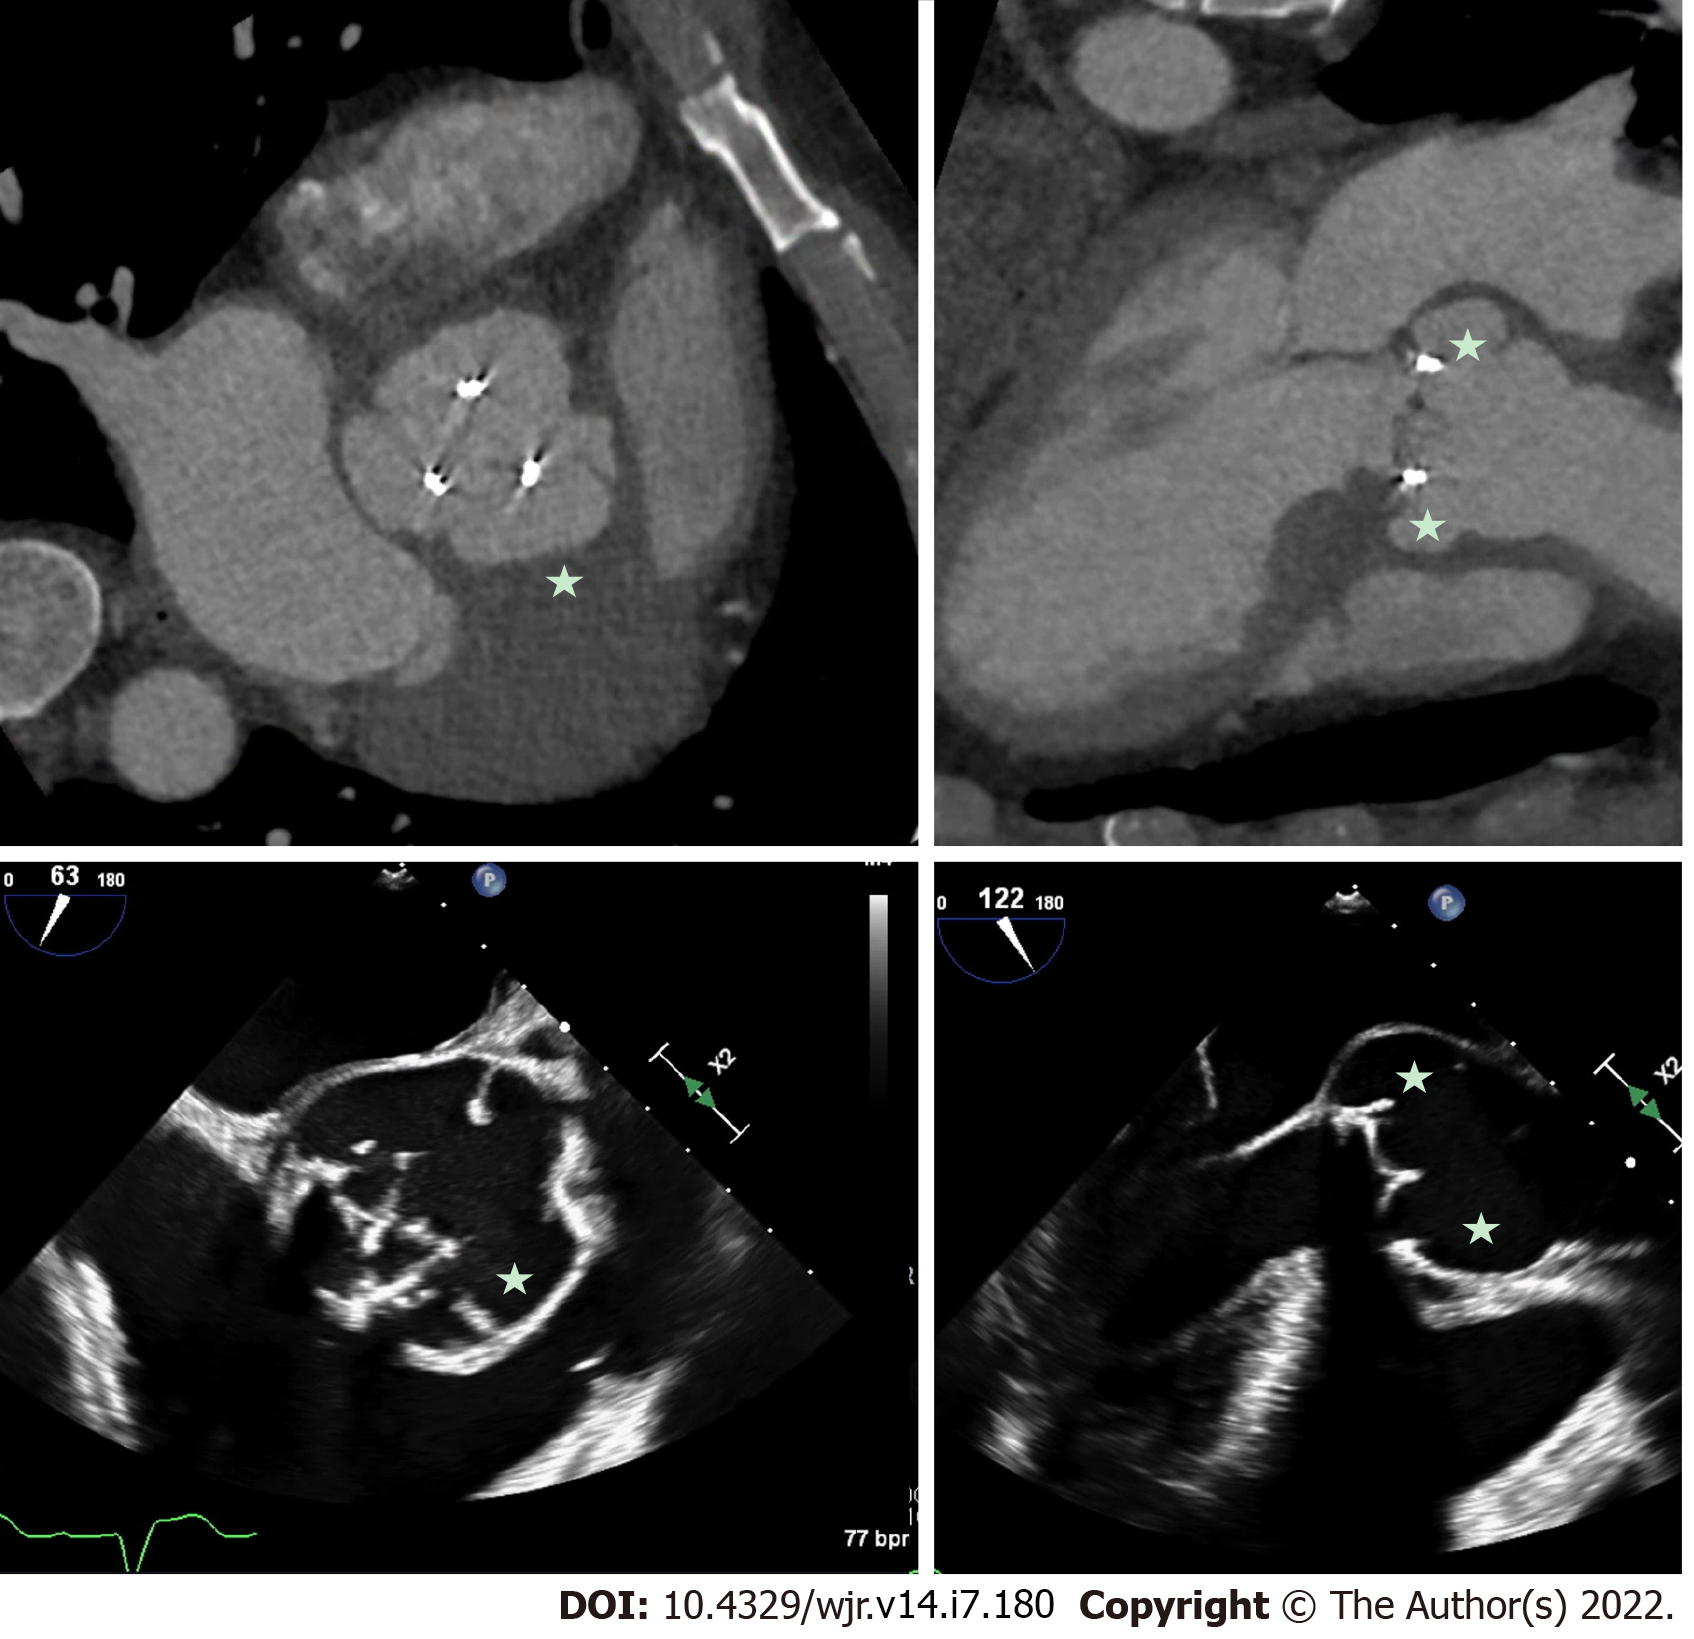
Figure 1 Prosthetic aortic valve infective endocarditis with valve dehiscence and pseudoaneurysm.
Patient with extensive peri-aortic root abscess cavity/pseudo-aneurysm (stars) related to prosthetic valve endocarditis. Note the extensive peri-valvular space around the prosthetic aortic valve and evidence of valve dehiscence on transesophageal echocardiography. Comparable short-axis and long-axis images from cardiac computed tomography and short-axis and long-axis images from transesophageal echocardiography.
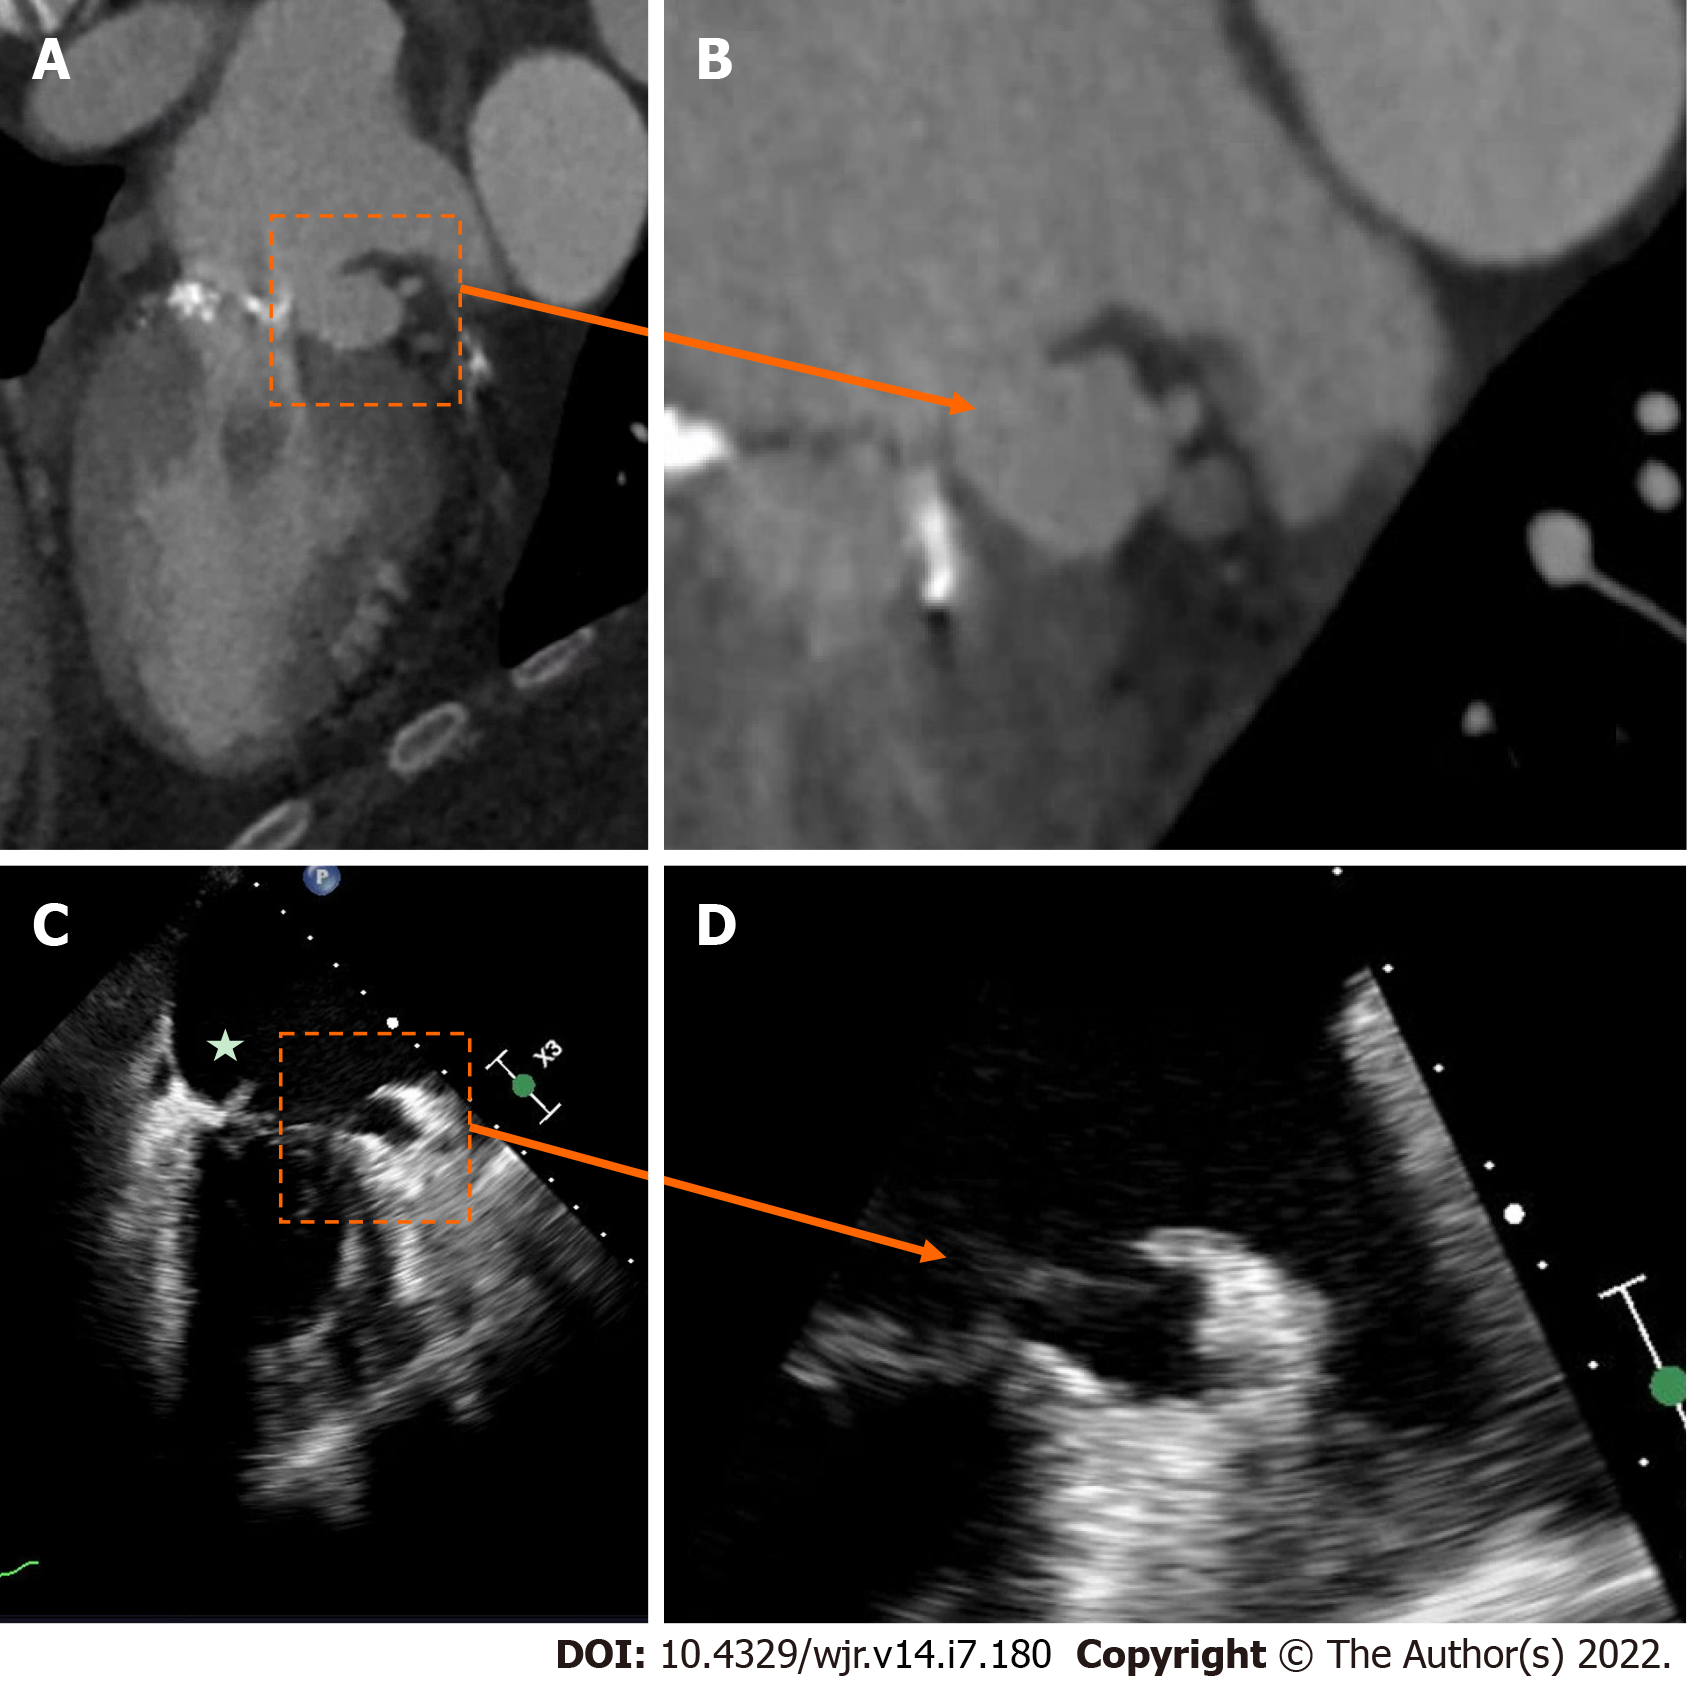
Figure 2 Native mitral valve infective endocarditis with pseudoaneurysm.
A and B: Mitral annular pseudo-aneurysm (dotted box) detected on cardiac computed tomography; C: Cardiac computed tomography with evidence of native mitral valve endocarditis on transesophageal echocardiography (star); D: Cardiac computed tomography with a prominent peri-annular cavity, consistent with a mitral annular pseudo-aneurysm.
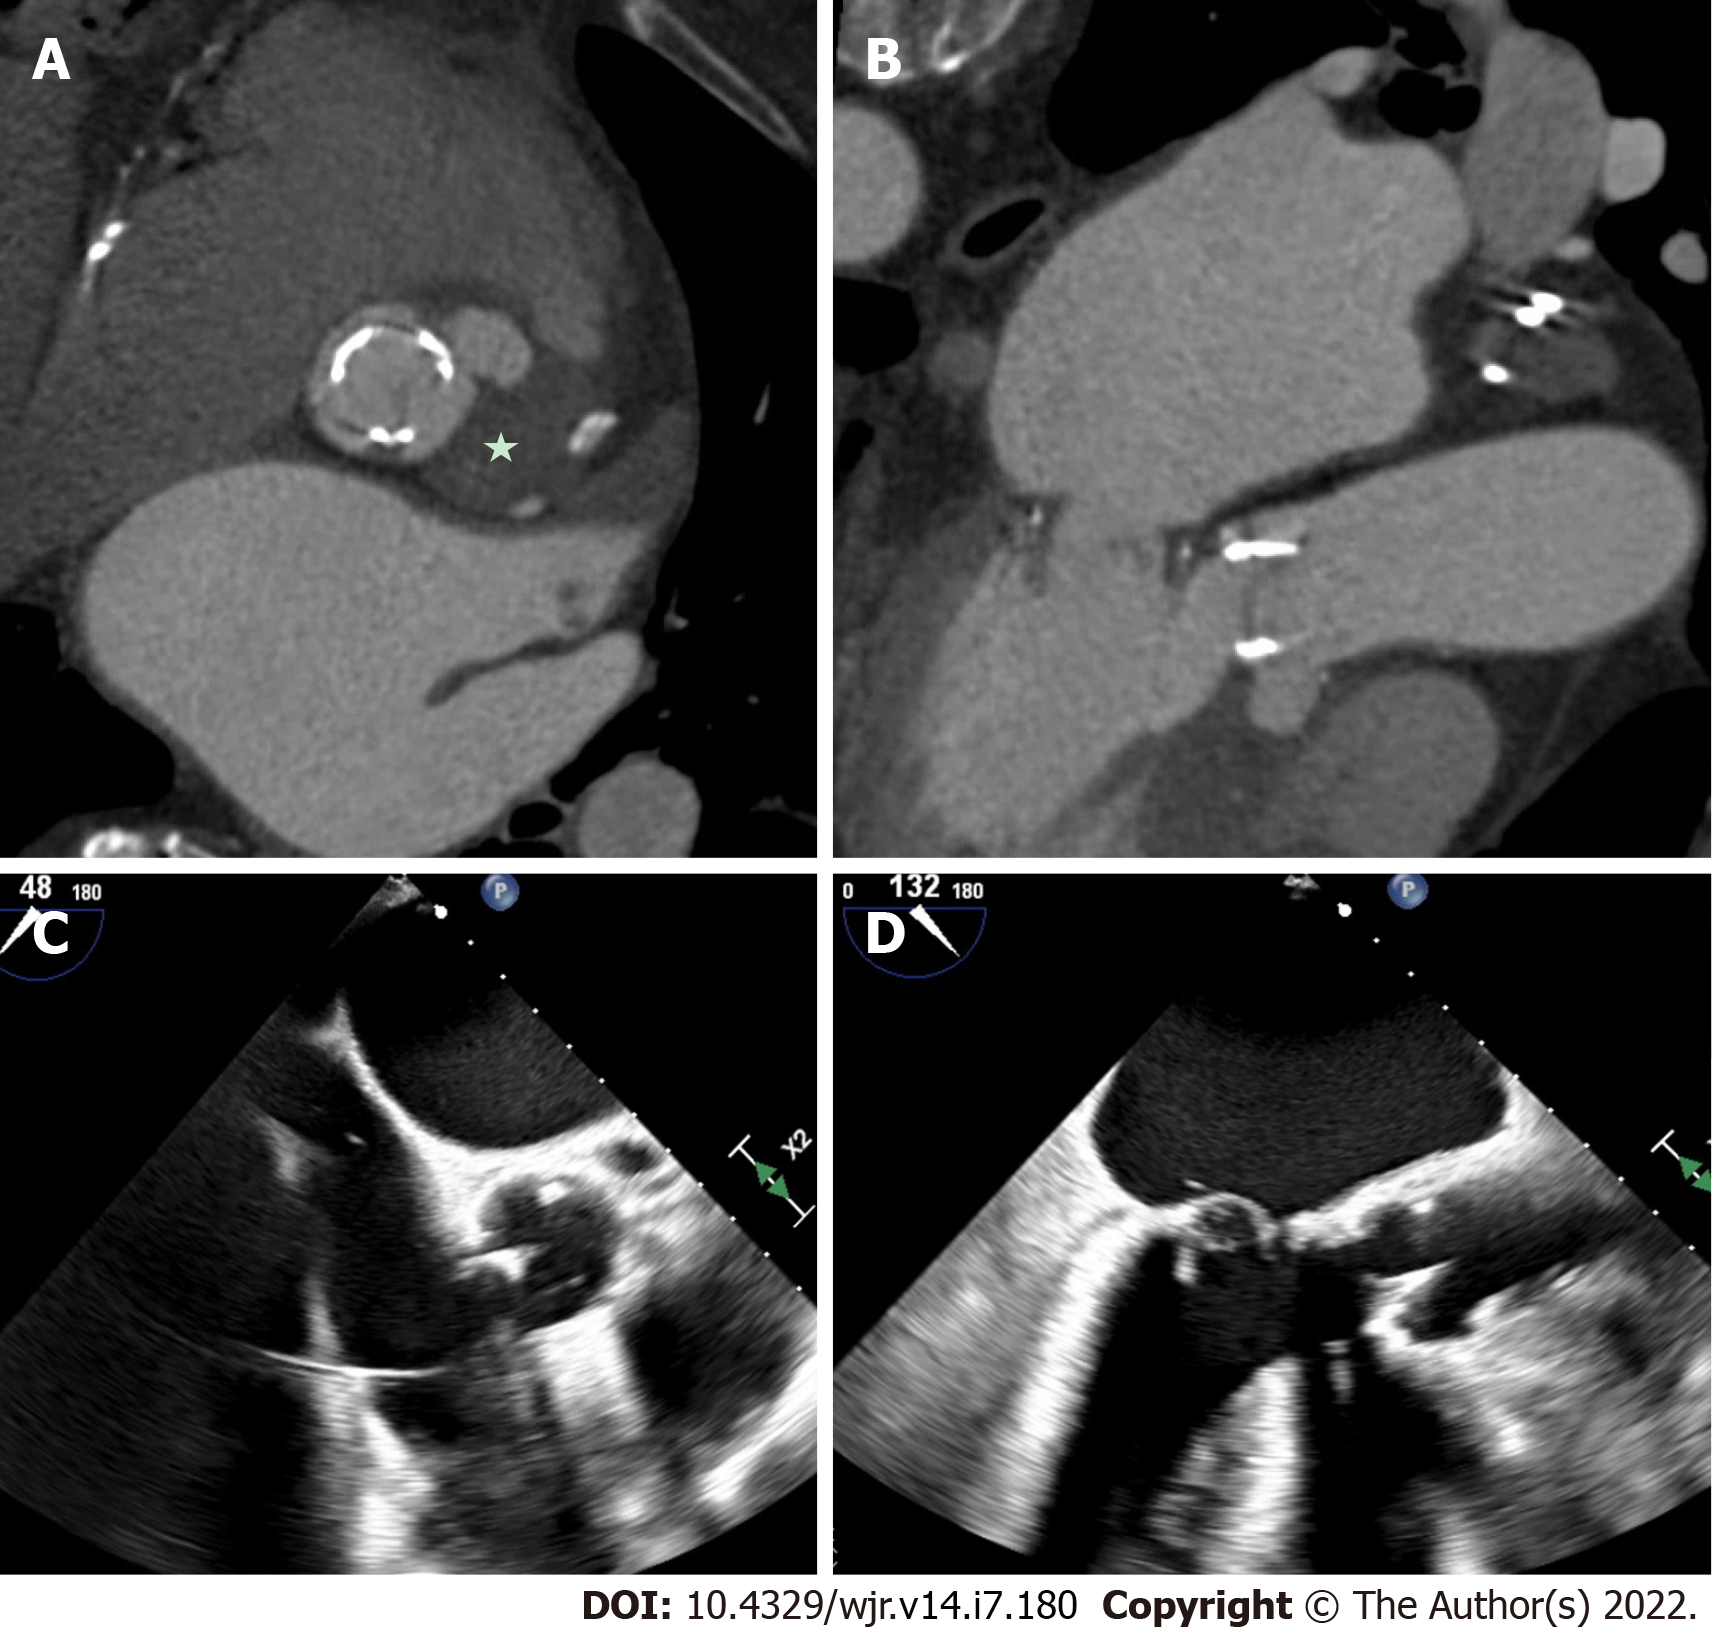
Figure 3 Mechanical aortic valve infective endocarditis with aortic root abscess.
A and B: Patient with extensive peri-aortic root abscess, with a contrast outpouching and surrounding soft-tissue density (star) nearly encasing the left main artery; C and D: Transesophageal echocardiography demonstrated similar findings, although not as well defined due to shadowing from the aortic valve prosthesis.
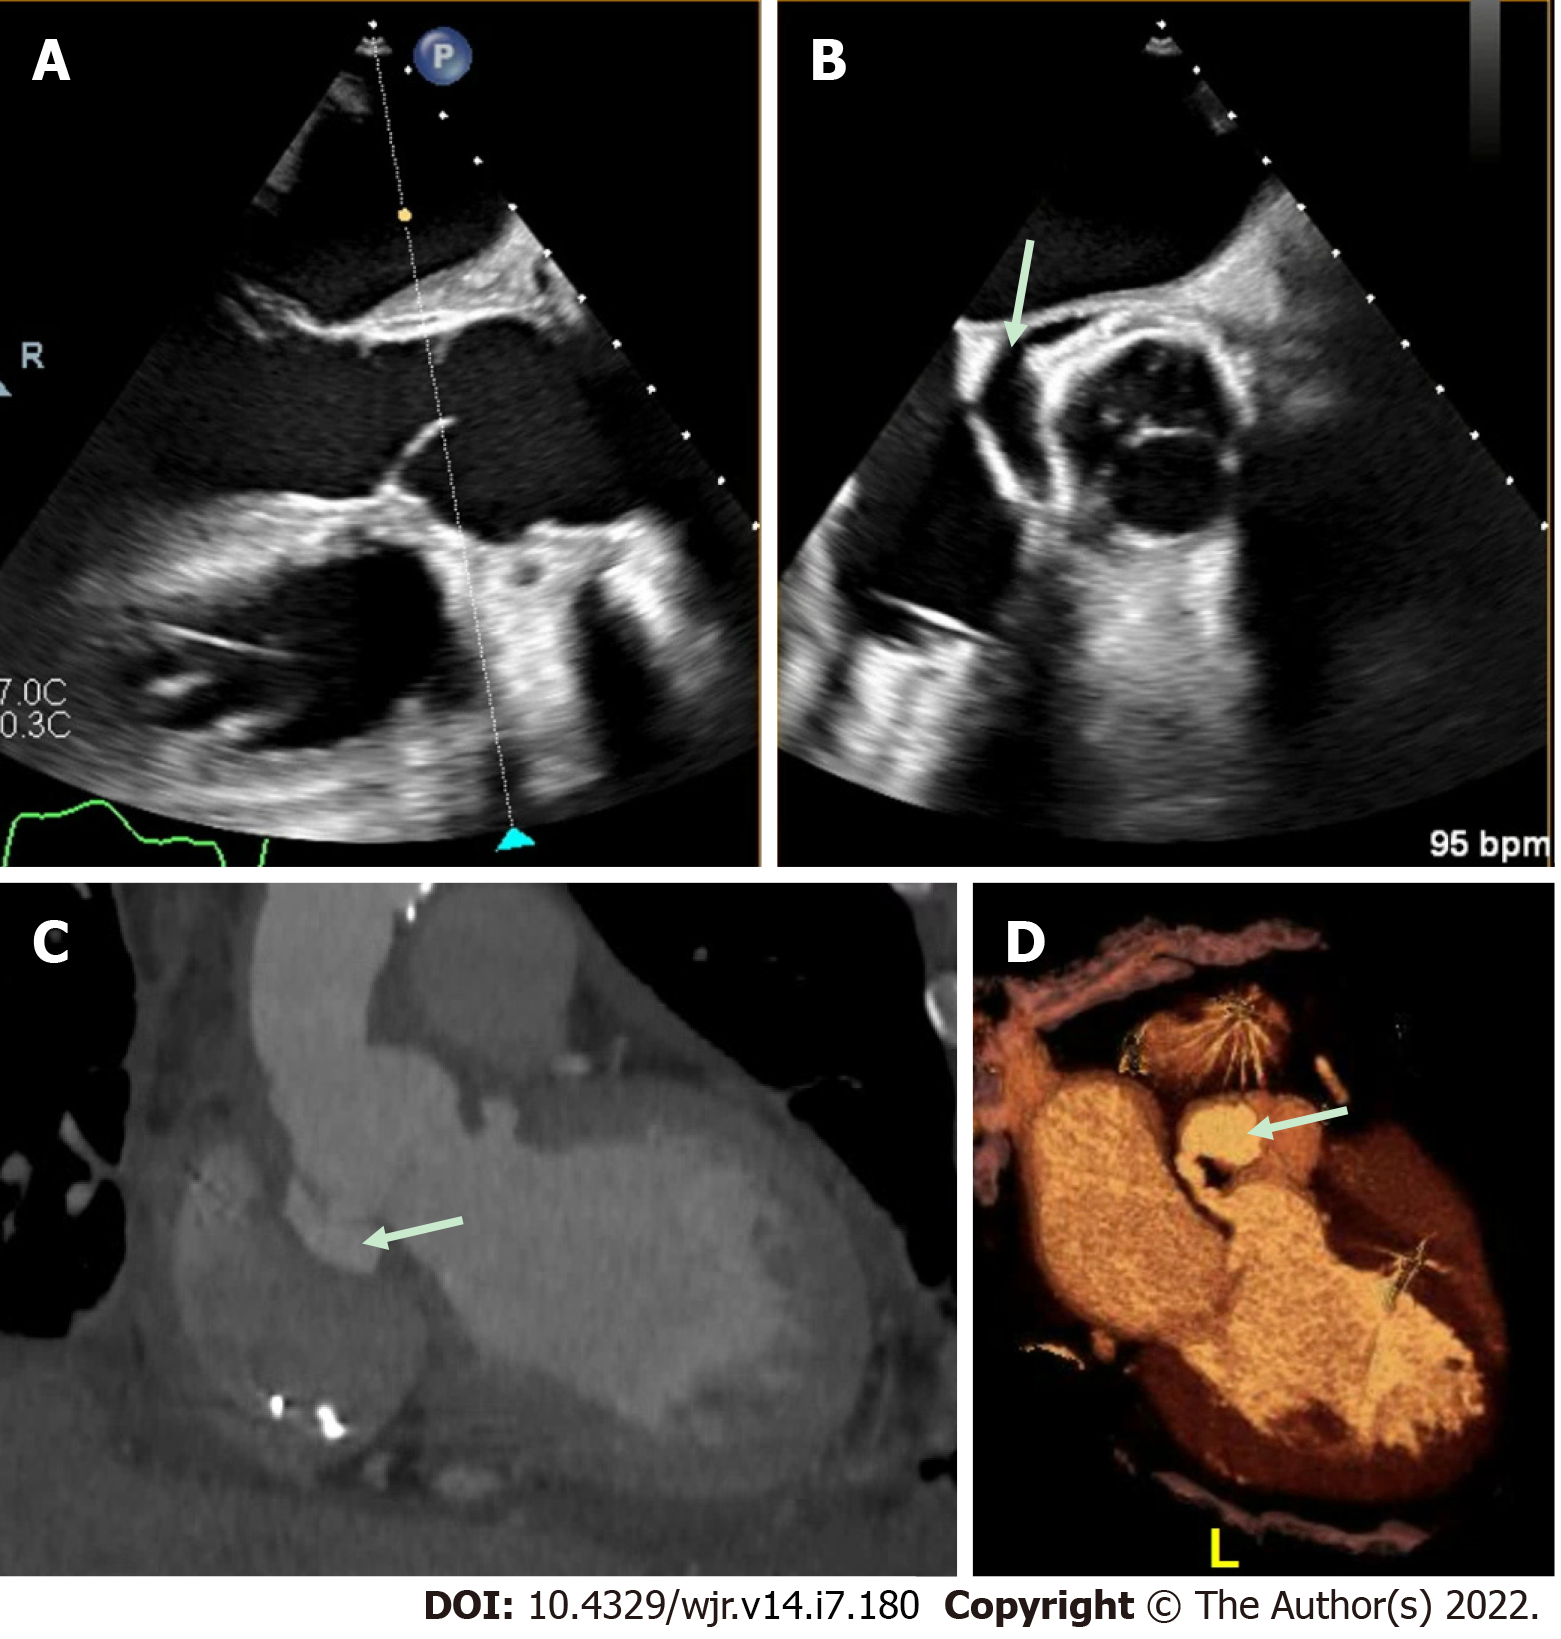
Figure 4 Aortic repair with left ventricular outflow tract pseudoaneurysm.
A and B: This patient had a complex aortic repair with a clear peri-valvular space (arrow) on transesophageal echocardiography (TEE); however, the exact origin was difficult to define by TEE imaging; C and D: Cardiac computed tomography demonstrated multiple pseudo-aneurysms arising from the left ventricular outflow tract (LVOT) with the largest, fistulous LVOT pseudo-aneurysm (arrow) best appreciated on 3-dimensional volume-rendering.
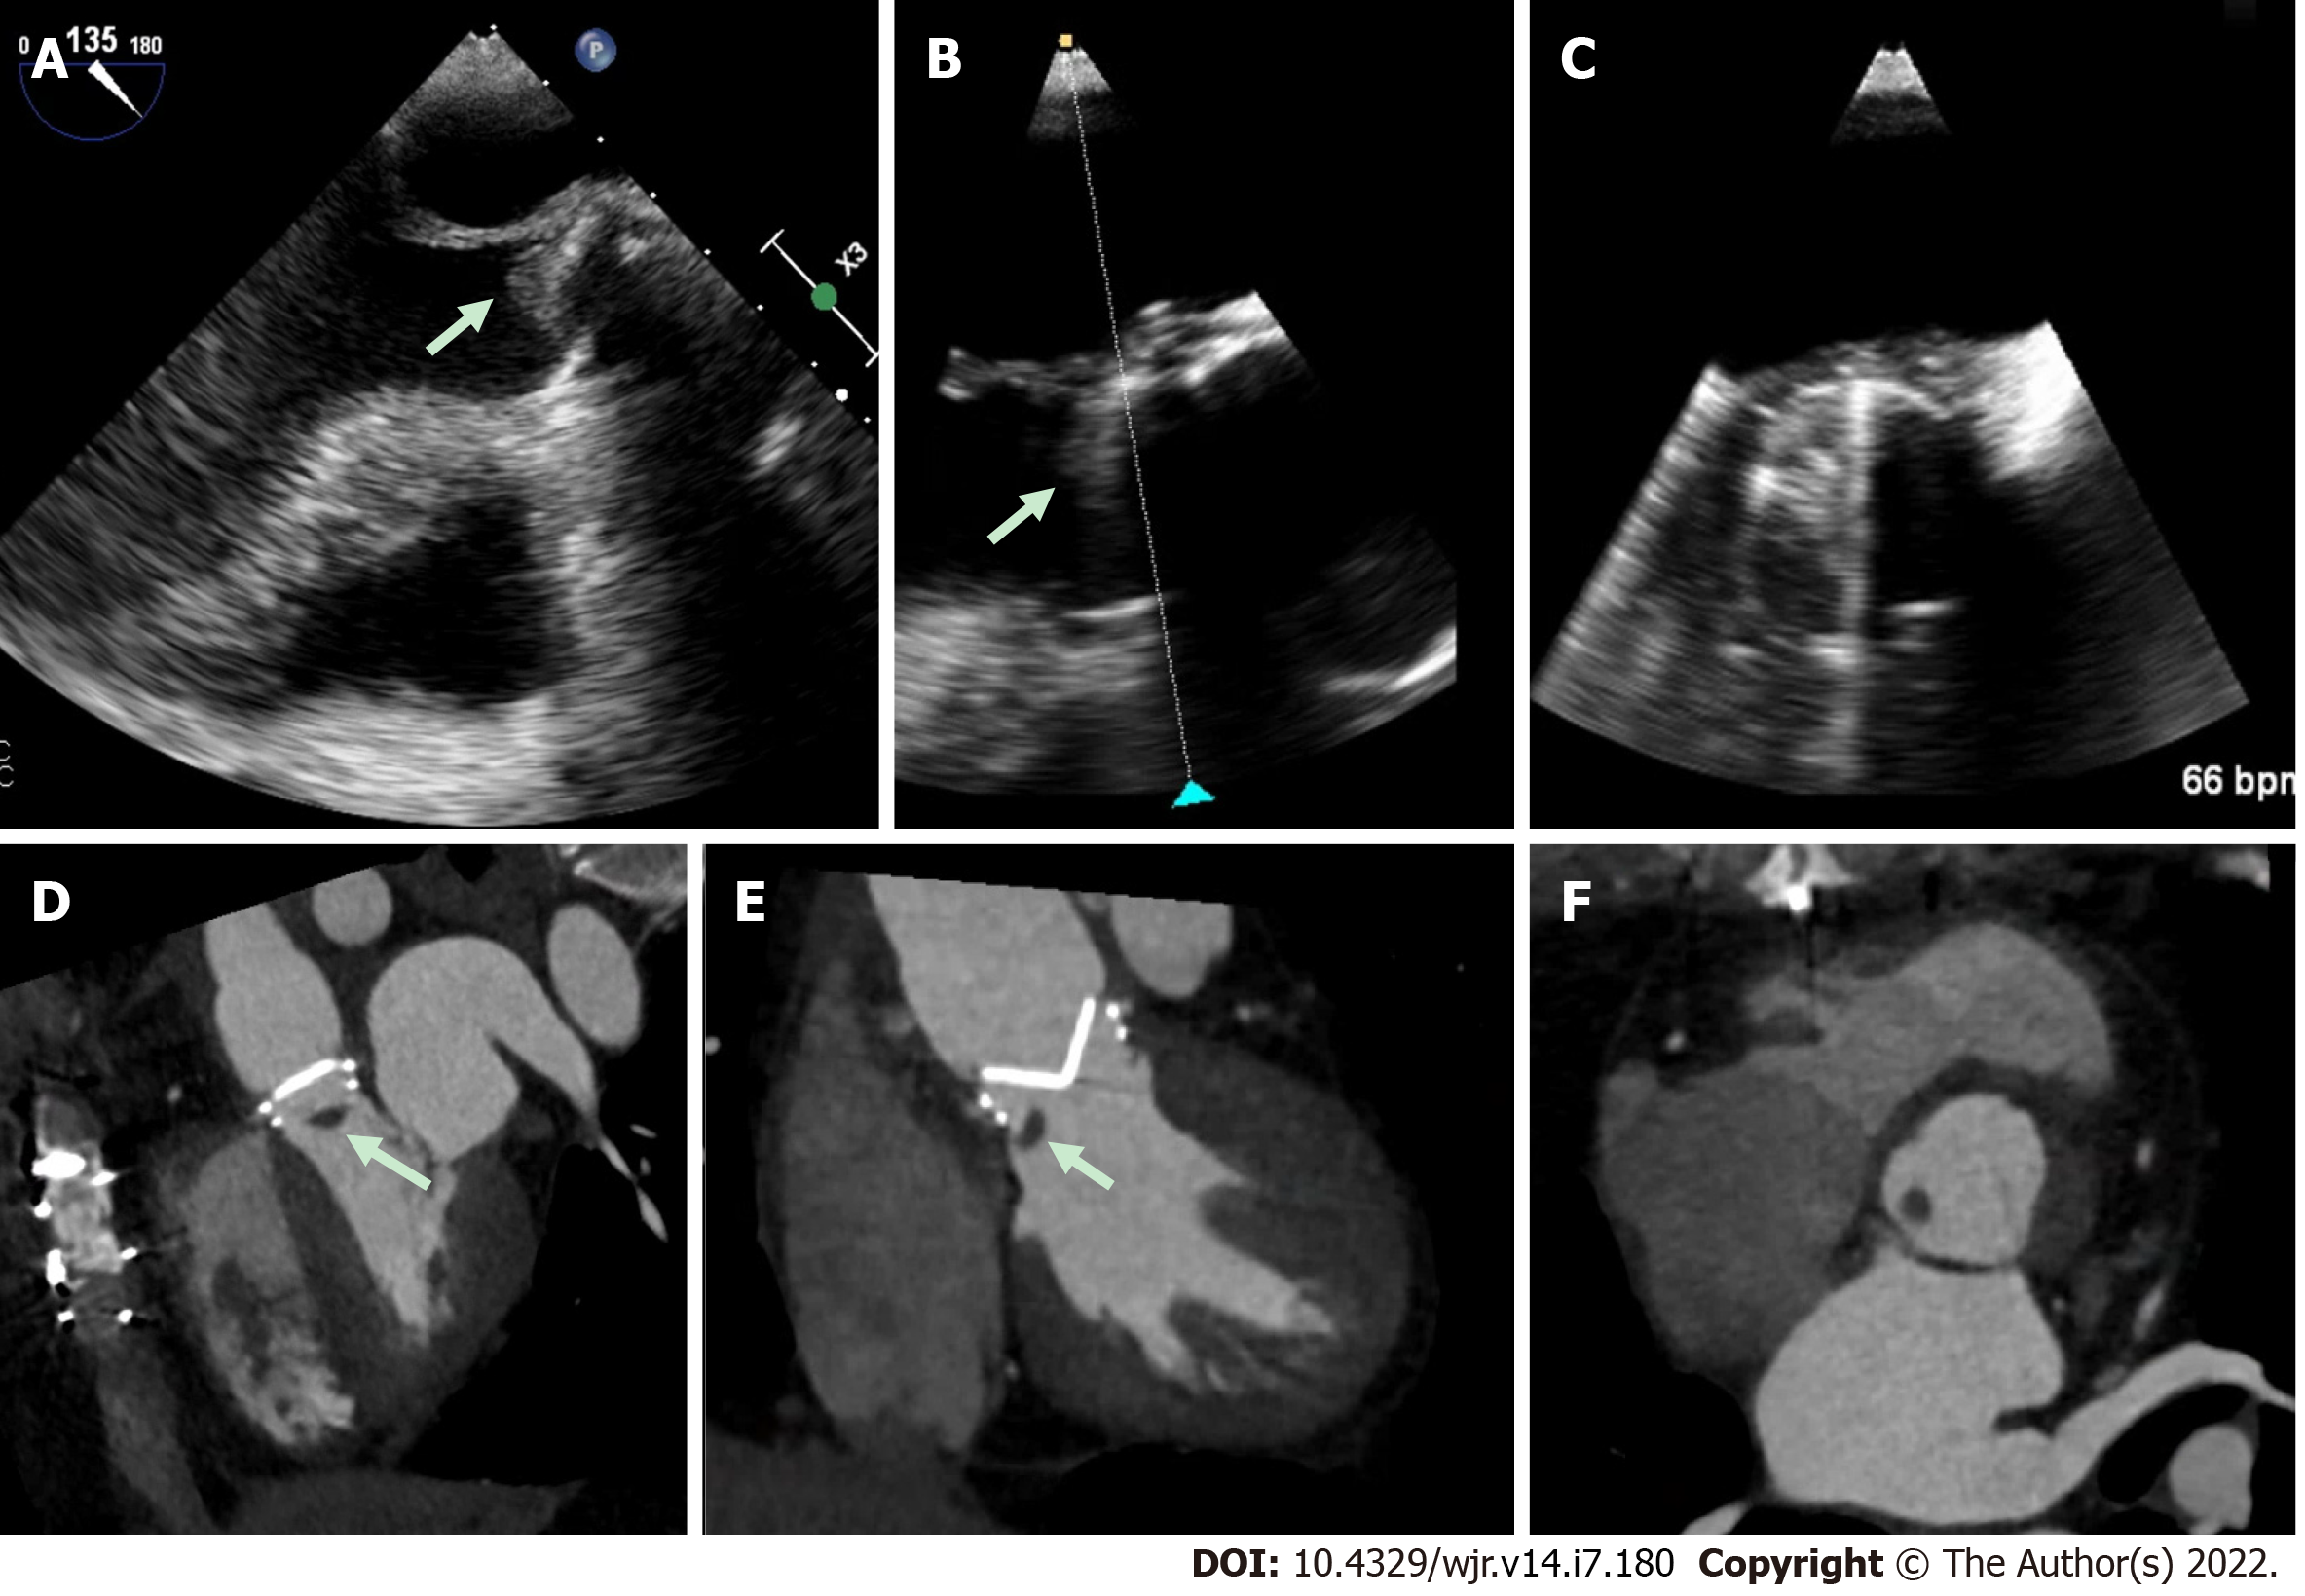
Figure 5 Prosthetic aortic valve with hypoattenuating lesion.
A-C: This patient presented with elevated prosthetic aortic valve gradients, and although transesophageal echocardiography imaging was suspicious for an echodensity (white arrow), imaging quality was challenging due to prosthetic metallic valve shadowing; D-F: Multi-phase 4-dimensional cardiac computed tomography was utilized which clearly demonstrated a hypoattenuating mass (white arrows) attached to the prosthetic valve. Despite suspicion for infection, intra-operative pathology revealed thrombus.
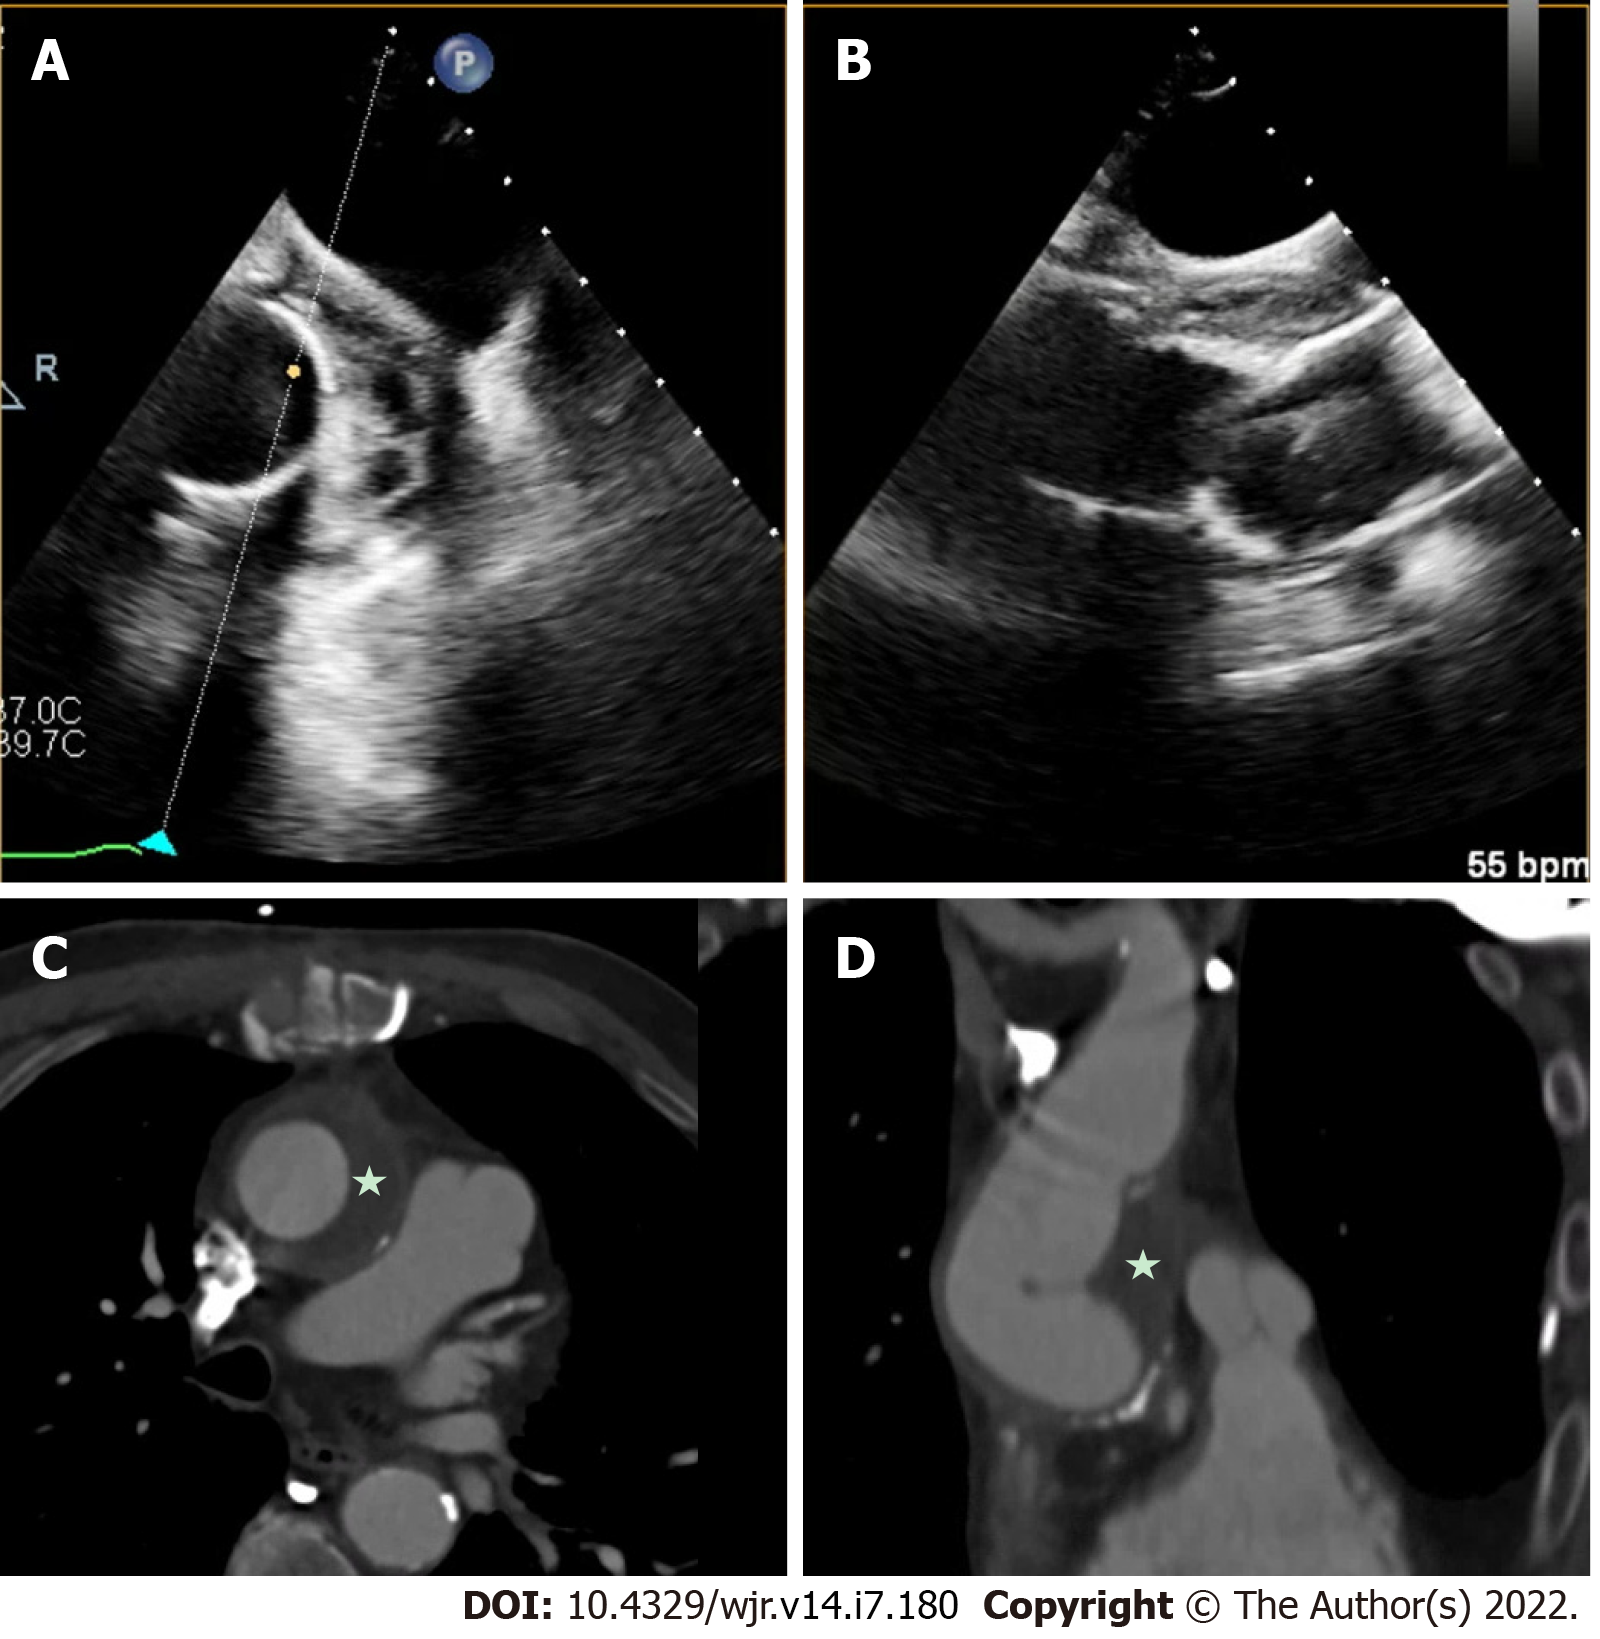
Figure 6 Aortic graft infection.
A and B: Infection of aortic grafts can be difficult to visualize on transesophageal echocardiography (TEE); C and D: This case demonstrates evidence of a peri-aortic graft echolucent space with stranding, which was challenging to image on TEE, and further characterization with cardiac computed tomography clearly demonstrated peri-aortic graft thickening (star) consistent with infection.
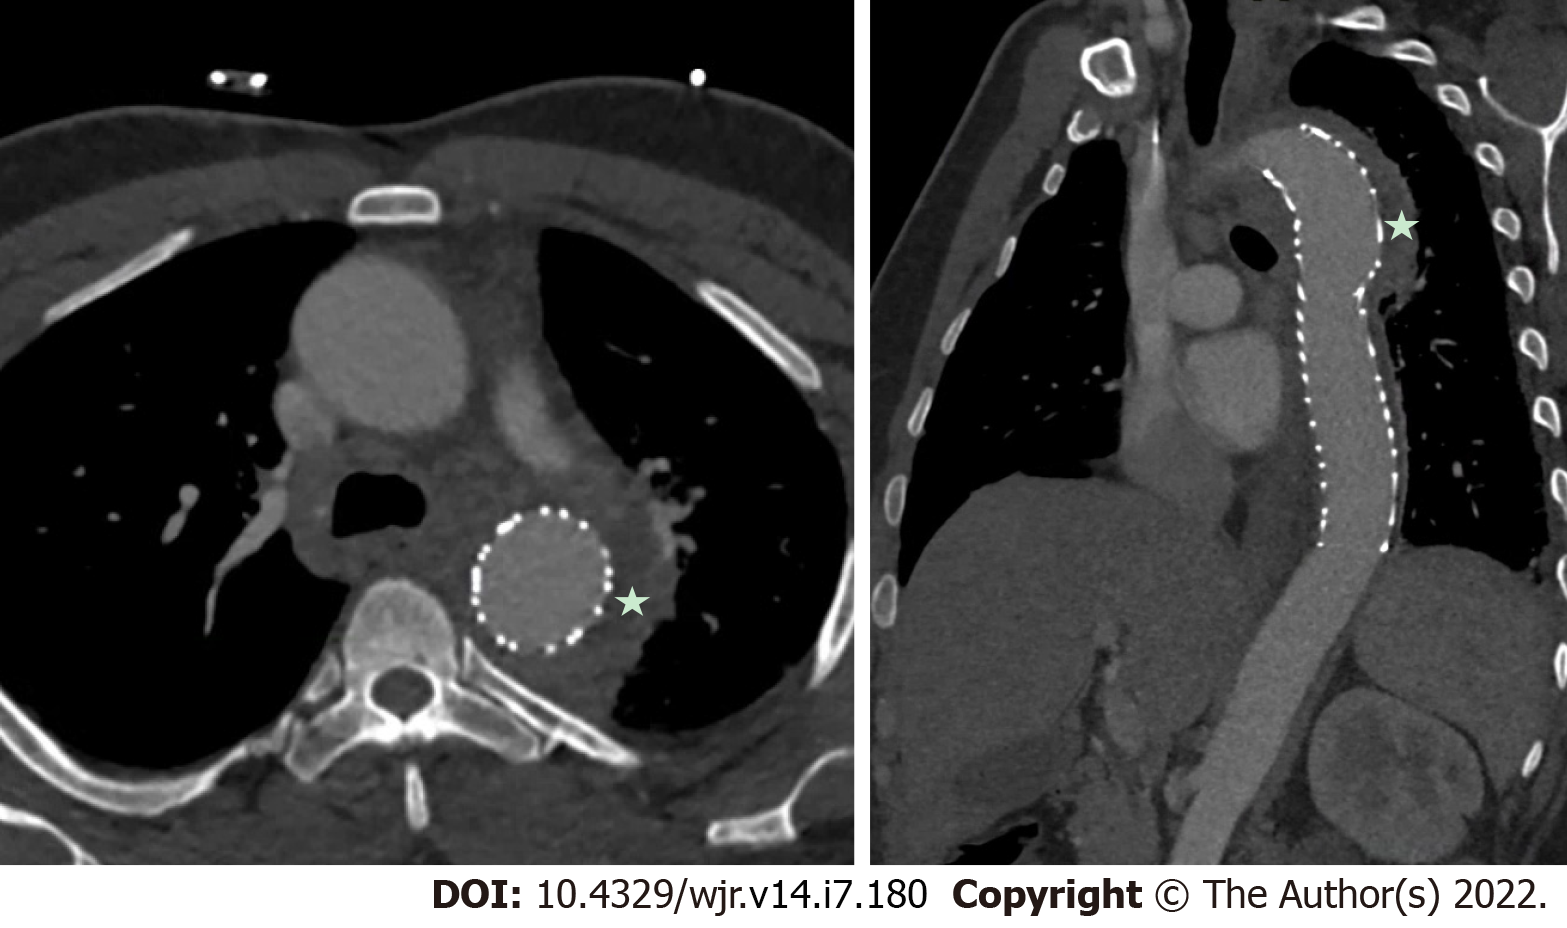
Figure 7 Aortic endovascular stent infection.
Aortic endovascular stents are also prone to infection, and negative transesophageal echocardiography for valvular vegetations with a high suspicion should prompt consideration for other sources of infections, as in this case, which was demonstrated on cardiac computed tomography with prominent soft-tissue thickening (star) around the proximal descending thoracic aorta stent.
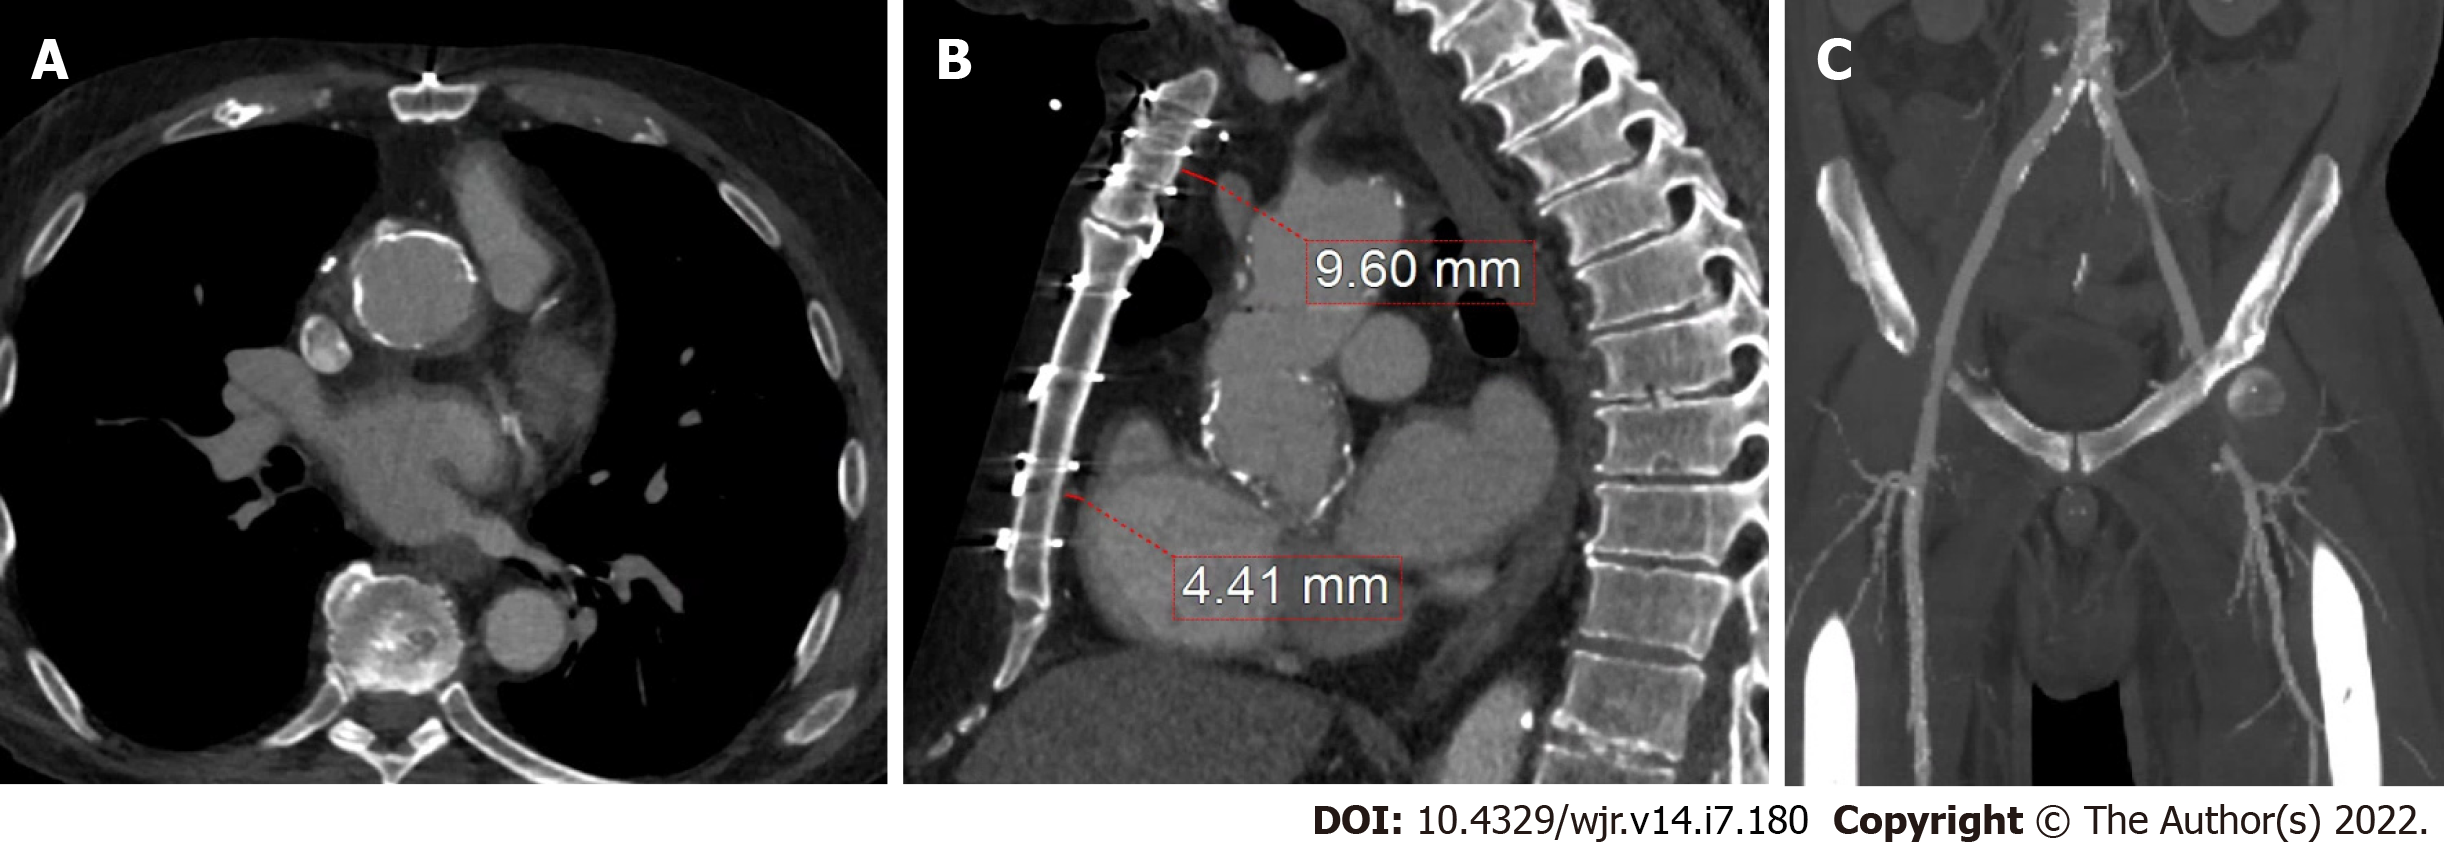
Figure 8 Prior coronary artery bypass graft.
A: Cardiac computed tomography has added utility for pre-operative planning by identifying areas of aortic calcification (which in this case was prominent at the aortic root graft); B and C: Relevant sternal distance for cardiovascular structures, such as the left braciochephalic vein and right ventricle, as well as ilio-femoral anatomy in cases where peripheral vascular access may be needed.
Figure 9 Aortic calcification and thoracic structures.
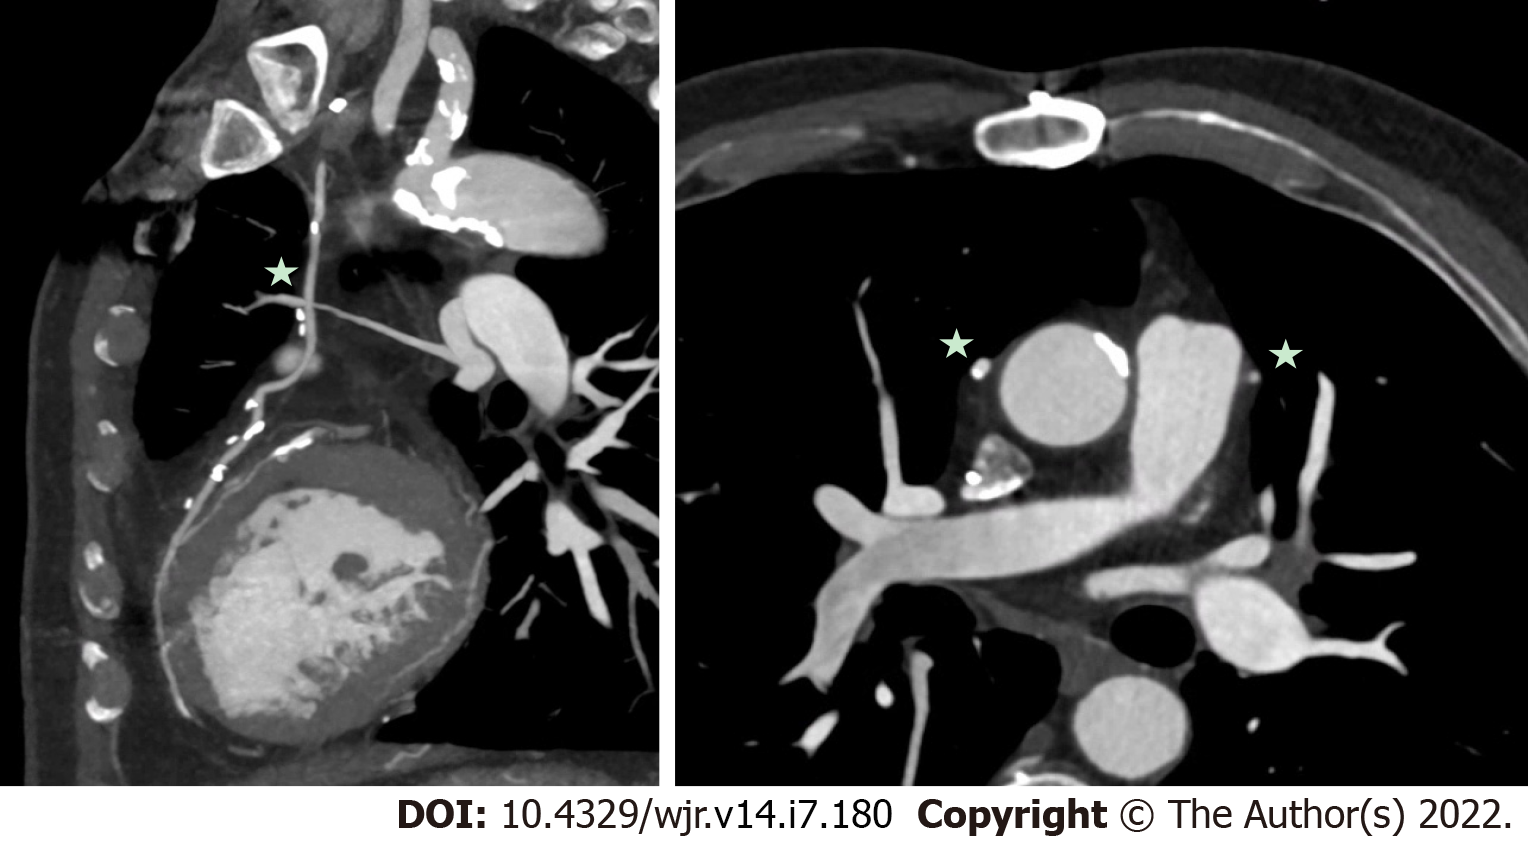
Cardiac computed tomography is also important to identify prior coronary artery bypass graft locations (stars) and sternal distance to avoid complications, which can be increased in redo-surgery particularly with increased adhesions and friable structures due to infection.
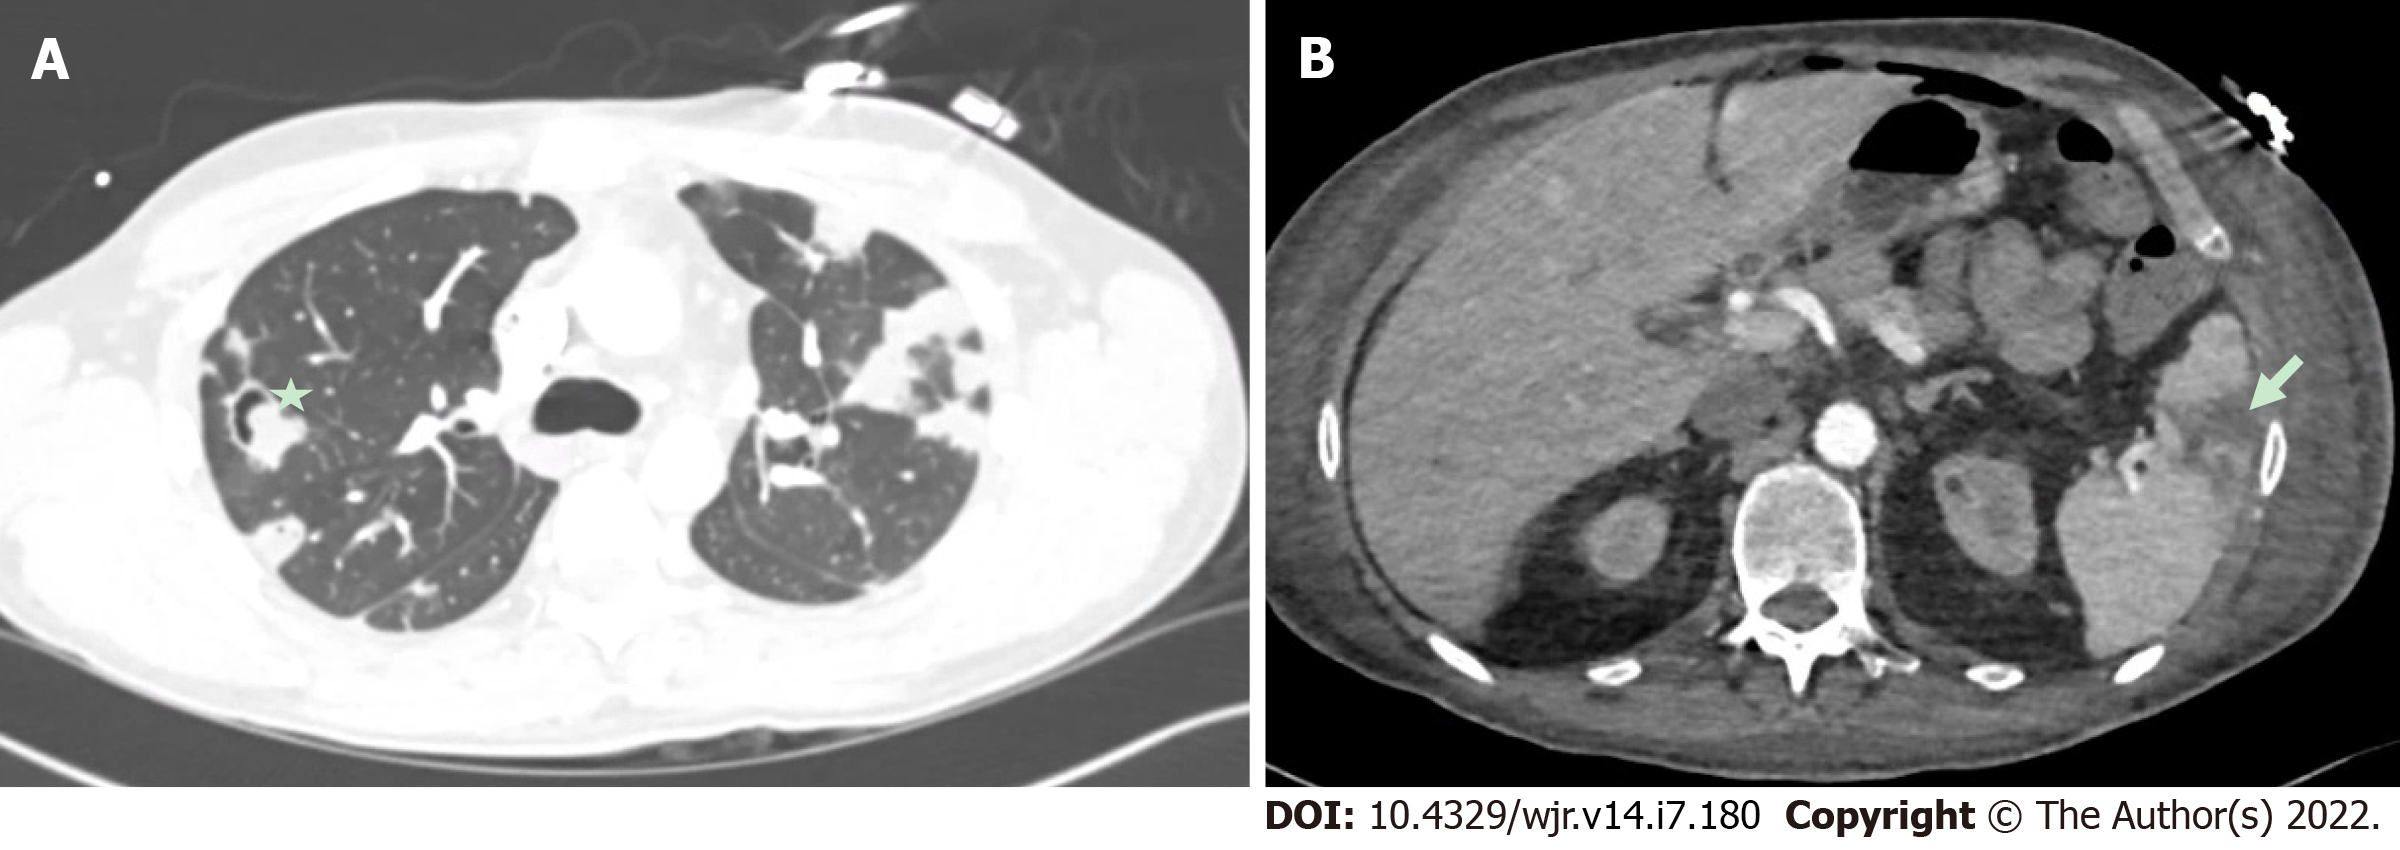
Figure 10 Embolic phenomena of infective endocarditis.
A: It demonstrates multiple pulmonary septic emboli, including cavitary lesions (star) from tricuspid valve endocarditis. Cardiac computed tomography is also incremental in demonstrating embolic phenomena which can have implications for surgical urgency and overall prognosis; B: It demonstrates a splenic infarct (arrow) from mitral valve endocarditis).
- Citation: Hughes D, Linchangco R, Reyaldeen R, Xu B. Expanding utility of cardiac computed tomography in infective endocarditis: A contemporary review . World J Radiol 2022; 14(7): 180-193
- URL: https://www.wjgnet.com/1949-8470/full/v14/i7/180.htm
- DOI: https://dx.doi.org/10.4329/wjr.v14.i7.180


