Copyright
©The Author(s) 2022.
World J Radiol. Jun 28, 2022; 14(6): 165-176
Published online Jun 28, 2022. doi: 10.4329/wjr.v14.i6.165
Published online Jun 28, 2022. doi: 10.4329/wjr.v14.i6.165
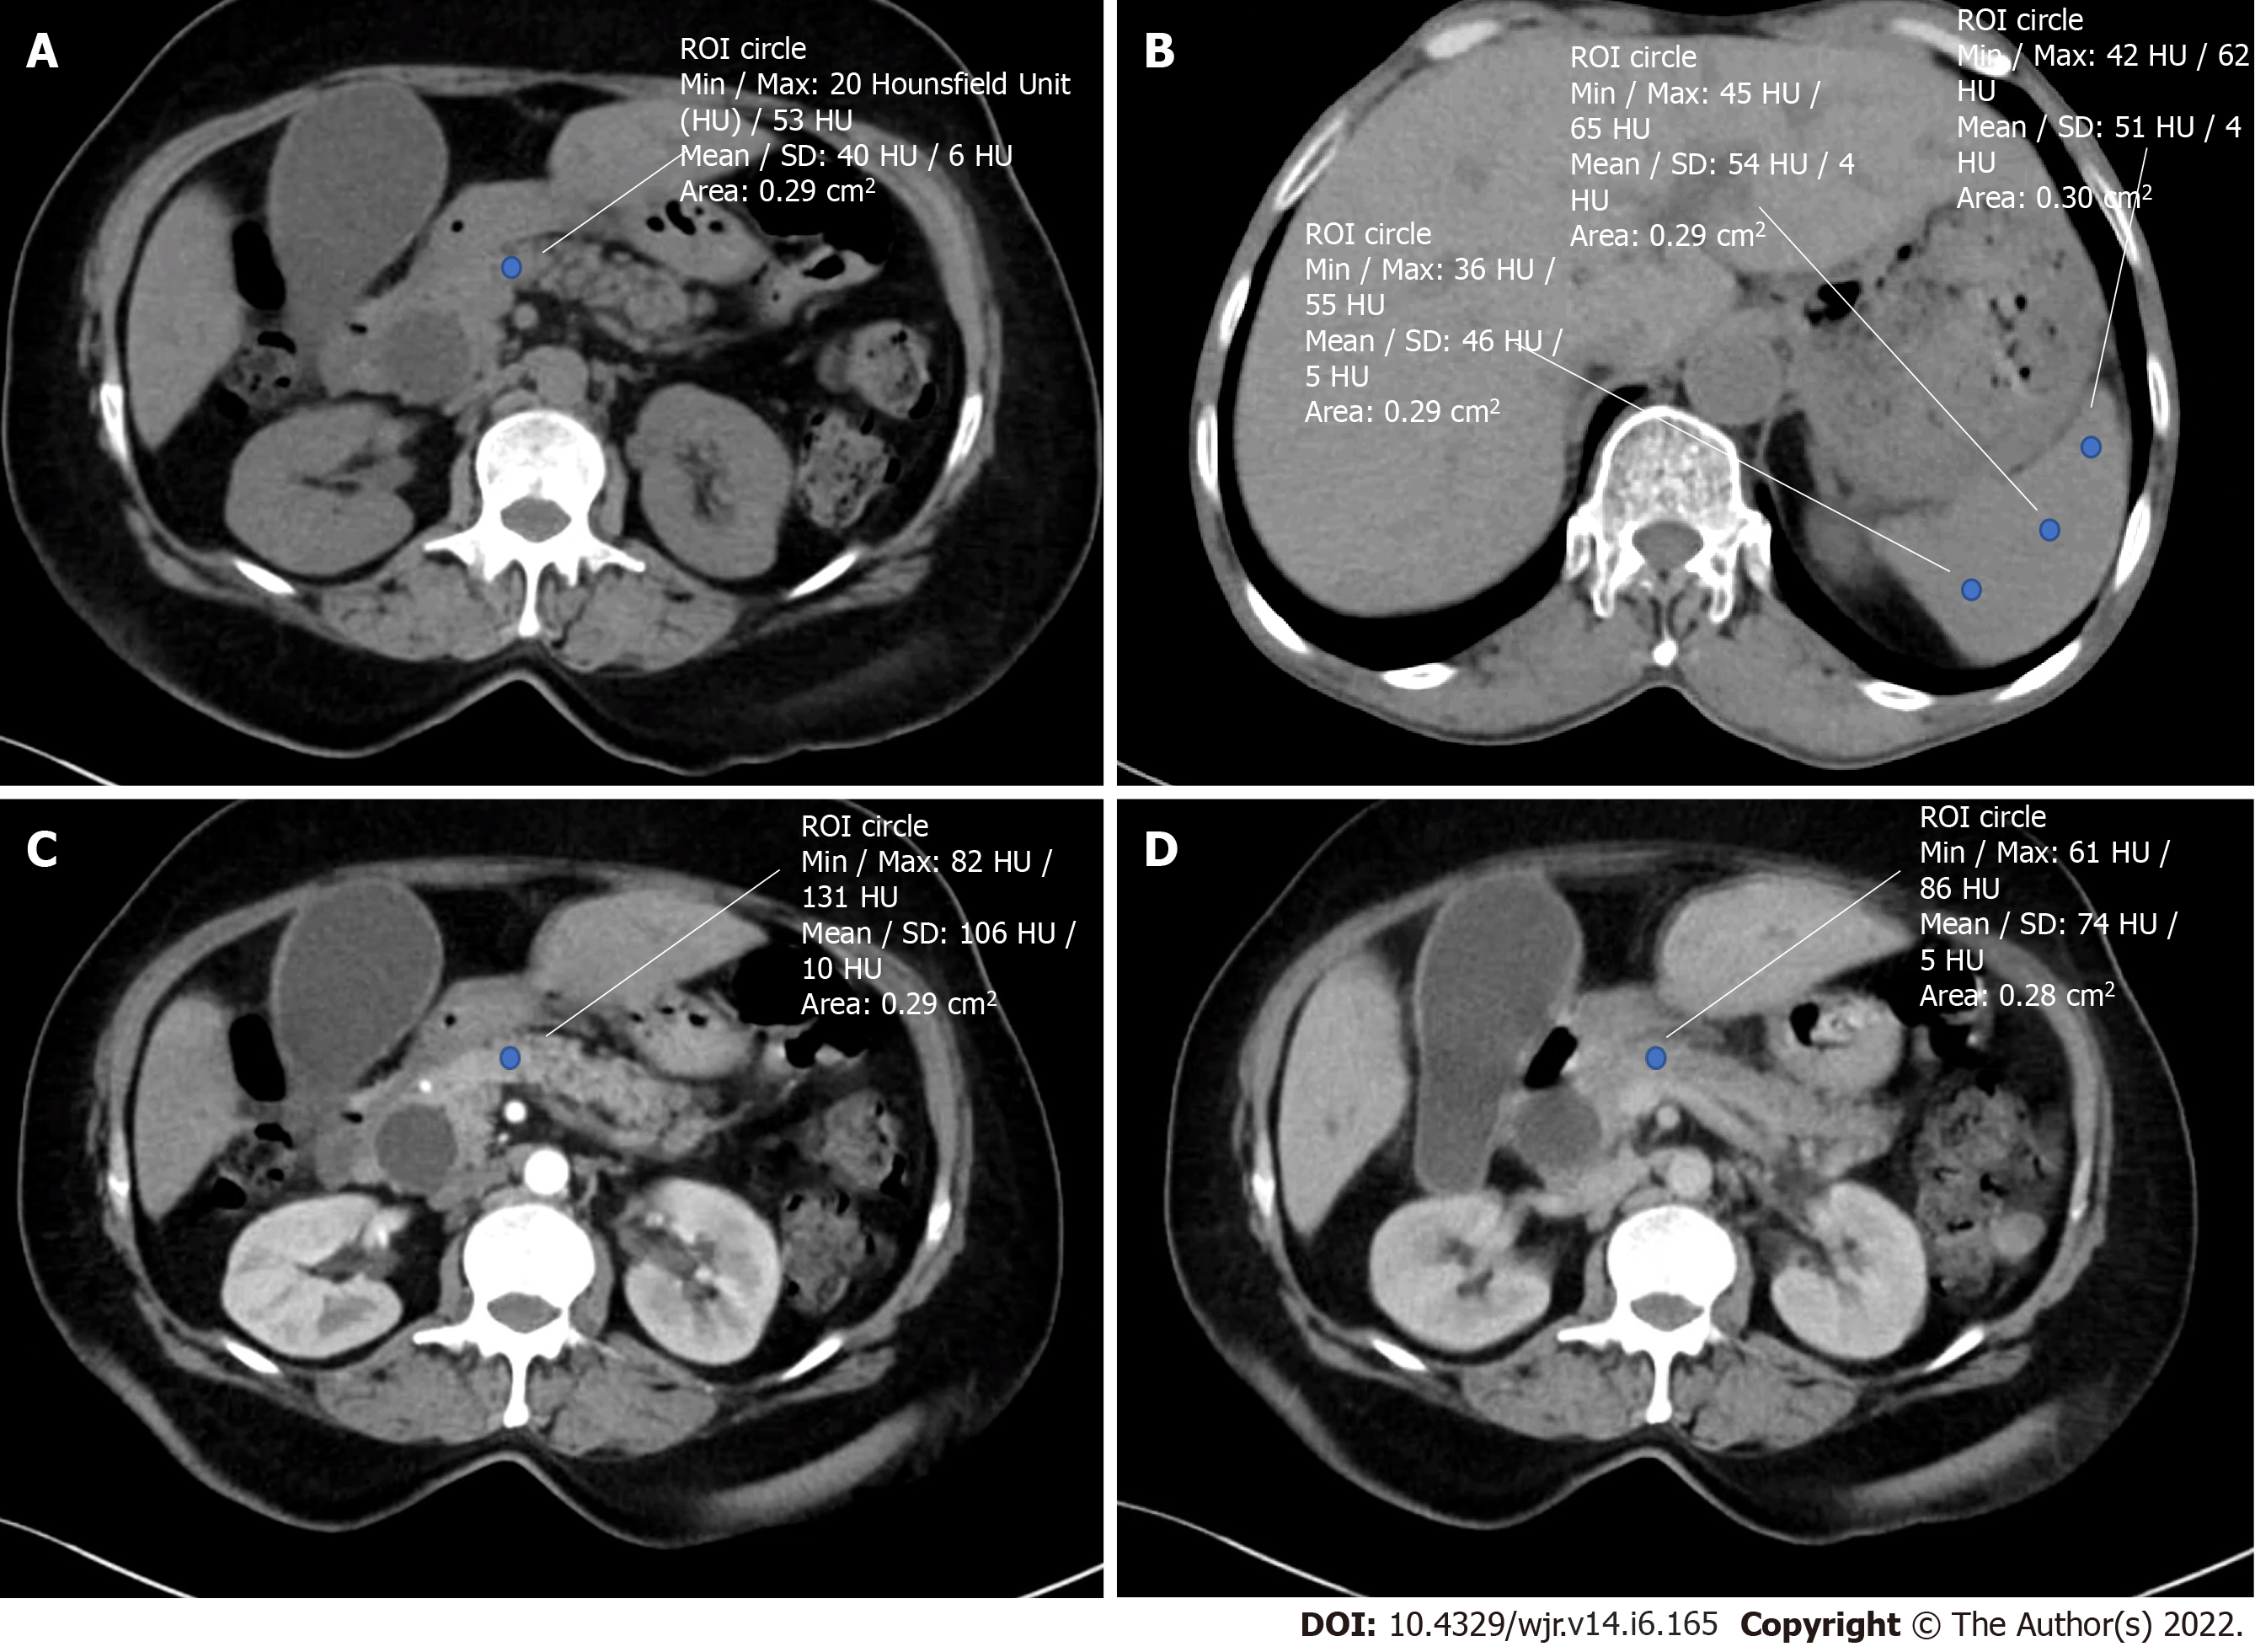
Figure 1 Calculation of preoperative radiological indices.
A: Hounsfield unit (HU) of the pancreatic neck in plain phase; B: HU of the spleen in plain phase; C: HU of the pancreatic neck in the arterial phase; D: HU of the pancreatic neck in the equilibrium phase. ROI: Region of interest.
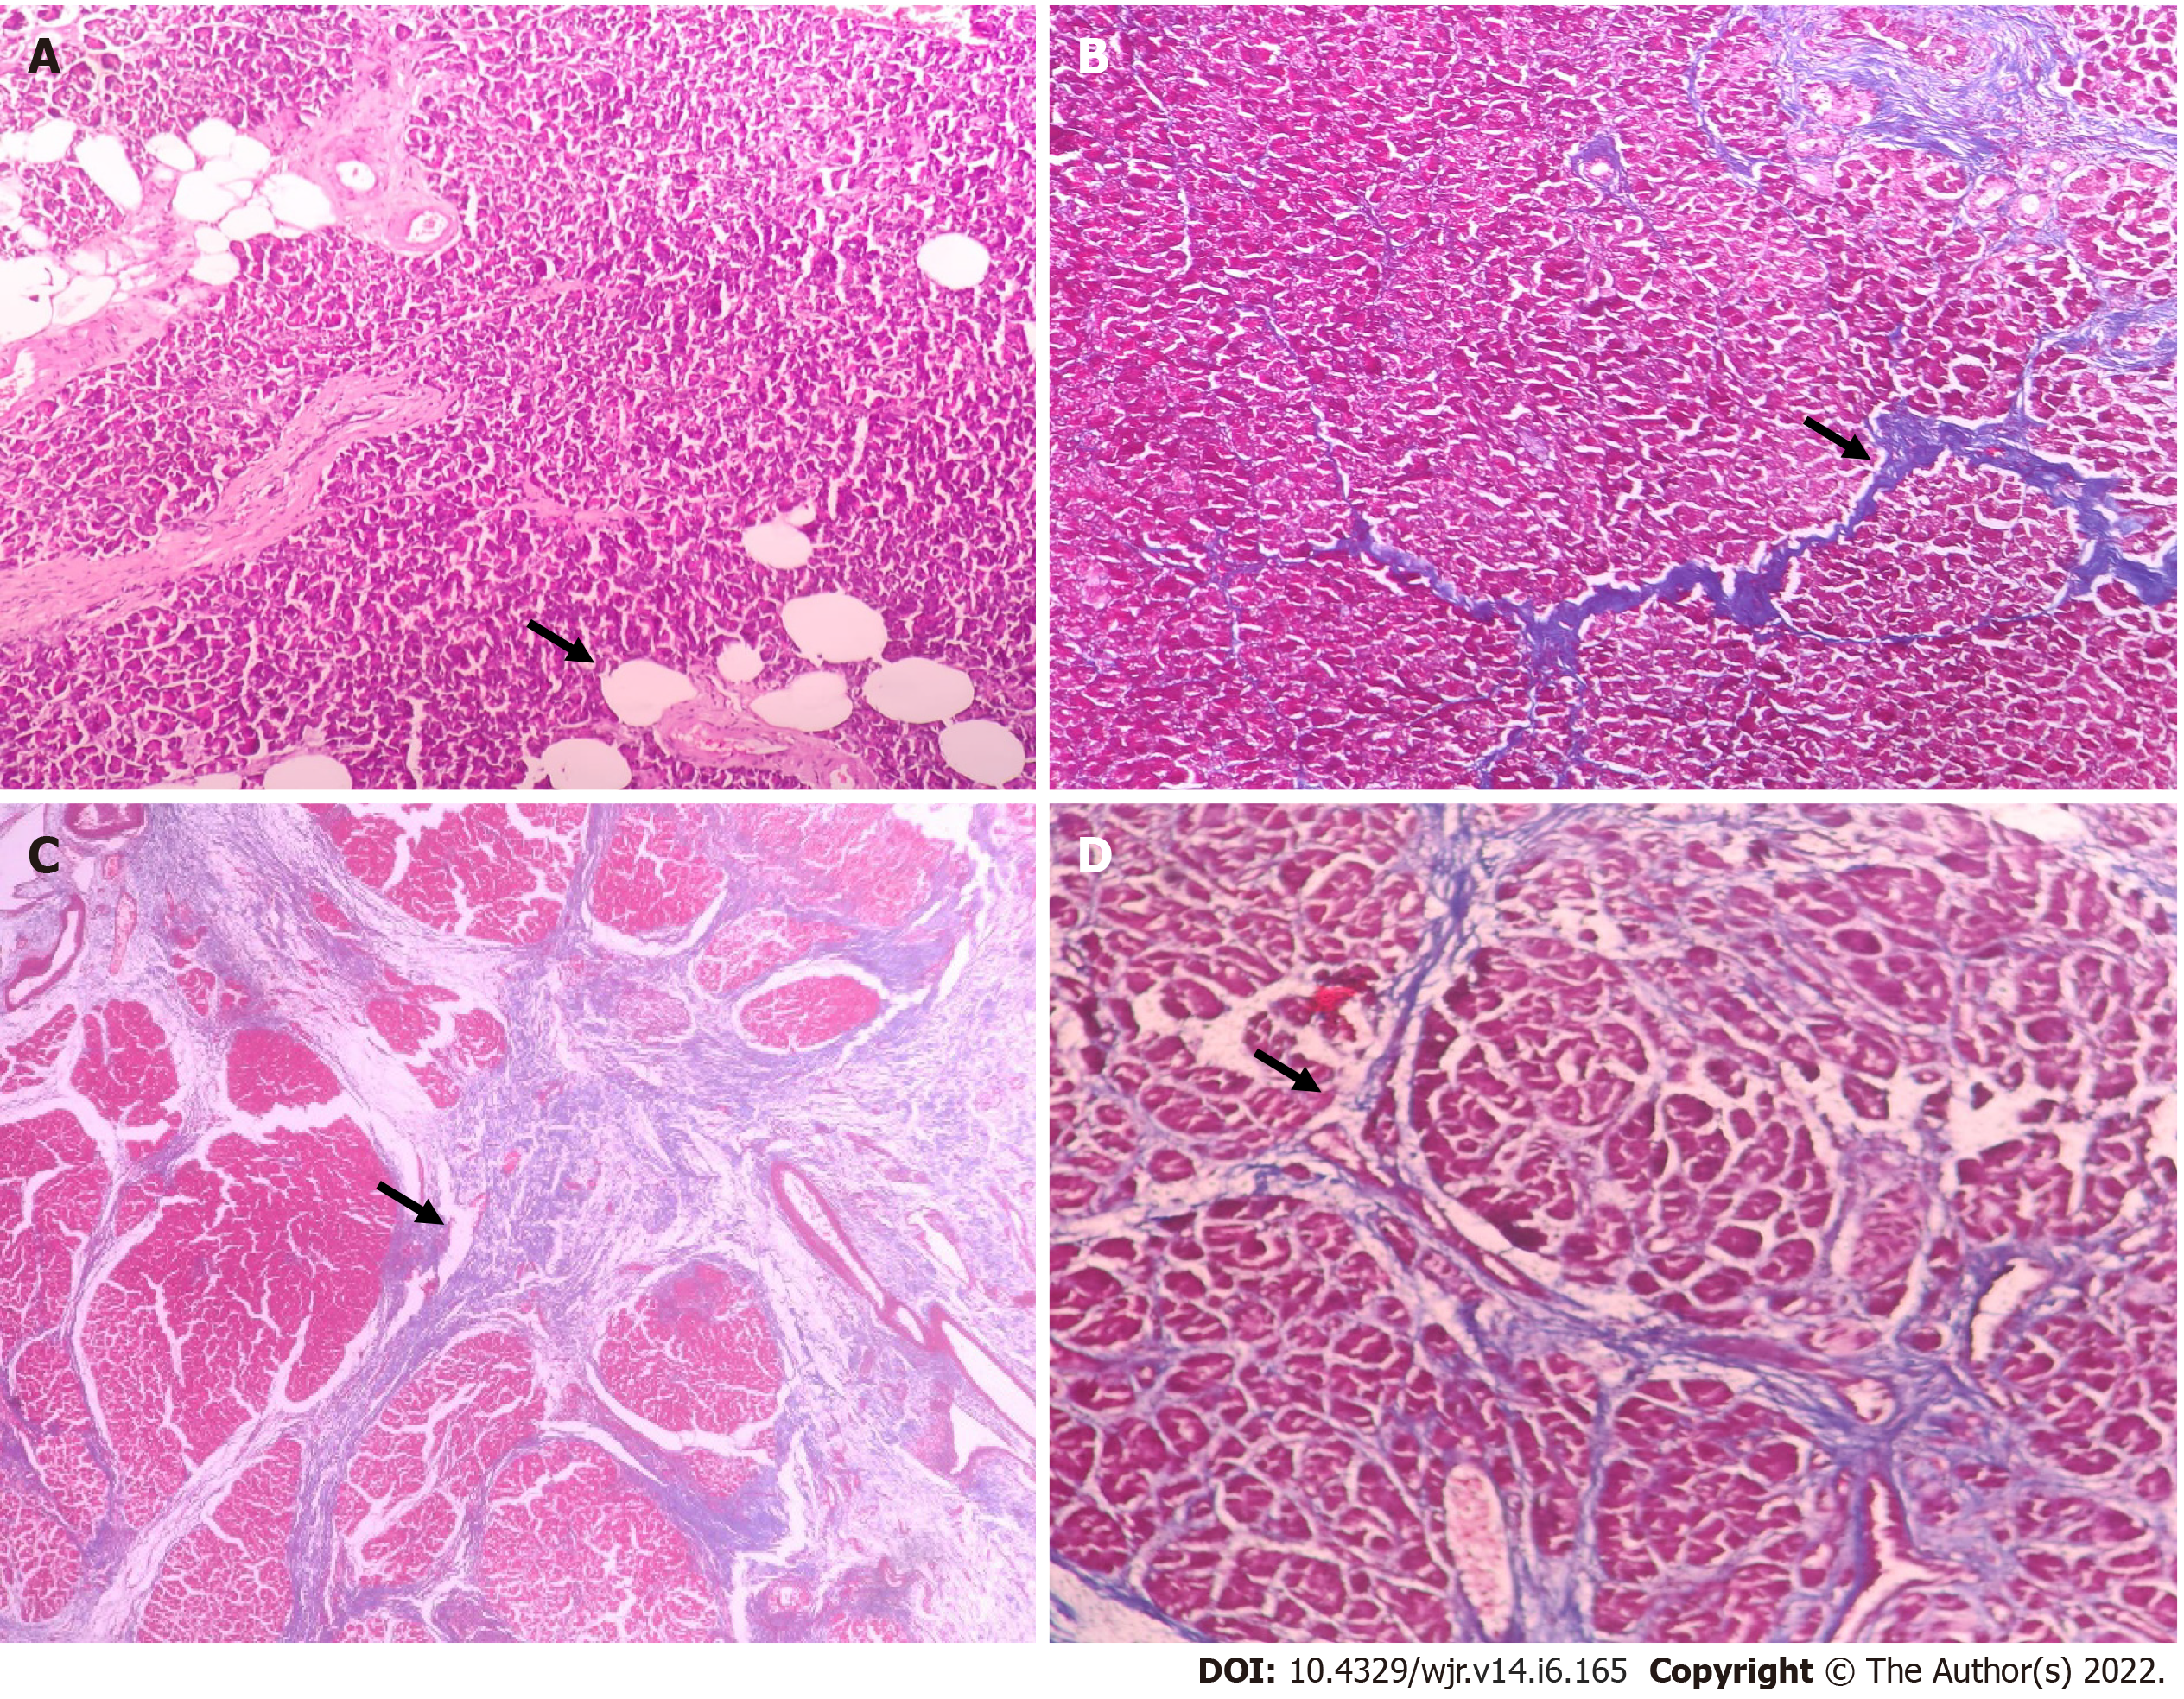
Figure 2 Histopathological evaluation of pancreatic neck fat fraction and fibrosis.
A: Photomicrograph showing moderate fat inclusion (hematoxylin and eosin [H&E], × 100); B: Photomicrograph showing heavy intralobular fibrosis (Masson's trichome stain, H&E, × 100); C: Photomicrograph showing heavy interlobular fibrosis (Masson's trichome stain, × 40); D: Photomicrograph showing weak intra and interlobular fibrosis (Masson's trichome stain, × 200).
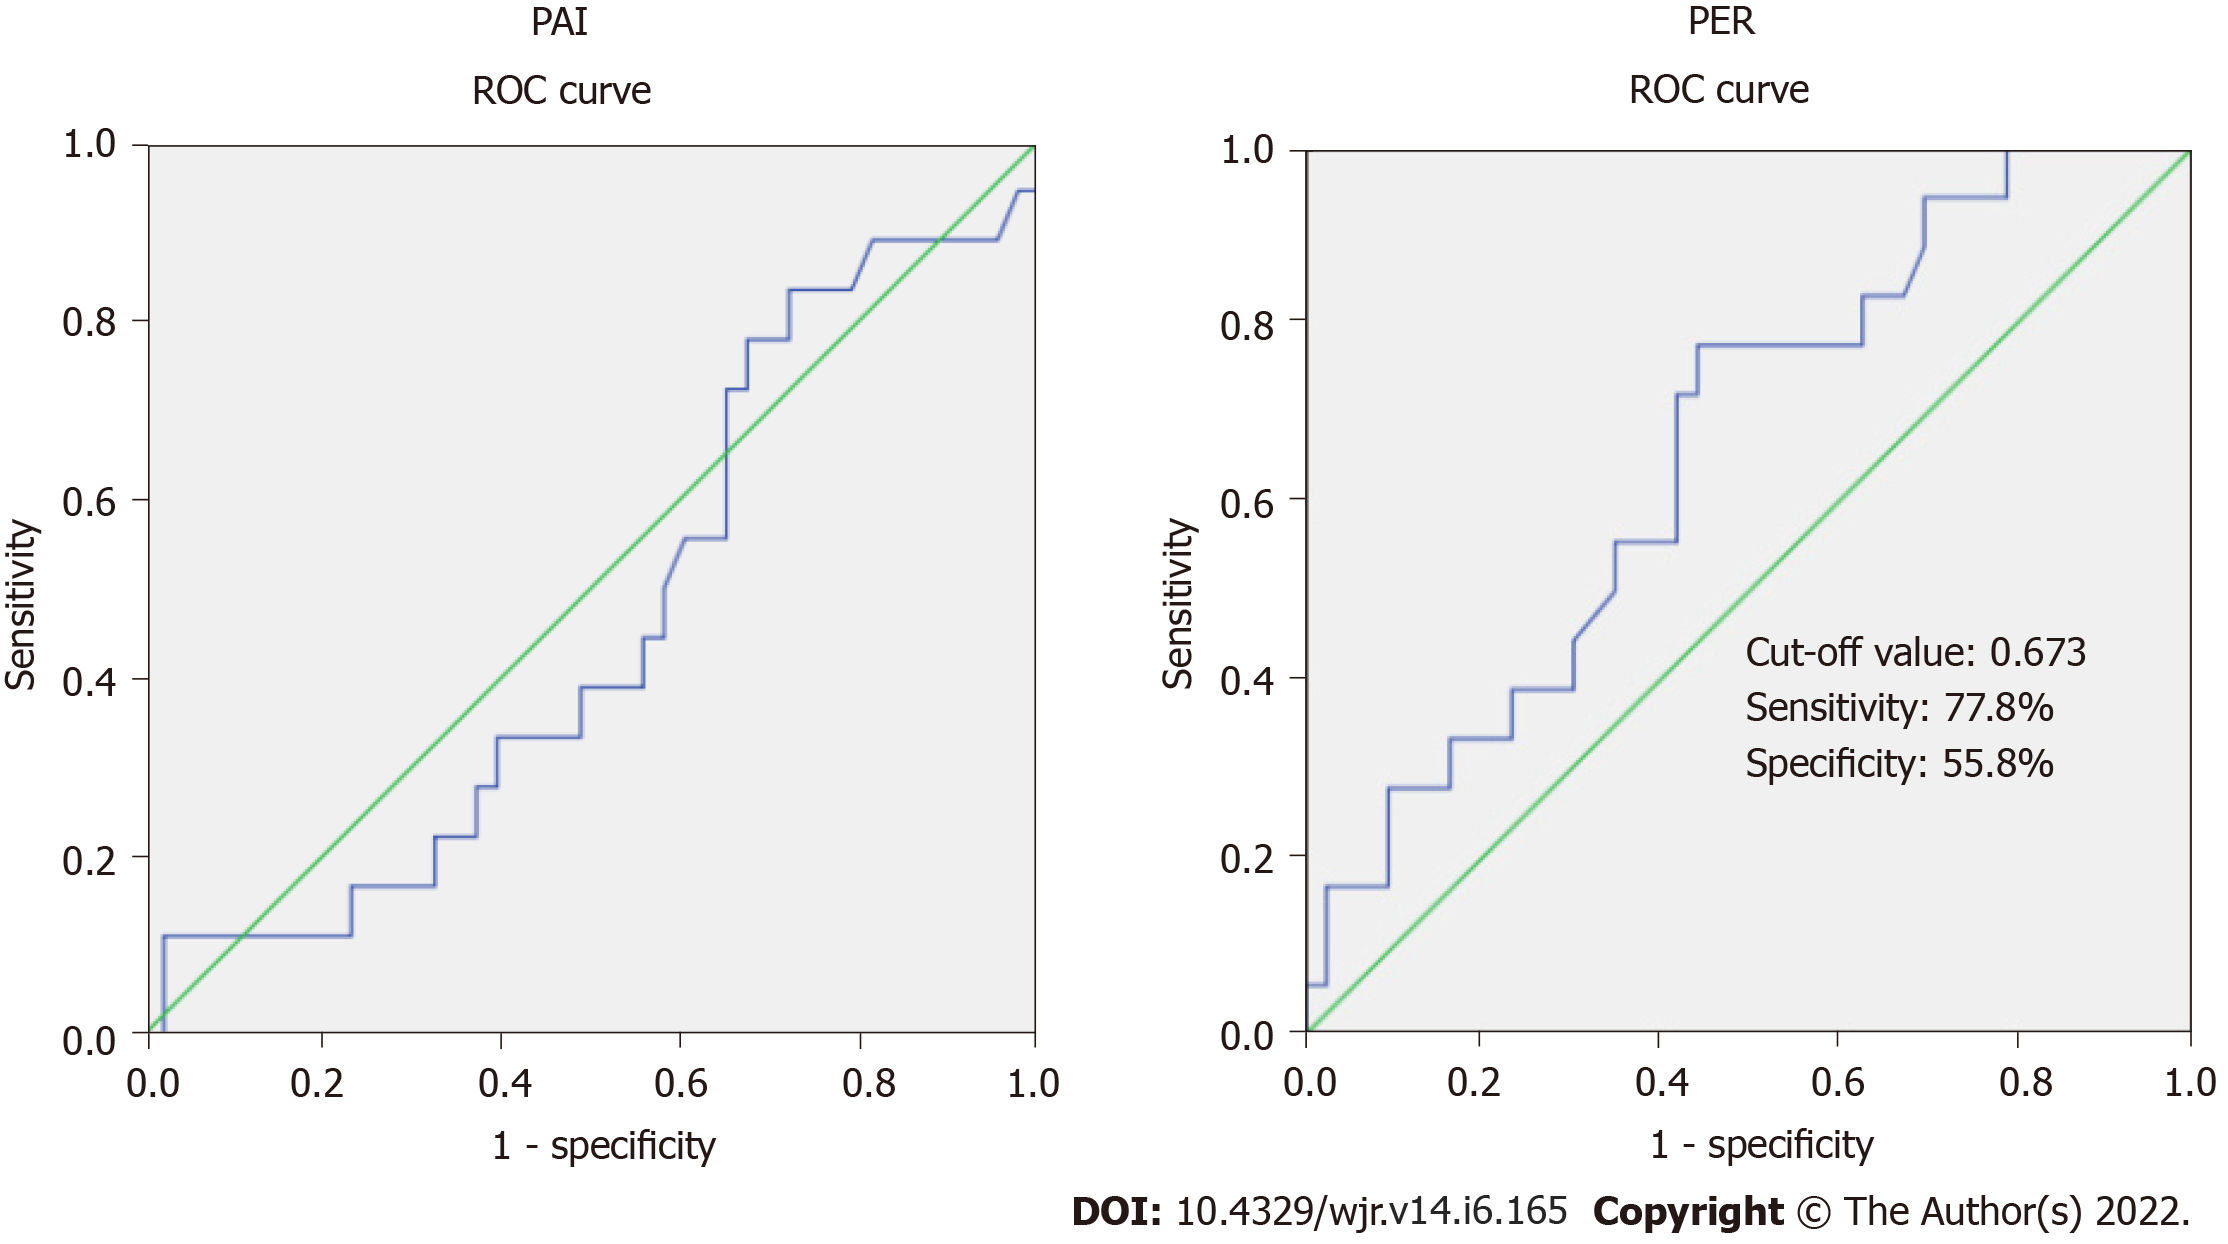
Figure 3 Receiver operating characteristic curve of the computed tomography indices for predicting clinically relevant postoperative fistula.
The area under curve for the pancreatic attenuation index is 0.461 (95%CI: 0.304-0.617), which is not significant (P = 0.630). The area under curve for the pancreatic enhancement ratio is 0.661 (95%CI: 0.517-0.804), which is significant (P = 0.049). ROC: Receiver operating characteristic; PAI: Pancreatic attenuation index; PER: Pancreatic enhancement ratio.
- Citation: Gnanasekaran S, Durgesh S, Gurram R, Kalayarasan R, Pottakkat B, Rajeswari M, Srinivas BH, Ramesh A, Sahoo J. Do preoperative pancreatic computed tomography attenuation index and enhancement ratio predict pancreatic fistula after pancreaticoduodenectomy? World J Radiol 2022; 14(6): 165-176
- URL: https://www.wjgnet.com/1949-8470/full/v14/i6/165.htm
- DOI: https://dx.doi.org/10.4329/wjr.v14.i6.165


