Copyright
©The Author(s) 2022.
World J Radiol. Apr 28, 2022; 14(4): 82-90
Published online Apr 28, 2022. doi: 10.4329/wjr.v14.i4.82
Published online Apr 28, 2022. doi: 10.4329/wjr.v14.i4.82
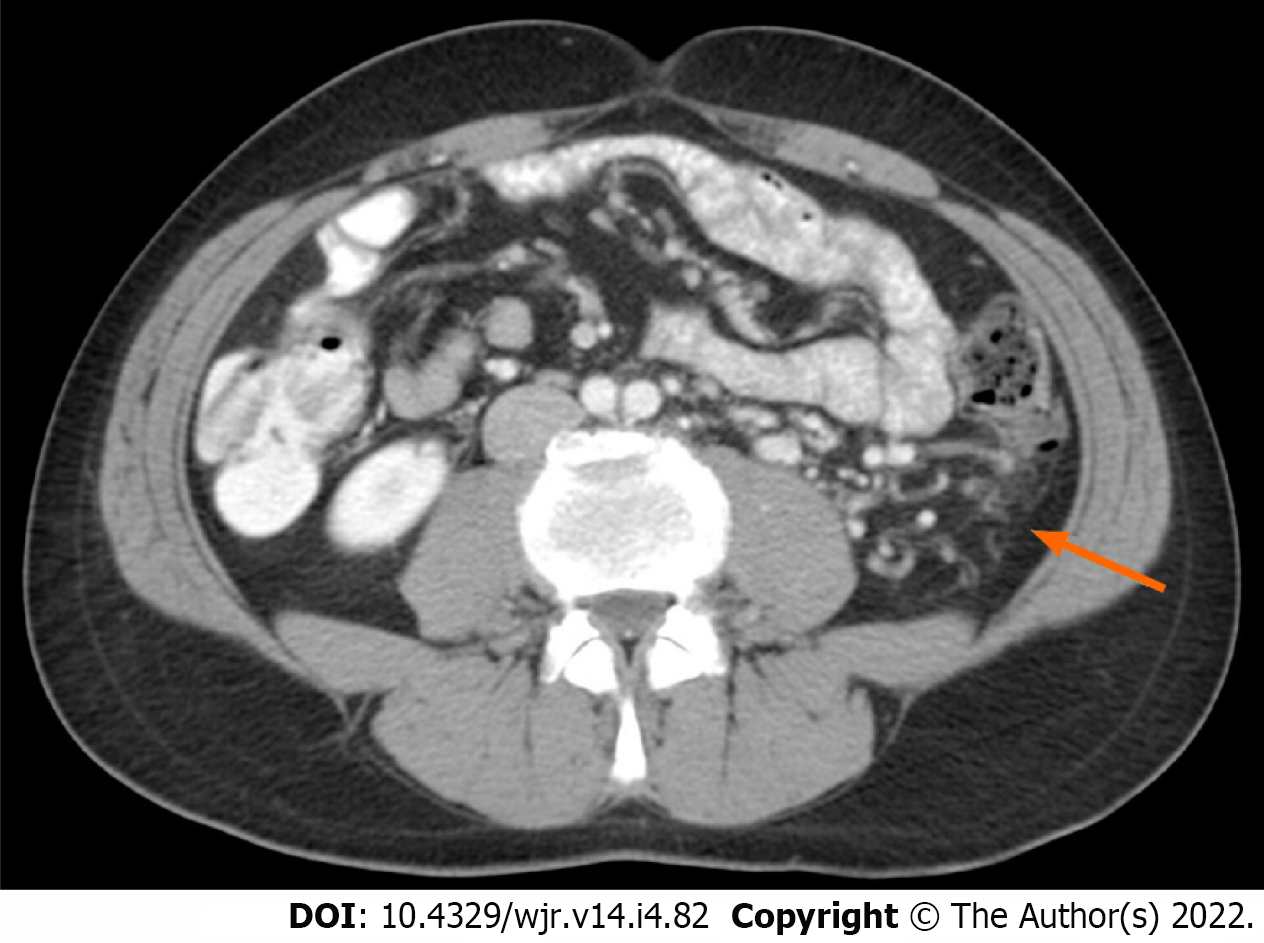
Figure 1 Axial computed tomography image shows the presence of clear cell renal cell carcinoma collateral vessels with the typical tortuous course located in the retroperitoneal space (arrow).
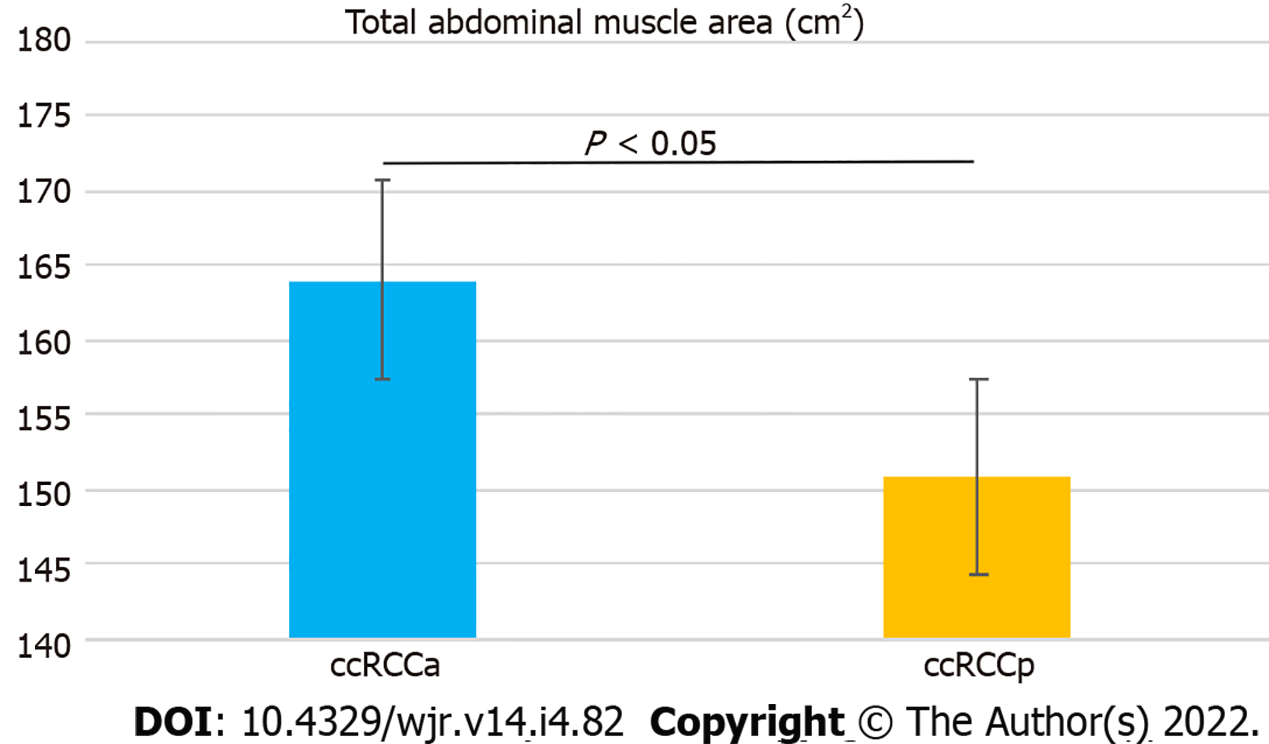
Figure 2 Bar chart with error bars showing a significant difference in mean values of total abdominal muscle area between the two groups.
ccRCC: Clear cell renal cell carcinoma.
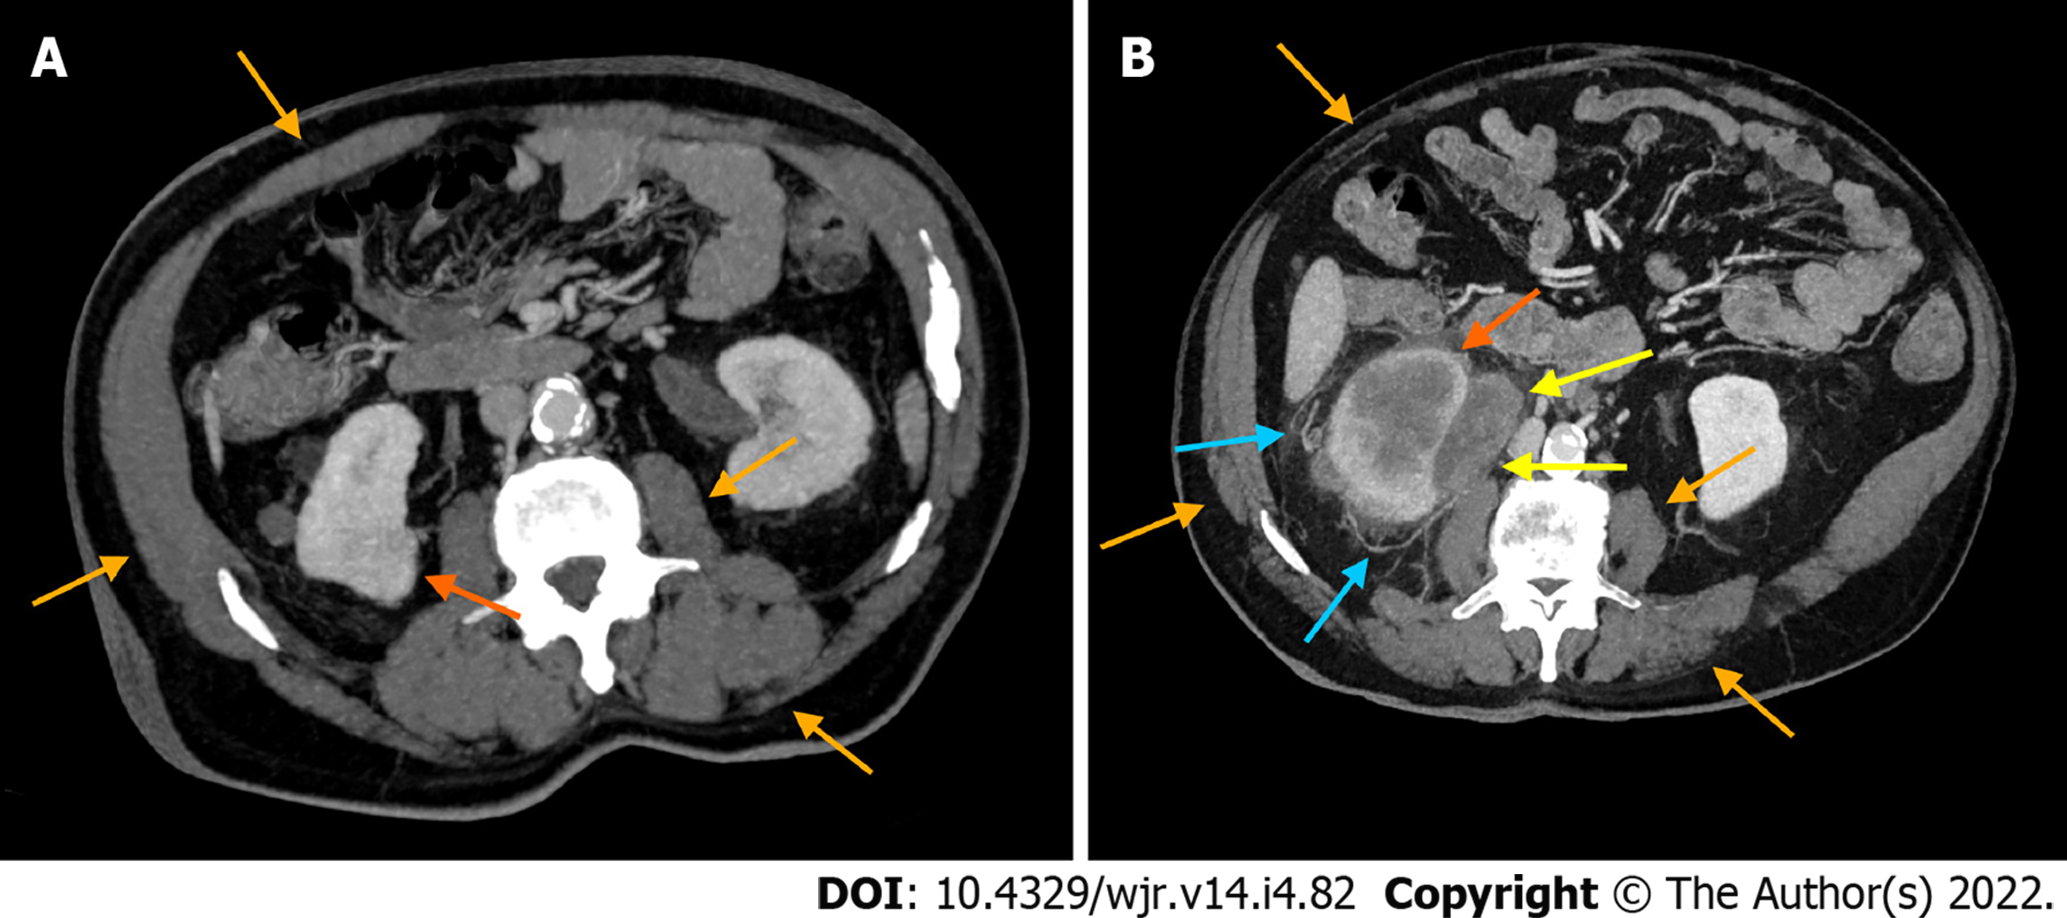
Figure 3 Axial computed tomography images with maximum intensity projection reconstruction of an 84-year-old male clear cell renal cell carcinoma patient without collateral vessels and an 82-year-old male clear cell renal cell carcinoma patient with collateral vessels.
These images show skeletal muscle masses (SMMs) and tumors in a clear cell renal cell carcinoma patient without collateral vessels (ccRCCa) (A) and a clear cell renal cell carcinoma patient with collateral vessels (ccRCCp) (B) (orange and dark orange arrows in A and B, respectively), as well as collateral vessels adjacent to the tumor in the ccRCCp patient (light blue arrows in B) and nodal metastasis infiltrating the ureter (yellow arrows in B). Please note the decrease of SMM clearly evident in the ccRCCp patient (B) compared to the ccRCCa patient (A).
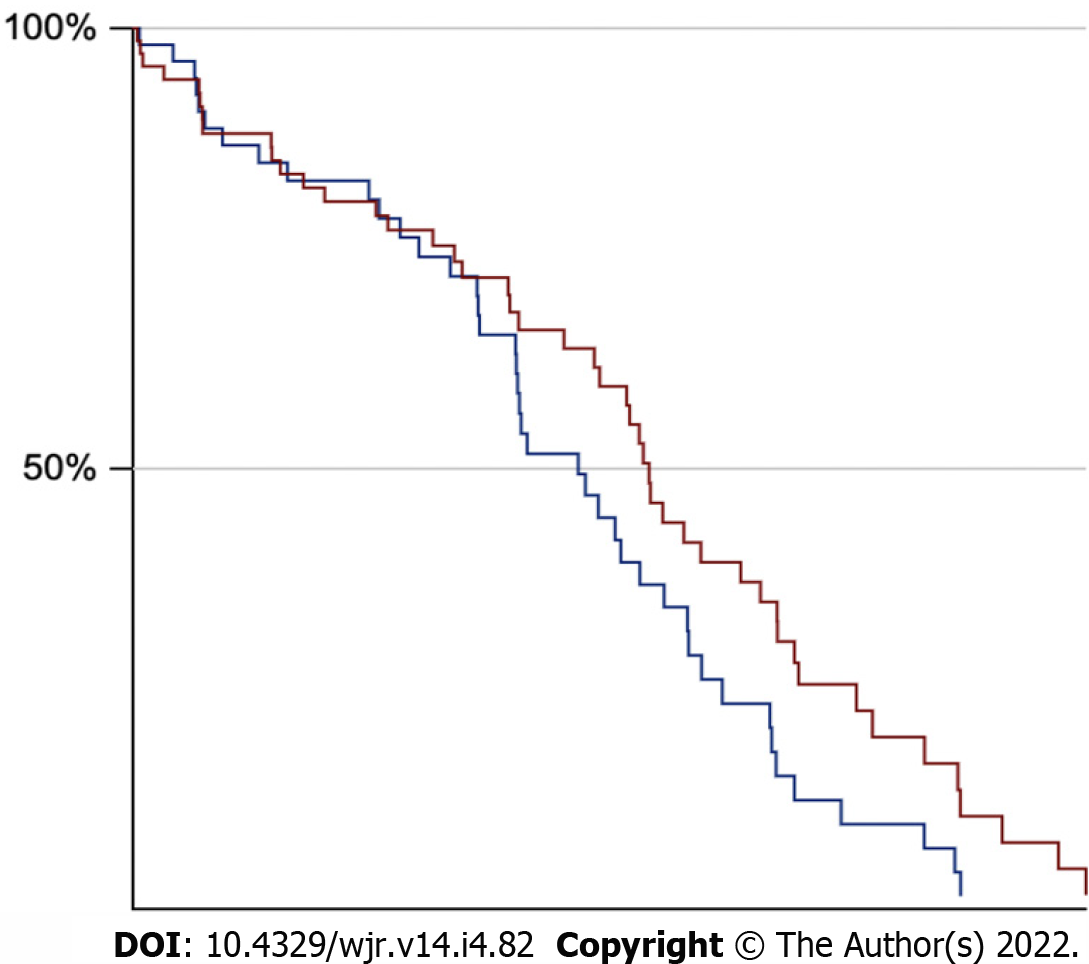
Figure 4 Kaplan-Meier curves showing no statistically significant difference of survival between the two groups (ccRCCa group is depicted as blue curve and ccRCCb group is depicted as red curve).
- Citation: Greco F, Beomonte Zobel B, Mallio CA. Decreased cross-sectional muscle area in male patients with clear cell renal cell carcinoma and peritumoral collateral vessels. World J Radiol 2022; 14(4): 82-90
- URL: https://www.wjgnet.com/1949-8470/full/v14/i4/82.htm
- DOI: https://dx.doi.org/10.4329/wjr.v14.i4.82


