Copyright
©The Author(s) 2022.
World J Radiol. Apr 28, 2022; 14(4): 70-81
Published online Apr 28, 2022. doi: 10.4329/wjr.v14.i4.70
Published online Apr 28, 2022. doi: 10.4329/wjr.v14.i4.70
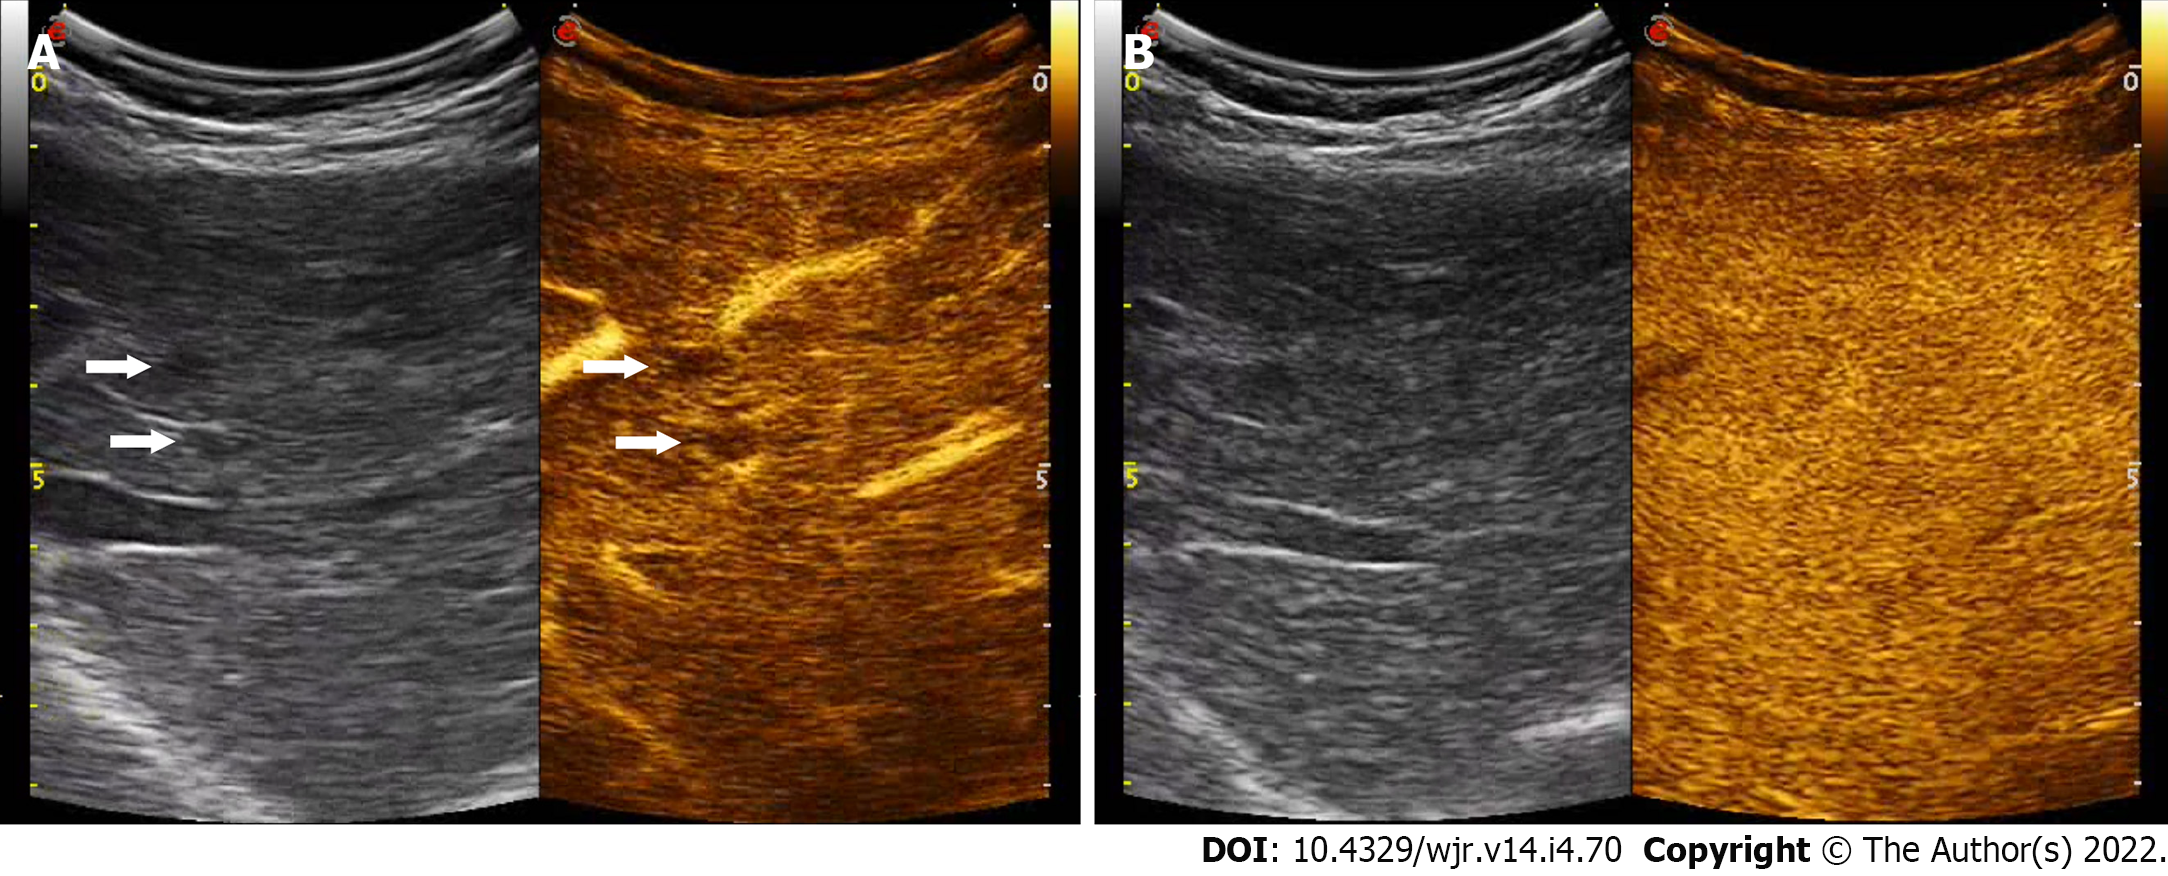
Figure 1 Regenerative nodule.
A: Contrast-enhanced ultrasound examination in the arterial phase (29 s after the i.v. injection of contrast agent) shows two millimetric hypoechoic nodules, showing lack of contrast enhancement (right, arrows); B: In the late phase (142 s after the injection) both nodules are isoechoic to the adjacent liver parenchyma.
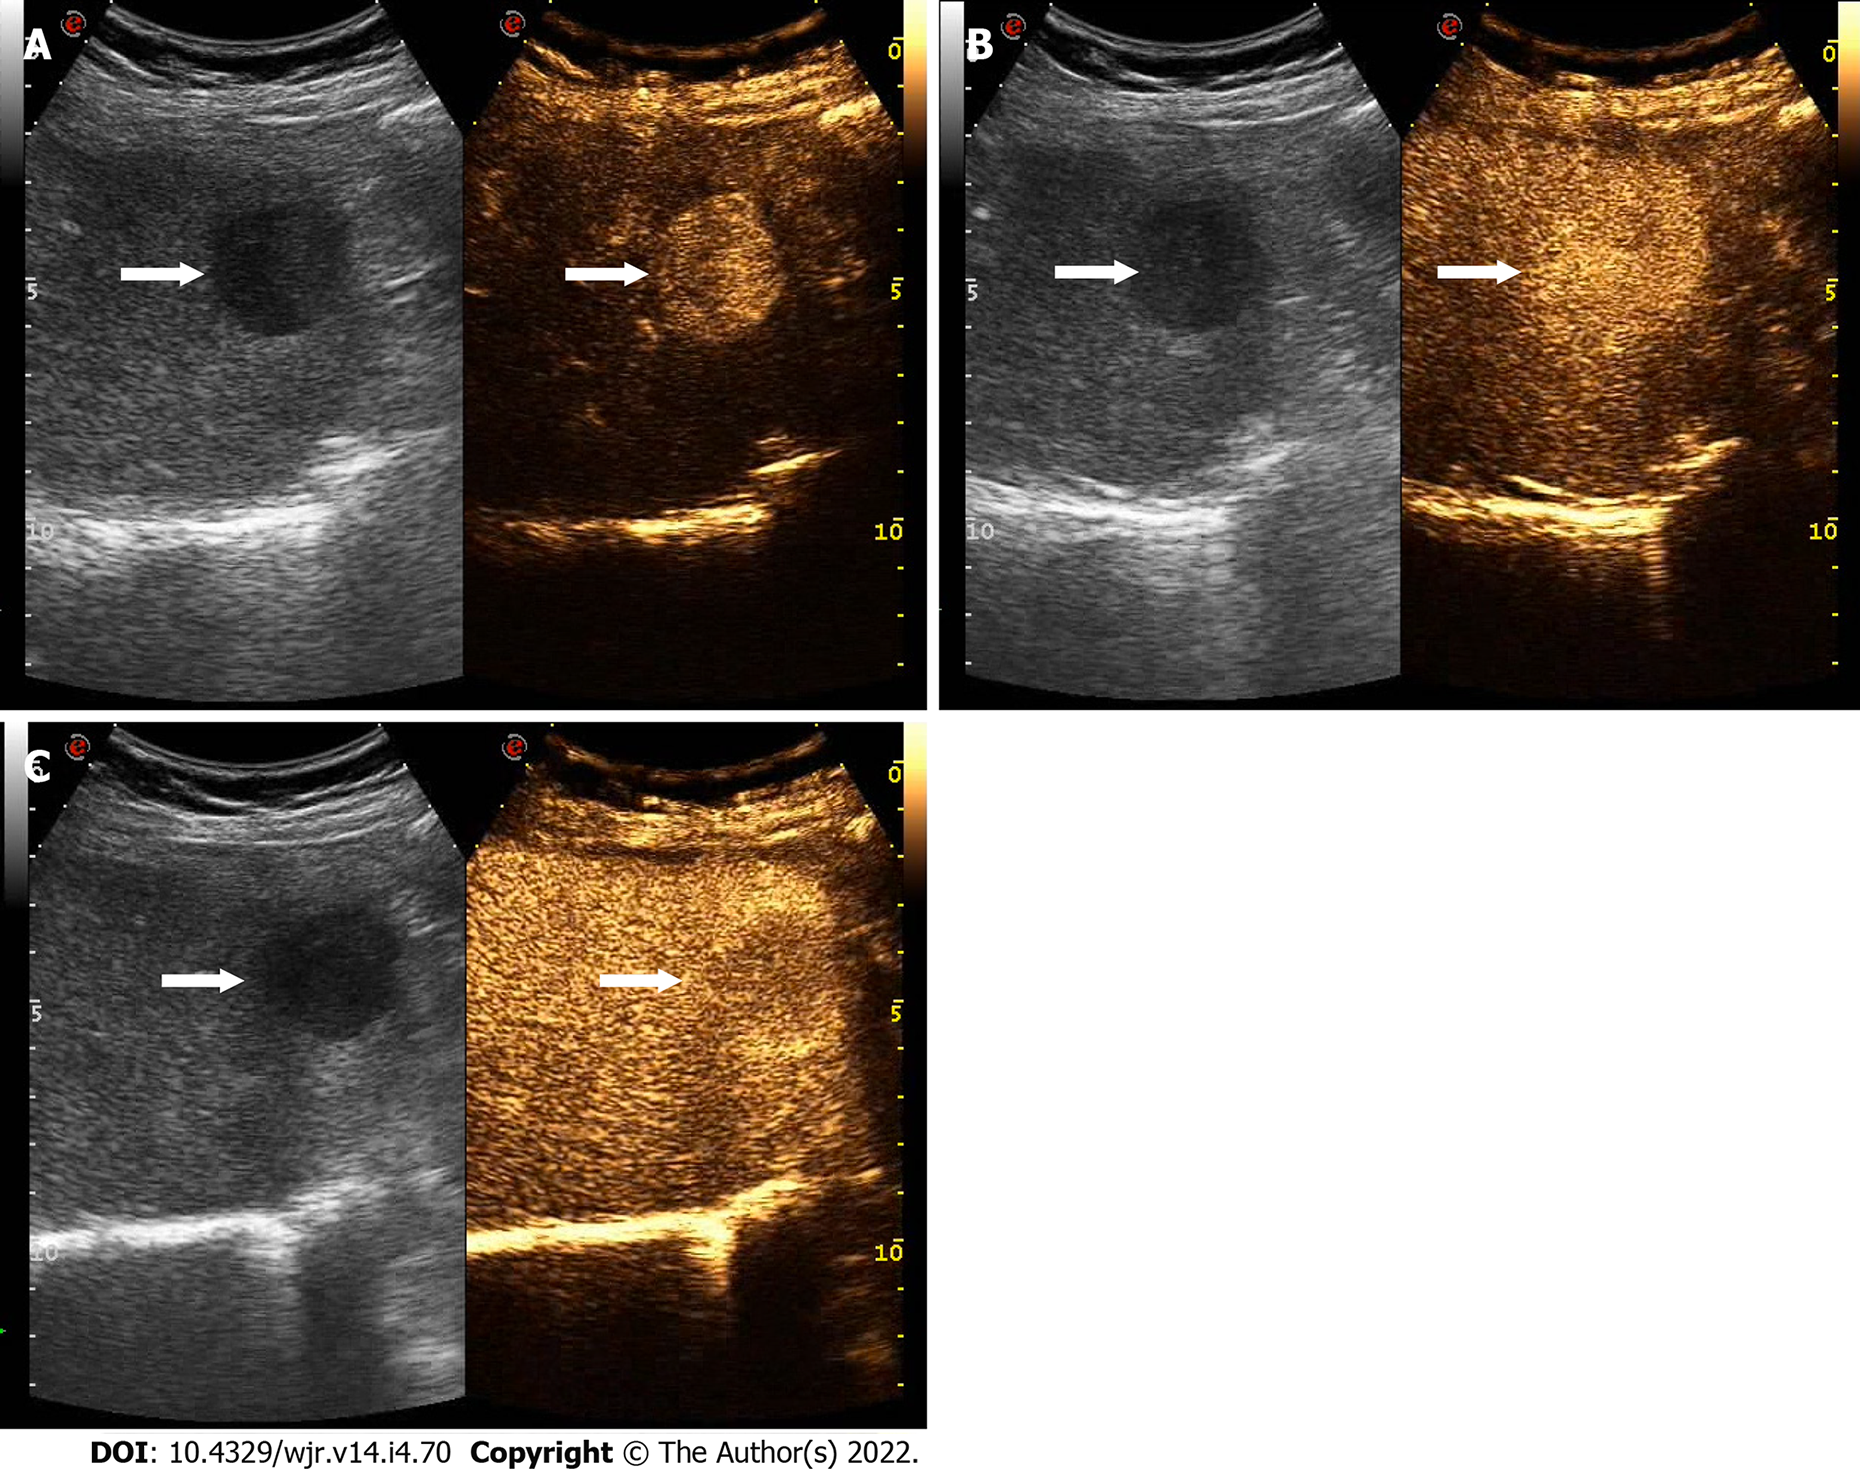
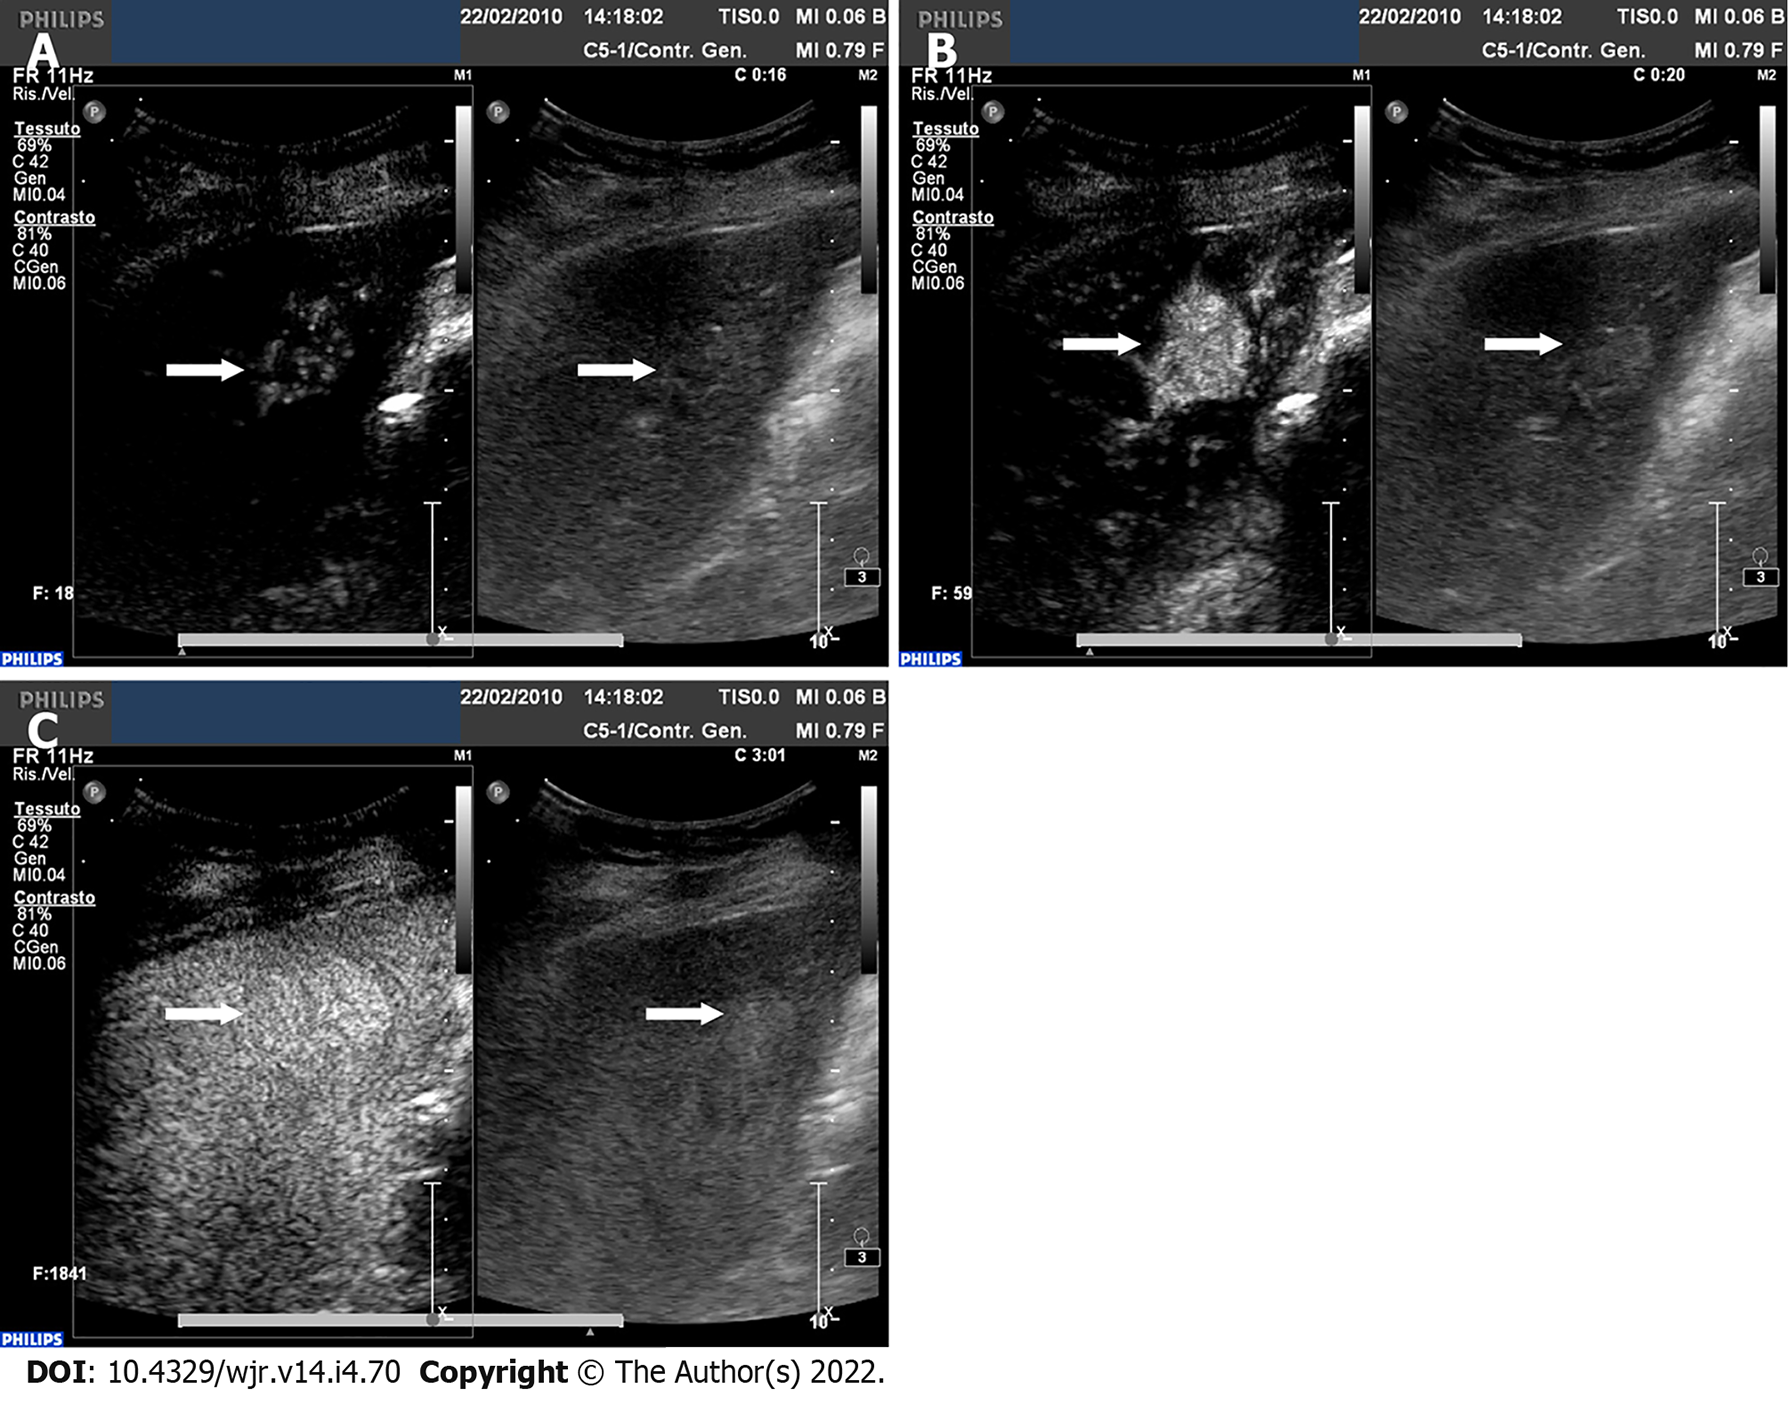
Figure 2 Hepatocellular carcinoma.
A: Contrast-enhanced ultrasound examination in the arterial phase (30 s after the i.v. injection of contrast agent) shows a 3 cm sized hypoechoic nodule, showing a marked contrast enhancement (right, arrow); B: In the portal phase (70 s after the injection) the lesion is still hyper-enhancing in comparison to the adjacent liver parenchyma (arrows); C: Only waiting for the extended portal phase (i.e. 122 s after the injection) the lesion shows a mild and late wash-out and appears moderately hypoechoic (arrows).
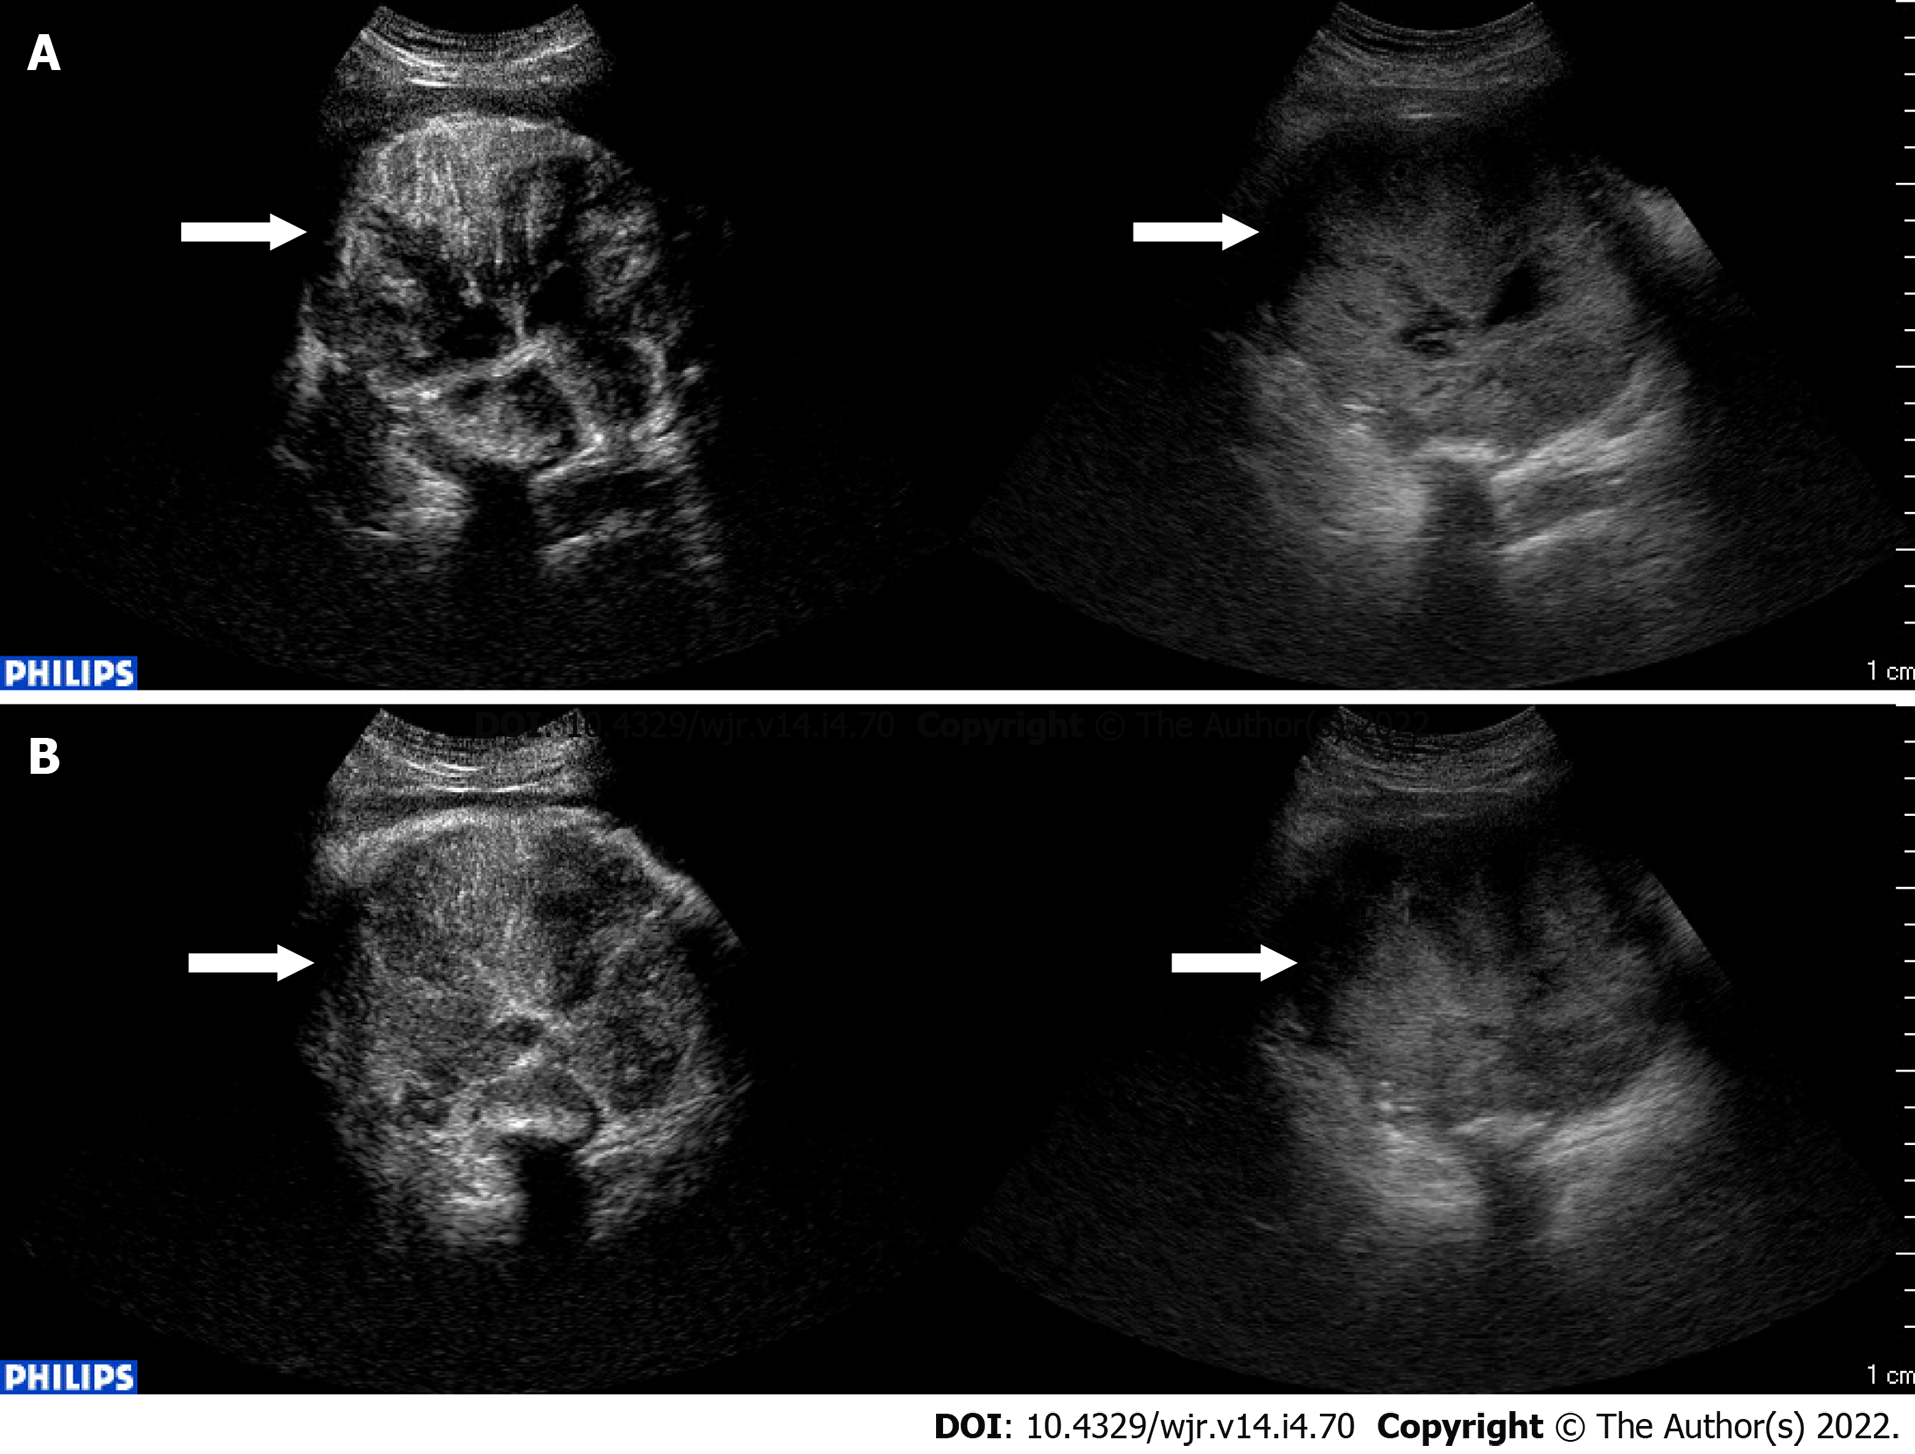
Figure 3 Liver metastasis from gastrointestinal stromal tumor.
A: Contrast-enhanced ultrasound examination in the arterial phase (10 s after the i.v. injection of contrast agent) shows a large (11 cm) mass, showing heterogeneous contrast enhancement (left, arrow); B: Still in the arterial phase (40 s after the injection) the mass shows early wash-out.
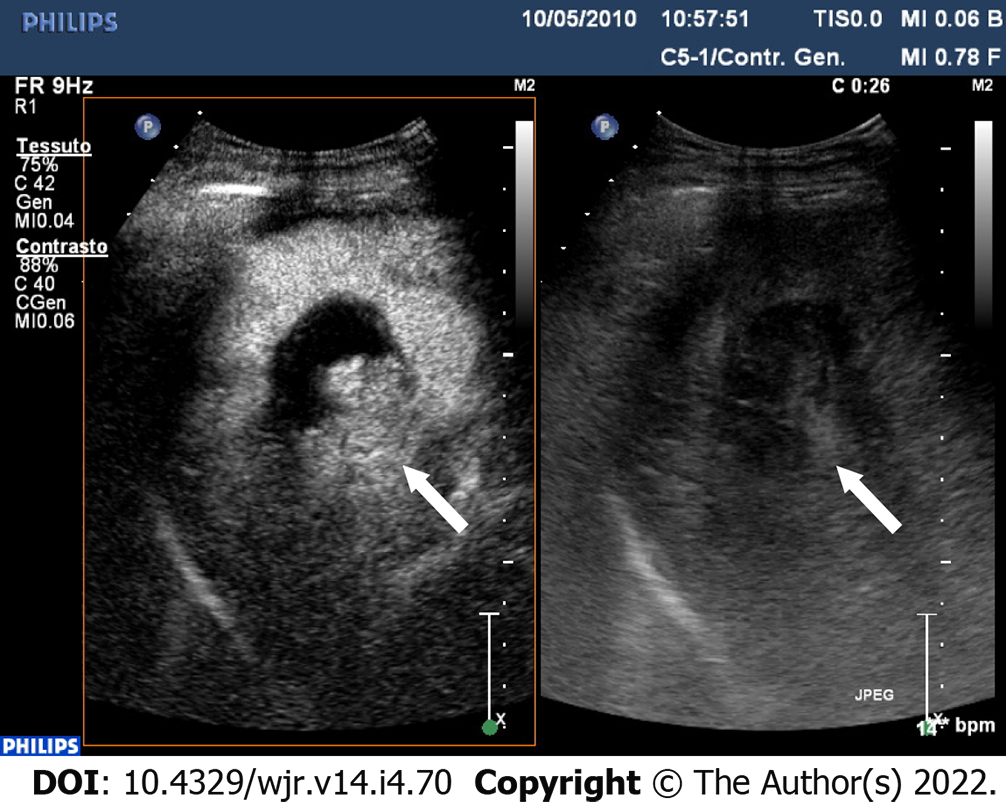
Figure 4 One-month post-procedural assessment of hepatocellular carcinoma after TACE.
Contrast-enhanced ultrasound examination in the arterial phase (26 s after the i.v. injection of contrast agent) shows a clear cut intralesional area of contrast-enhancement indicating still viable tumor.
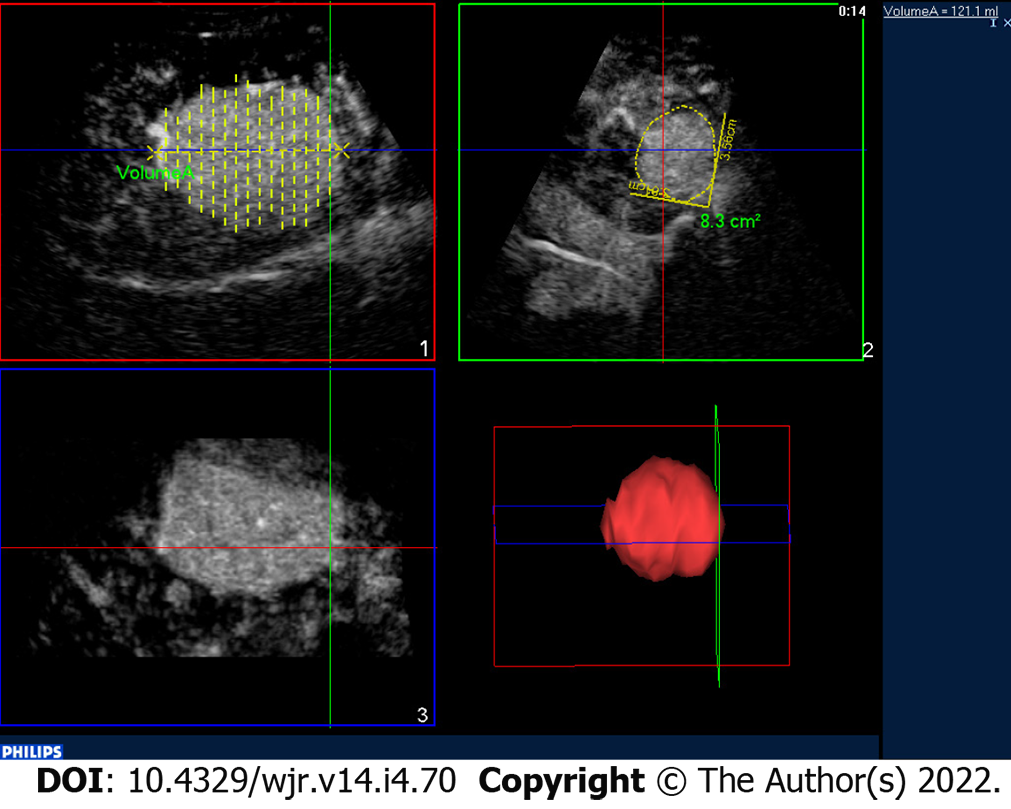
Figure 5 Contrast-enhanced ultrasound 3D.
Contrast-enhanced ultrasound of a hepatocellular carcinoma in the arterial phase: Three-dimensional rendering and volume calculation.
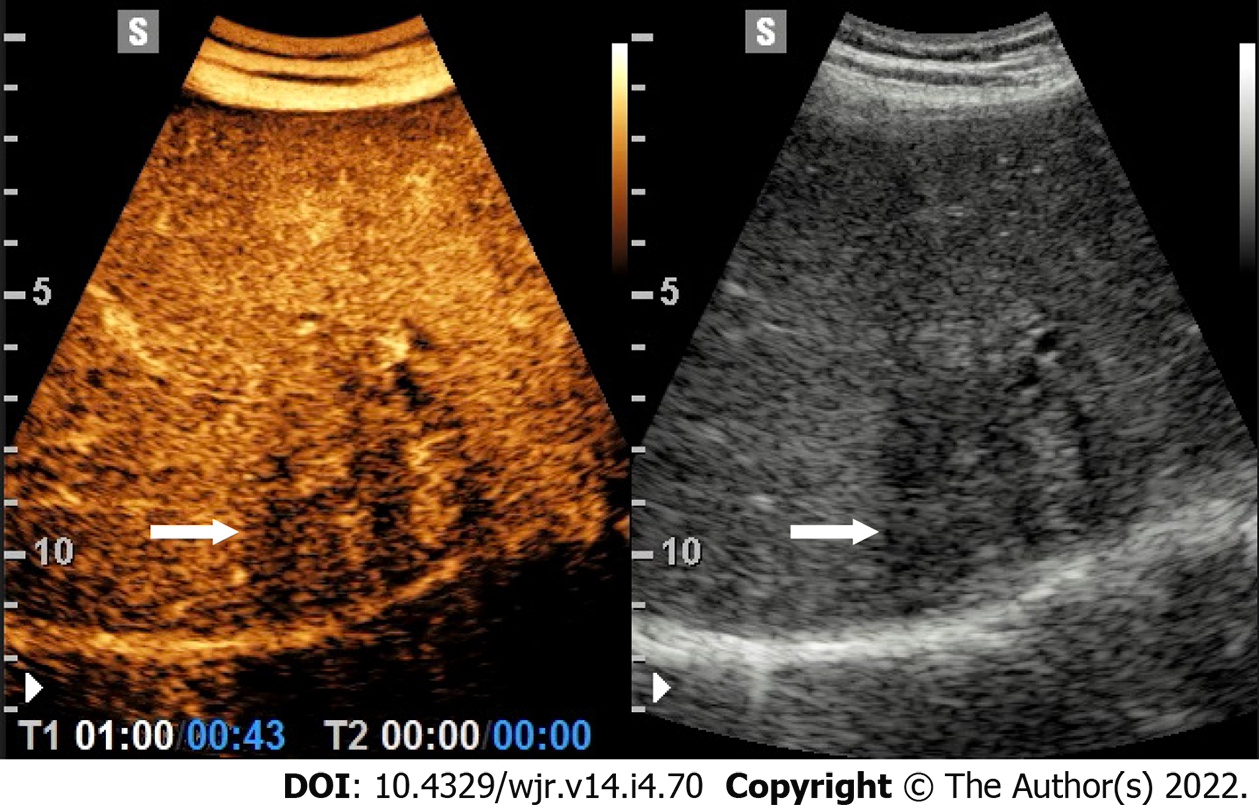
Figure 6 Intrahepatic cholangiocarcinoma.
Contrast-enhanced ultrasound examination in the arterial phase (43 s after the i.v. injection of contrast agent) shows an ill-defined lesion showing heterogeneous washout (left, arrow).
Figure 7 Hemangioma.
A: Contrast-enhanced ultrasound examination in the arterial phase (28 s after the i.v. injection of contrast agent) shows a peripheral globular contrast-enhancement pattern (left, arrow); B: In the portal venous phase (89 s after the injection) a centripetal and complete fill-in is appreciable.
Figure 8 Focal nodular hyperplasia.
A: Contrast-enhanced ultrasound examination in the early arterial phase (16 s after the i.v. injection of contrast agent) shows a spoke-wheel appearance (left, arrow); B: Four seconds later, still in the arterial phase the lesion is homogeneously and strongly enhancing (left, arrow); C: In the late phase (180 s after the injection) the lesion is still slightly hyperechoic to the adjacent liver parenchyma.
- Citation: Bartolotta TV, Randazzo A, Bruno E, Taibbi A. Focal liver lesions in cirrhosis: Role of contrast-enhanced ultrasonography. World J Radiol 2022; 14(4): 70-81
- URL: https://www.wjgnet.com/1949-8470/full/v14/i4/70.htm
- DOI: https://dx.doi.org/10.4329/wjr.v14.i4.70


