Copyright
©The Author(s) 2022.
World J Radiol. Oct 28, 2022; 14(10): 352-366
Published online Oct 28, 2022. doi: 10.4329/wjr.v14.i10.352
Published online Oct 28, 2022. doi: 10.4329/wjr.v14.i10.352
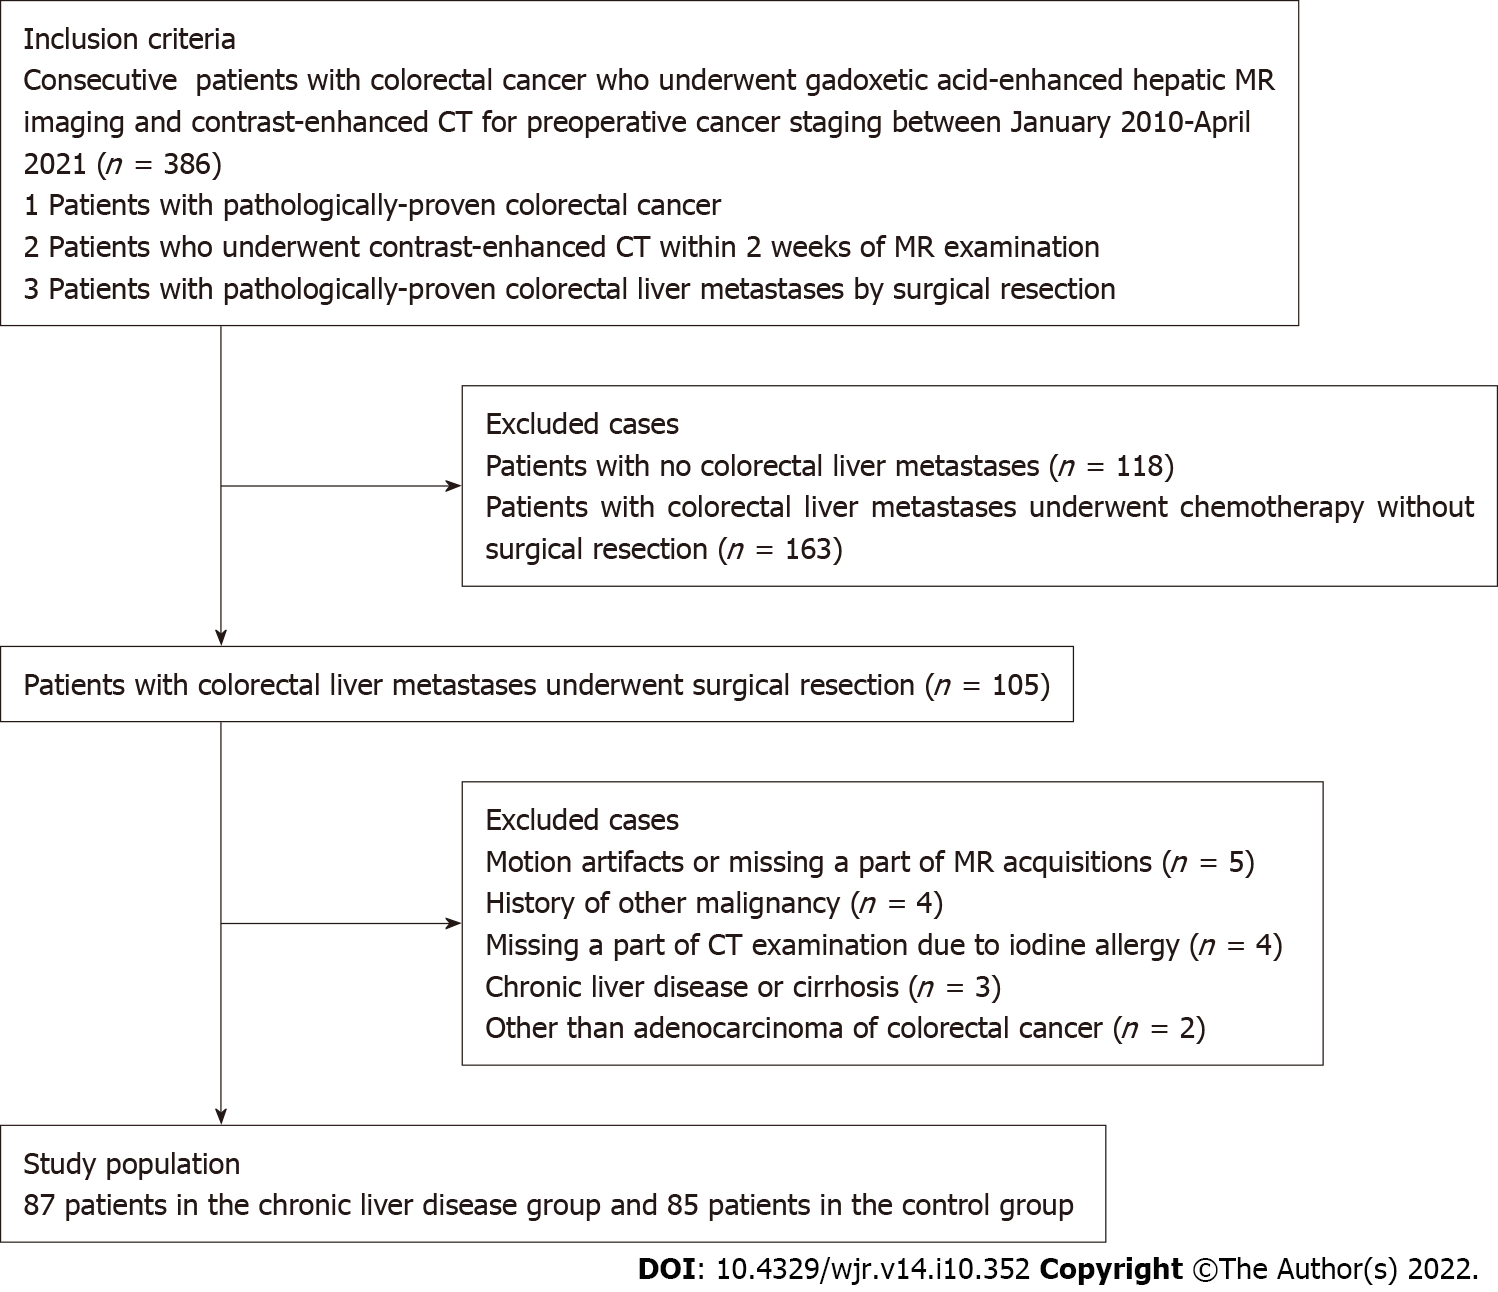
Figure 1 Flowchart of the study population.
MR: Magnetic resonance; CT: Computed tomography.
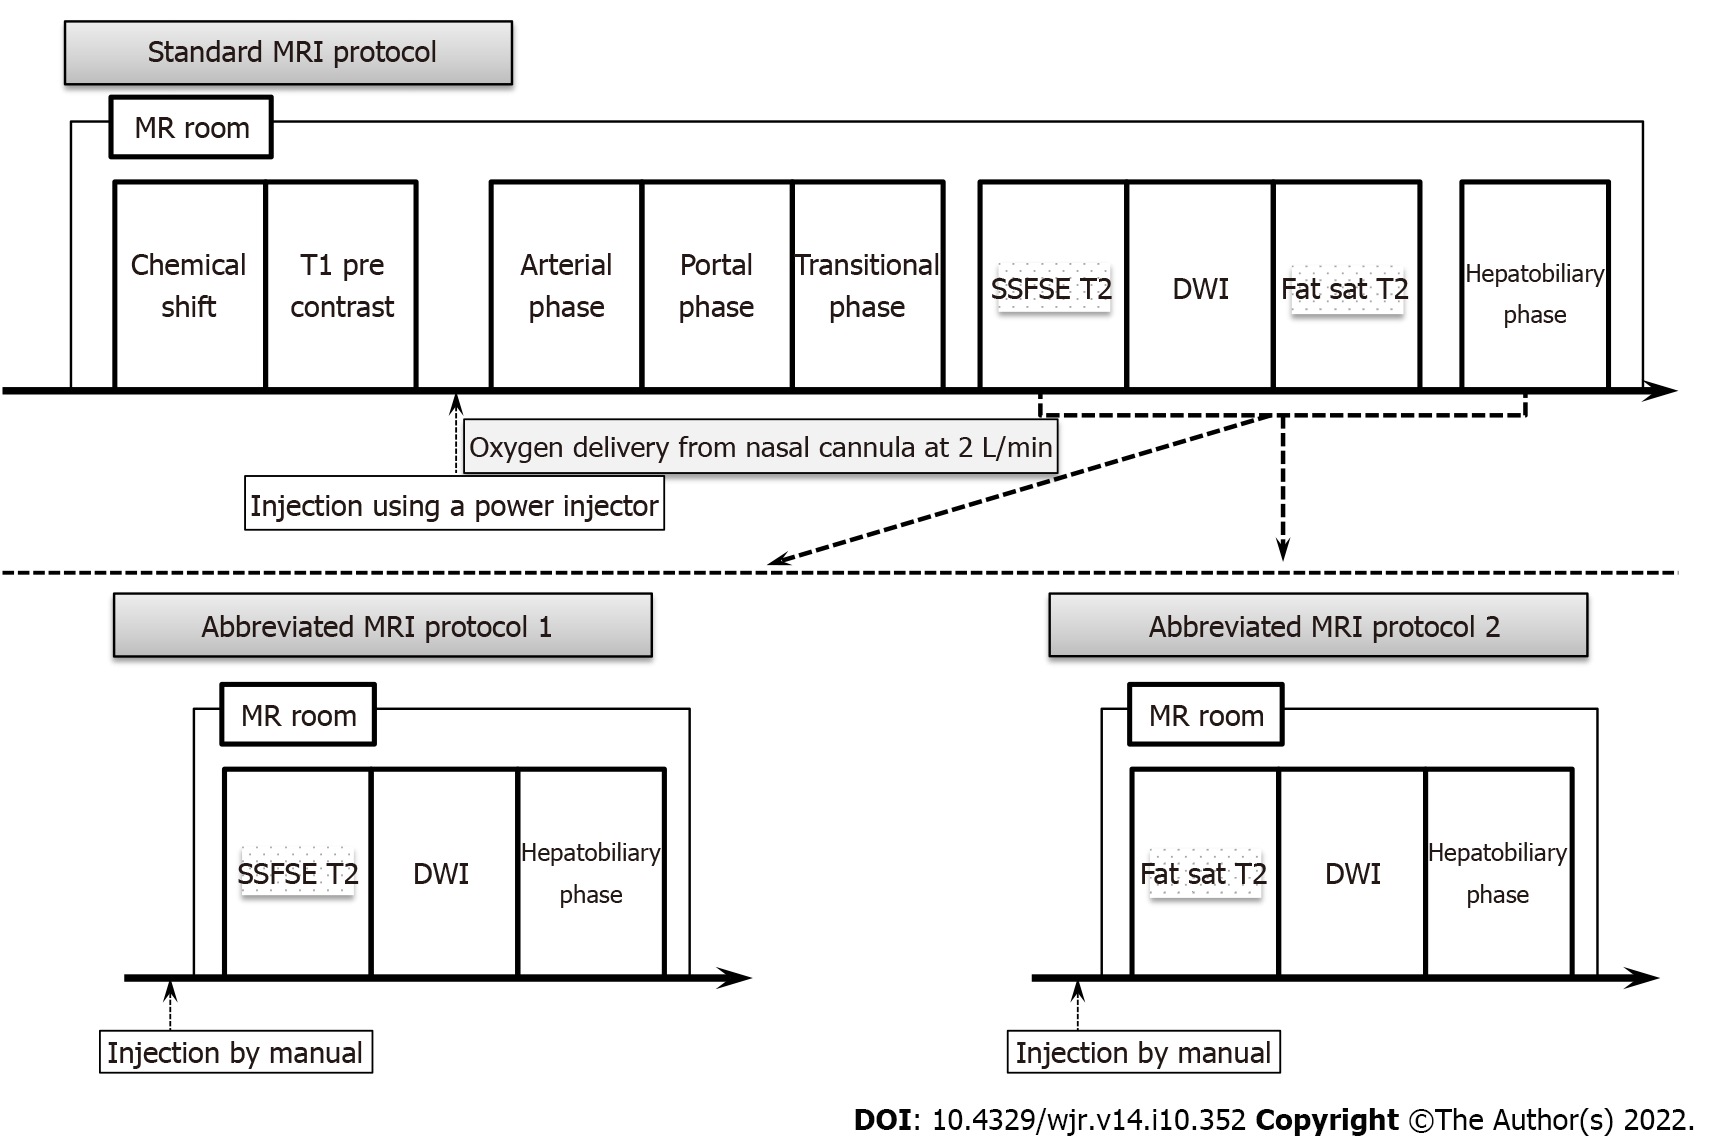
Figure 2 Schematic diagrams of the standard magnetic resonance imaging protocol (upper diagram) and both kinds of simulated abbreviated magnetic resonance imaging protocol (lower diagram).
SSFSE T2: Single-shot fast spin echo T2-weighted imaging; Fat-sat T2: Fat-suppressed T2-weighted imaging; DWI: Diffusion-weighted imaging; MR: Magnetic resonance.
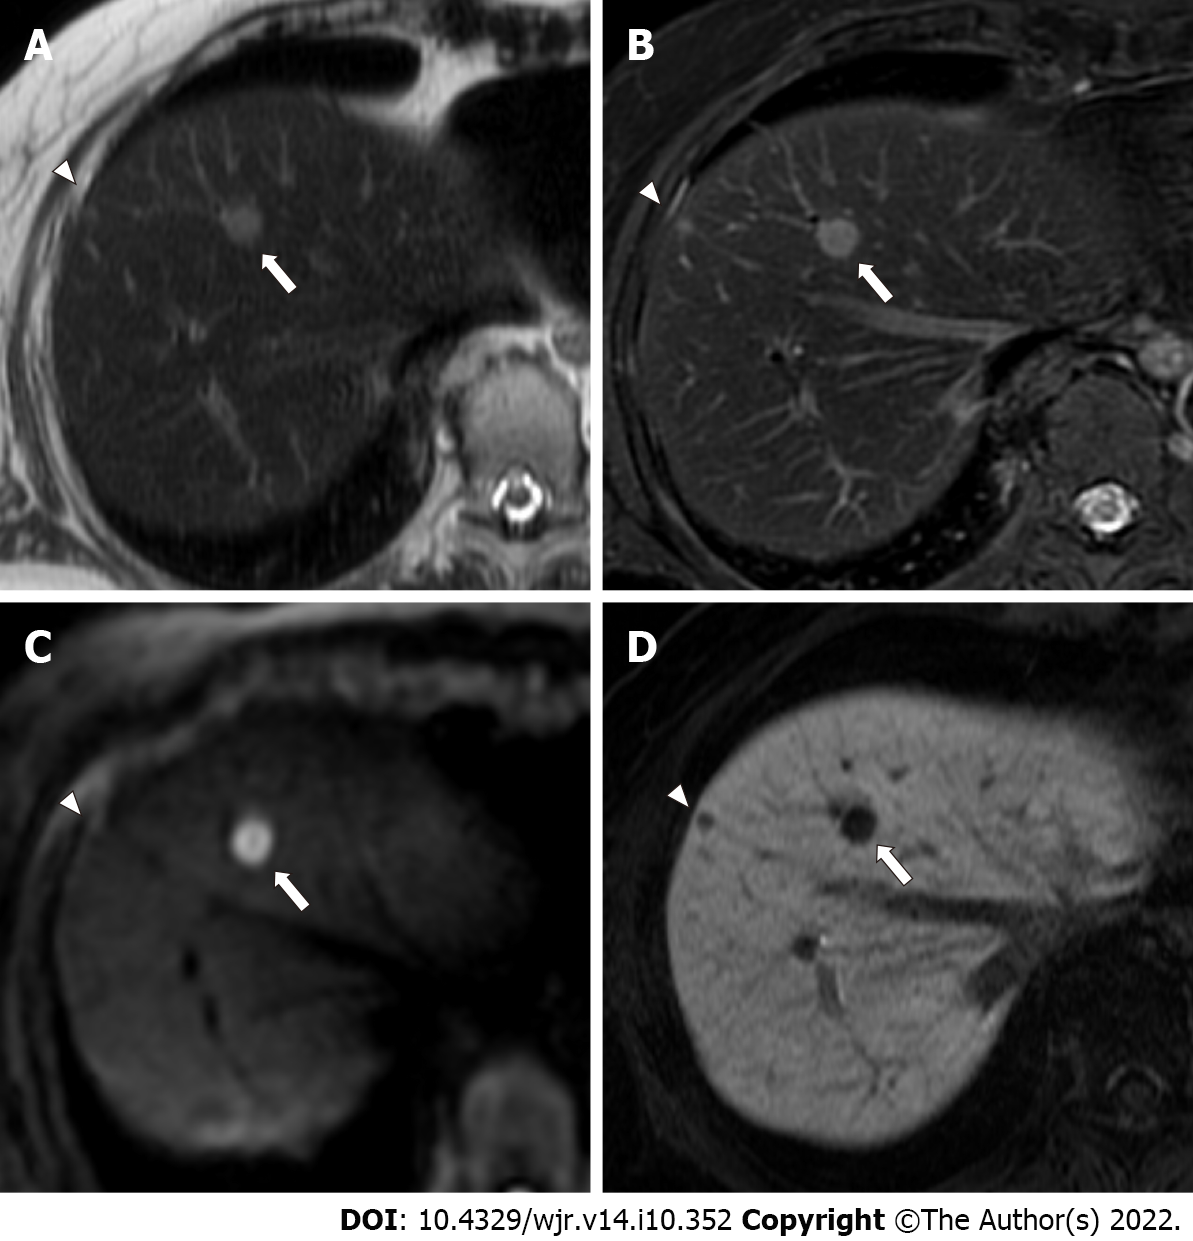
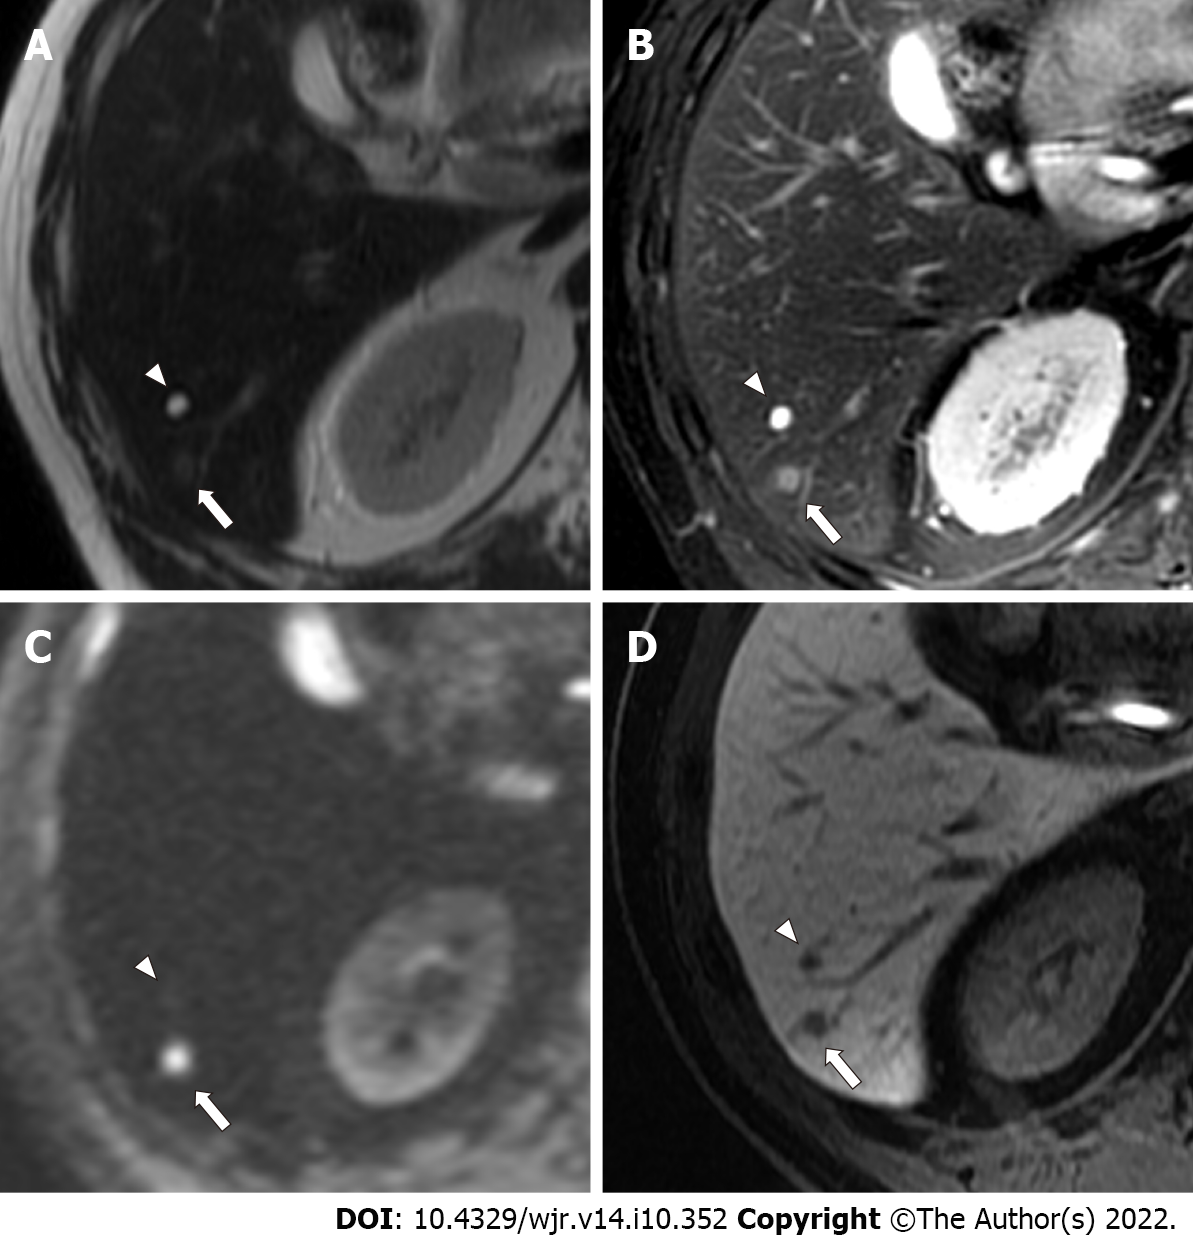
Figure 3 A 54-year-old woman with two colorectal liver metastases in segment 8, with diameters of 9 mm (arrows) and 4 mm (arrowheads).
A: The lager metastasis (arrow) is clearly depicted as an area of hyperintensity, and the smaller metastasis (arrowhead) shows indistinct hyperintensity on single-shot fast spin echo (SSFSE) imaging; B: Lager (arrow) and smaller (arrowhead) metastases are clearly depicted as an area of hyperintensity on fat-suppressed fast spin echo (FSE) T2-weighted imaging; C: The lager metastasis (arrow) is clearly depicted as an area of hyperintensity, and the smaller metastasis (arrowhead) is not depicted on diffusion-weighted imaging (DWI); D: Lager (arrow) and smaller (arrowhead) metastases are clearly depicted as an area of hypointensity on hepatobiliary-phase imaging. Abbreviated magnetic resonance imaging (Ab-MRI) protocol 1 included SSFSE T2-weighted imaging (A), DWI (C), and hepatobiliary-phase imaging (D), whereas abbreviated MRI protocol 2 included fat-suppressed FSE T2-weighted imaging (B), DWI (C), and hepatobiliary phase imaging (D). The lager metastasis (arrows) were scored as 5 by all four readers. The smaller metastasis (arrowheads) was incorrectly scored as 3 or 4 by one of the two readers in Ab-MRI protocols 1 and 2, respectively, and was missed by one reader in Ab-MRI protocol 1.
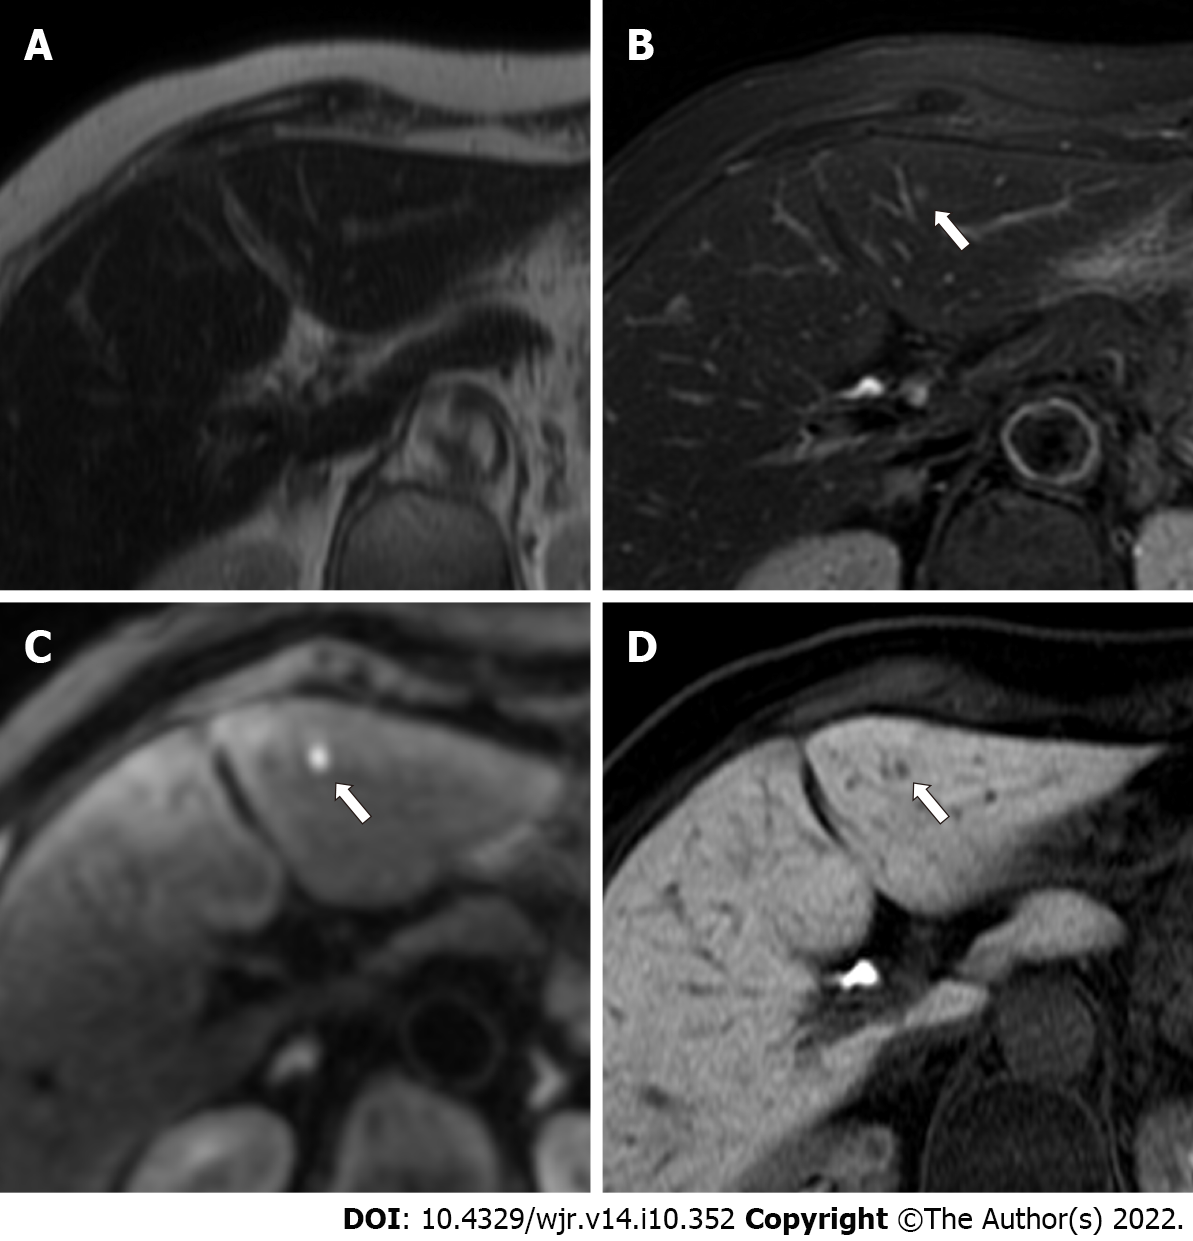
Figure 4 An 86-year-old woman with a colorectal liver metastasis in segment 3, measuring 2.
8 mm in diameter (arrows). A: The metastasis (arrow) appears indistinct on single-shot fast spin echo T2-weighted imaging; B: The metastasis (arrow) appears indistinct on fat-suppressed fast spin echo T2-weighted imaging; C: The metastasis (arrow) is clearly depicted as an area of hyperintensity on diffusion-weighted imaging; D: The metastasis (arrow) is clearly depicted as an area of hypointensity on hepatobiliary-phase imaging. The lesion was scored 4 or 5 by one reader in each abbreviated enhanced magnetic resonance imaging (Ab-MRI) protocol, and was missed by the other reader in Ab-MRI protocol 1 and 2.
Figure 5 A 59-year-old man with a colorectal small liver metastasis (arrows) and a small simple hepatic cyst (arrowheads) that were 4.
1 mm and 5.5 mm, respectively. A: The metastasis (arrow) appears indistinct, whereas the cyst (arrowhead) is clearly depicted as an area of hyperintensity on single-shot fast spin echo T2-weighted imaging; B: The metastasis (arrow) is depicted as mild hyperintensity, and the cyst (arrowhead) is clearly depicted as an area of hyperintensity on fat-suppressed fast spin echo T2-weighted imaging; C: The metastasis (arrow) is clearly depicted as an area of hyperintensity, and the cyst (arrowhead) is not depicted on diffusion-weighted imaging; D: The metastasis (arrow) and the cyst (arrowhead) are clearly depicted as an area of hypointensity on hepatobiliary-phase imaging. The metastasis (arrows) was scored 5 by all four readers. The cyst (arrowheads was scored 1 or 2 by all four readers.
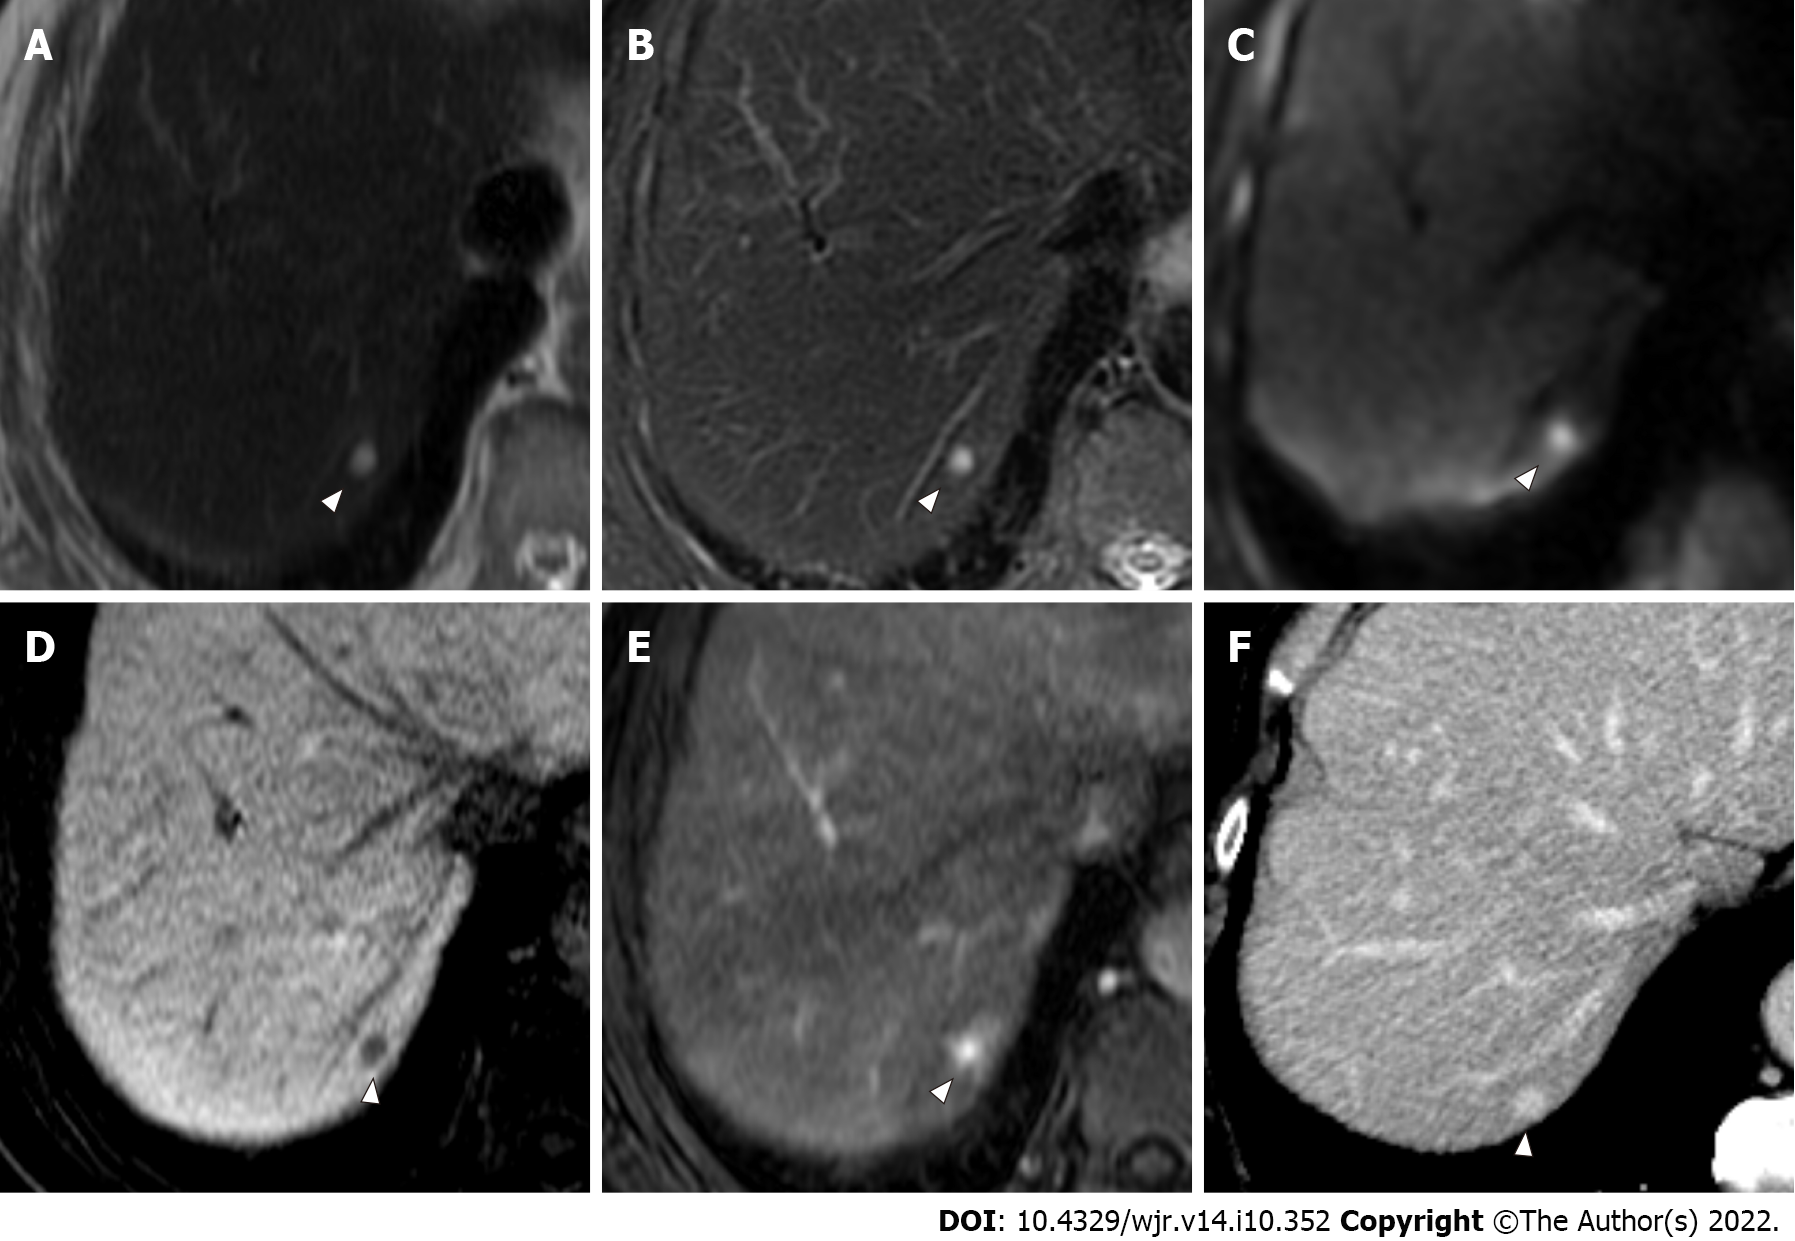
Figure 6 A 70-year-old man with colorectal liver metastasis (not shown) and a hepatic hemangioma in segment 7, which is 4 mm in diameter (arrowheads).
A: The hemangioma (arrowhead) is clearly depicted as an area of hyperintensity on single-shot fast spin echo T2-weighted imaging; B: The hemangioma (arrowhead) is clearly depicted as an area of hyperintensity on fat-suppressed fast spin echo T2-weighted imaging; C: The hemangioma (arrowhead) is clearly depicted as an area of hyperintensity on diffusion-weighted imaging; D: The hemangioma (arrowhead) is clearly depicted as an area of hypointensity on hepatobiliary-phase imaging; E: The characteristic early enhancement accompanying arterio-portal shunt of hemangioma (arrowhead) is depicted on arterial phase magnetic resonance (MR) image; F: The characteristic prolonged enhancement of hemangioma (arrowhead) is depicted on equilibrium phase computed tomography (CT) image. The lesion was incorrectly scored 4 by two readers in abbreviated enhanced magnetic resonance imaging (Ab-MRI) protocol 1, and was scored 4 or 5 by two readers in Ab-MRI protocol 2. The lesion was scored 1 by all four readers in standard MR protocol and the combination of each Ab-MRI and contrast-enhanced CT.
- Citation: Ozaki K, Ishida S, Higuchi S, Sakai T, Kitano A, Takata K, Kinoshita K, Matta Y, Ohtani T, Kimura H, Gabata T. Diagnostic performance of abbreviated gadoxetic acid-enhanced magnetic resonance protocols with contrast-enhanced computed tomography for detection of colorectal liver metastases . World J Radiol 2022; 14(10): 352-366
- URL: https://www.wjgnet.com/1949-8470/full/v14/i10/352.htm
- DOI: https://dx.doi.org/10.4329/wjr.v14.i10.352


