Copyright
©The Author(s) 2021.
World J Radiol. Sep 28, 2021; 13(9): 307-313
Published online Sep 28, 2021. doi: 10.4329/wjr.v13.i9.307
Published online Sep 28, 2021. doi: 10.4329/wjr.v13.i9.307
Figure 1 Head ultrasound through an oblique posterior parietal approach on 3rd day of life.
The figure demonstrates an echogenic mass (arrows) in the posterior fossa, inferior to the tentorium, measuring 1.2 cm in its greatest dimension (A) with flow in the straight sinus and lack of flow on power Doppler within the mass (B).
Figure 2 Axial T2 fluid-attenuated inversion recovery on 4th day of life.
A: A 2.3 cm × 1.7 cm × 2.5 cm rounded thrombus (arrows) and subdural hemorrhage (arrowheads) as well as transverse sinus thrombosis; B: Sagittal T2 demonstrates thrombus (arrow) in posterior fossa superior to cerebellum causing downward mass effect on the cerebellum and fourth ventricle (arrowheads); C, D: Axial diffusion weighted imaging (C) and corresponding ADC map (D) demonstrate diffusion restriction in the corpus callosum (arrowheads), posterior parietal, temporal, and occipital lobes. Other scattered areas of diffusion restriction were noted throughout the brain and brainstem including the pons, cerebellum and posterior frontal lobes (not shown).
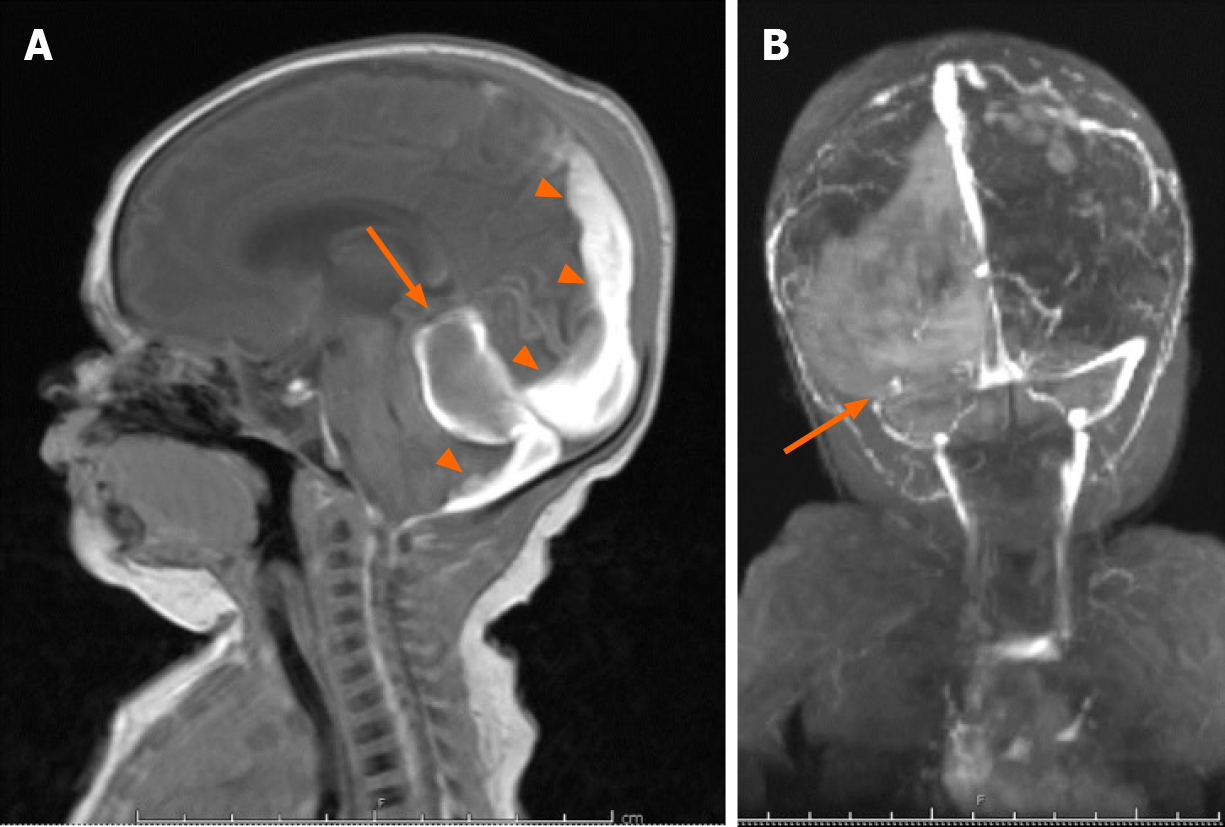
Figure 3 Brain magnetic resonance imaging on 10th day of life.
A: Follow-up brain magnetic resonance imaging on 10th day of life re-demonstrates the posterior fossa mass (arrow), with interval high signal on sagittal T1 consistent with evolving blood products, as well as persistent subdural hematoma (arrowheads); B: PA coronal MRI venography demonstrates absent flow in the transverse sinus consistent with transverse sinus thrombosis.
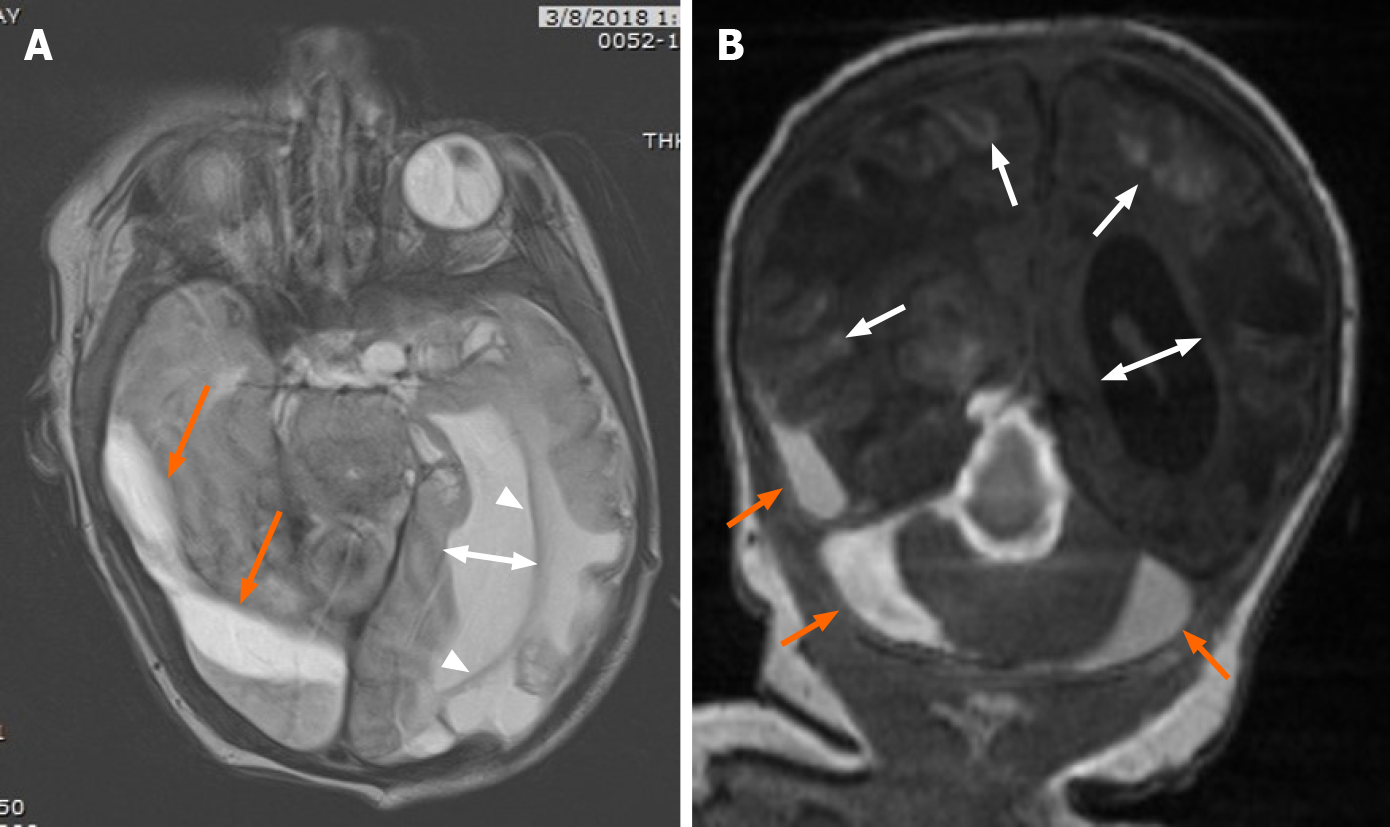
Figure 4 Follow-up magnetic resonance imaging on 20th day of life.
A: Follow-up magnetic resonance imaging on 20th day of life revealed evolving blood products (orange arrows) in the subdural space on axial T2, with interval left greater than right cystic encephalomalacia in the parietal and occipital lobes and left greater than right ex-vacuo dilatation of the lateral ventricles (two direction arrow); B: Coronal T1 demonstrates degrading blood product in the right temporal lobe subdural space, and central and peripheral infratentorial subdural spaces (orange arrows) with cortical laminar necrosis (arrows) and increasing obstructive hydrocephalus (two-direction arrow).
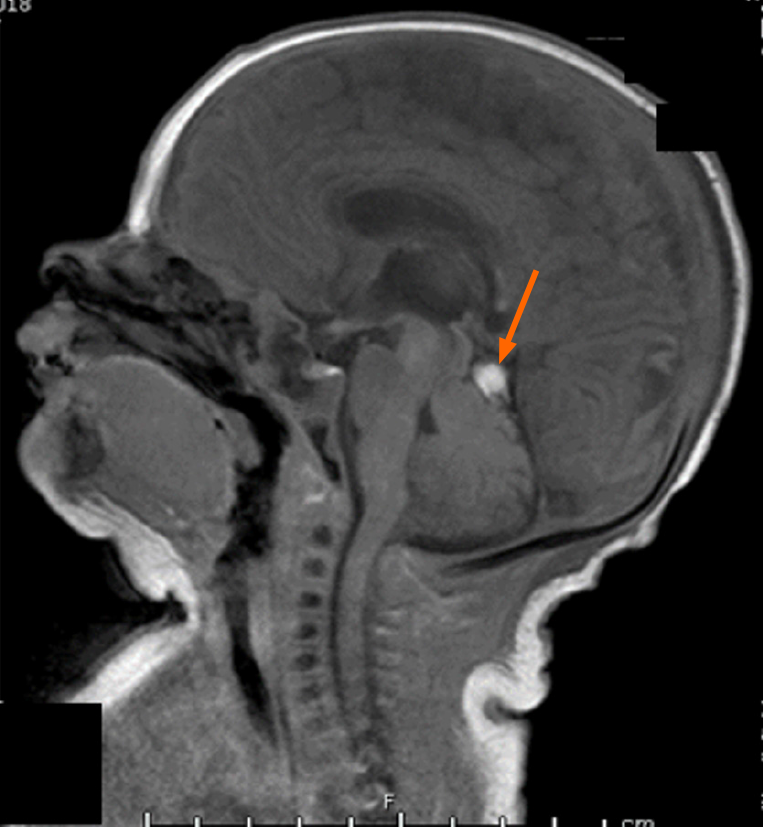
Figure 5
A sagittal T1 magnetic resonance imaging done immediately after subdural hematomas evacuation demonstrates near complete resolution of the subdural hematomas (arrow) and resolution of the obstructive hydrocephalus.
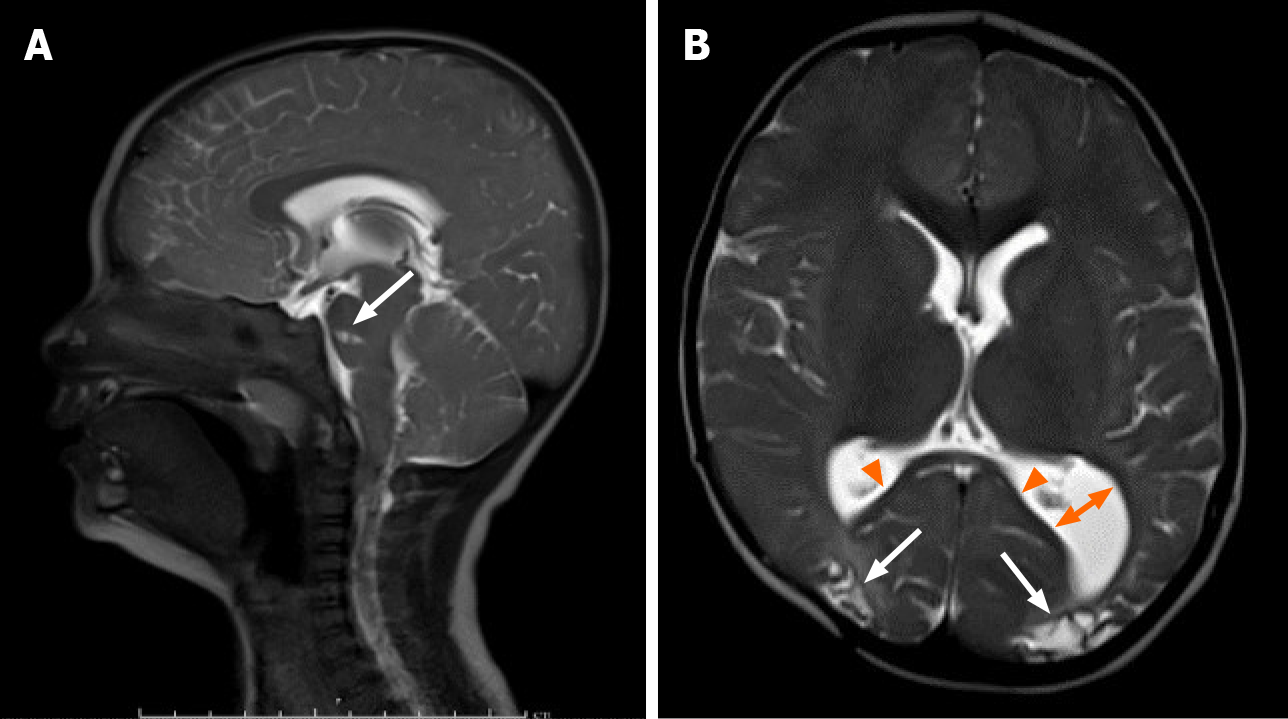
Figure 6 Follow-up magnetic resonance imaging at 15 mo.
A: Follow-up magnetic resonance imaging at 15 mo demonstrates continued resolution of the subdural hematomas and obstructive hydrocephalus on sagittal T2. Note the focal encephalomalacia at the pons (arrow); B: Axial T2 demonstrates encephalomalacic change manifested by thinning of the posterior corpus callosum (arrowheads), decreased gray and white matter of the posterior occipital regions bilaterally (arrows), and colpocephaly of the left lateral ventricle (two direction arrow).
- Citation: Rousslang LK, Rooks EA, Meldrum JT, Hooten KG, Wood JR. Neonatal infratentorial subdural hematoma contributing to obstructive hydrocephalus in the setting of therapeutic cooling: A case report. World J Radiol 2021; 13(9): 307-313
- URL: https://www.wjgnet.com/1949-8470/full/v13/i9/307.htm
- DOI: https://dx.doi.org/10.4329/wjr.v13.i9.307


