Copyright
©The Author(s) 2020.
World J Radiol. Aug 28, 2020; 12(8): 184-194
Published online Aug 28, 2020. doi: 10.4329/wjr.v12.i8.184
Published online Aug 28, 2020. doi: 10.4329/wjr.v12.i8.184
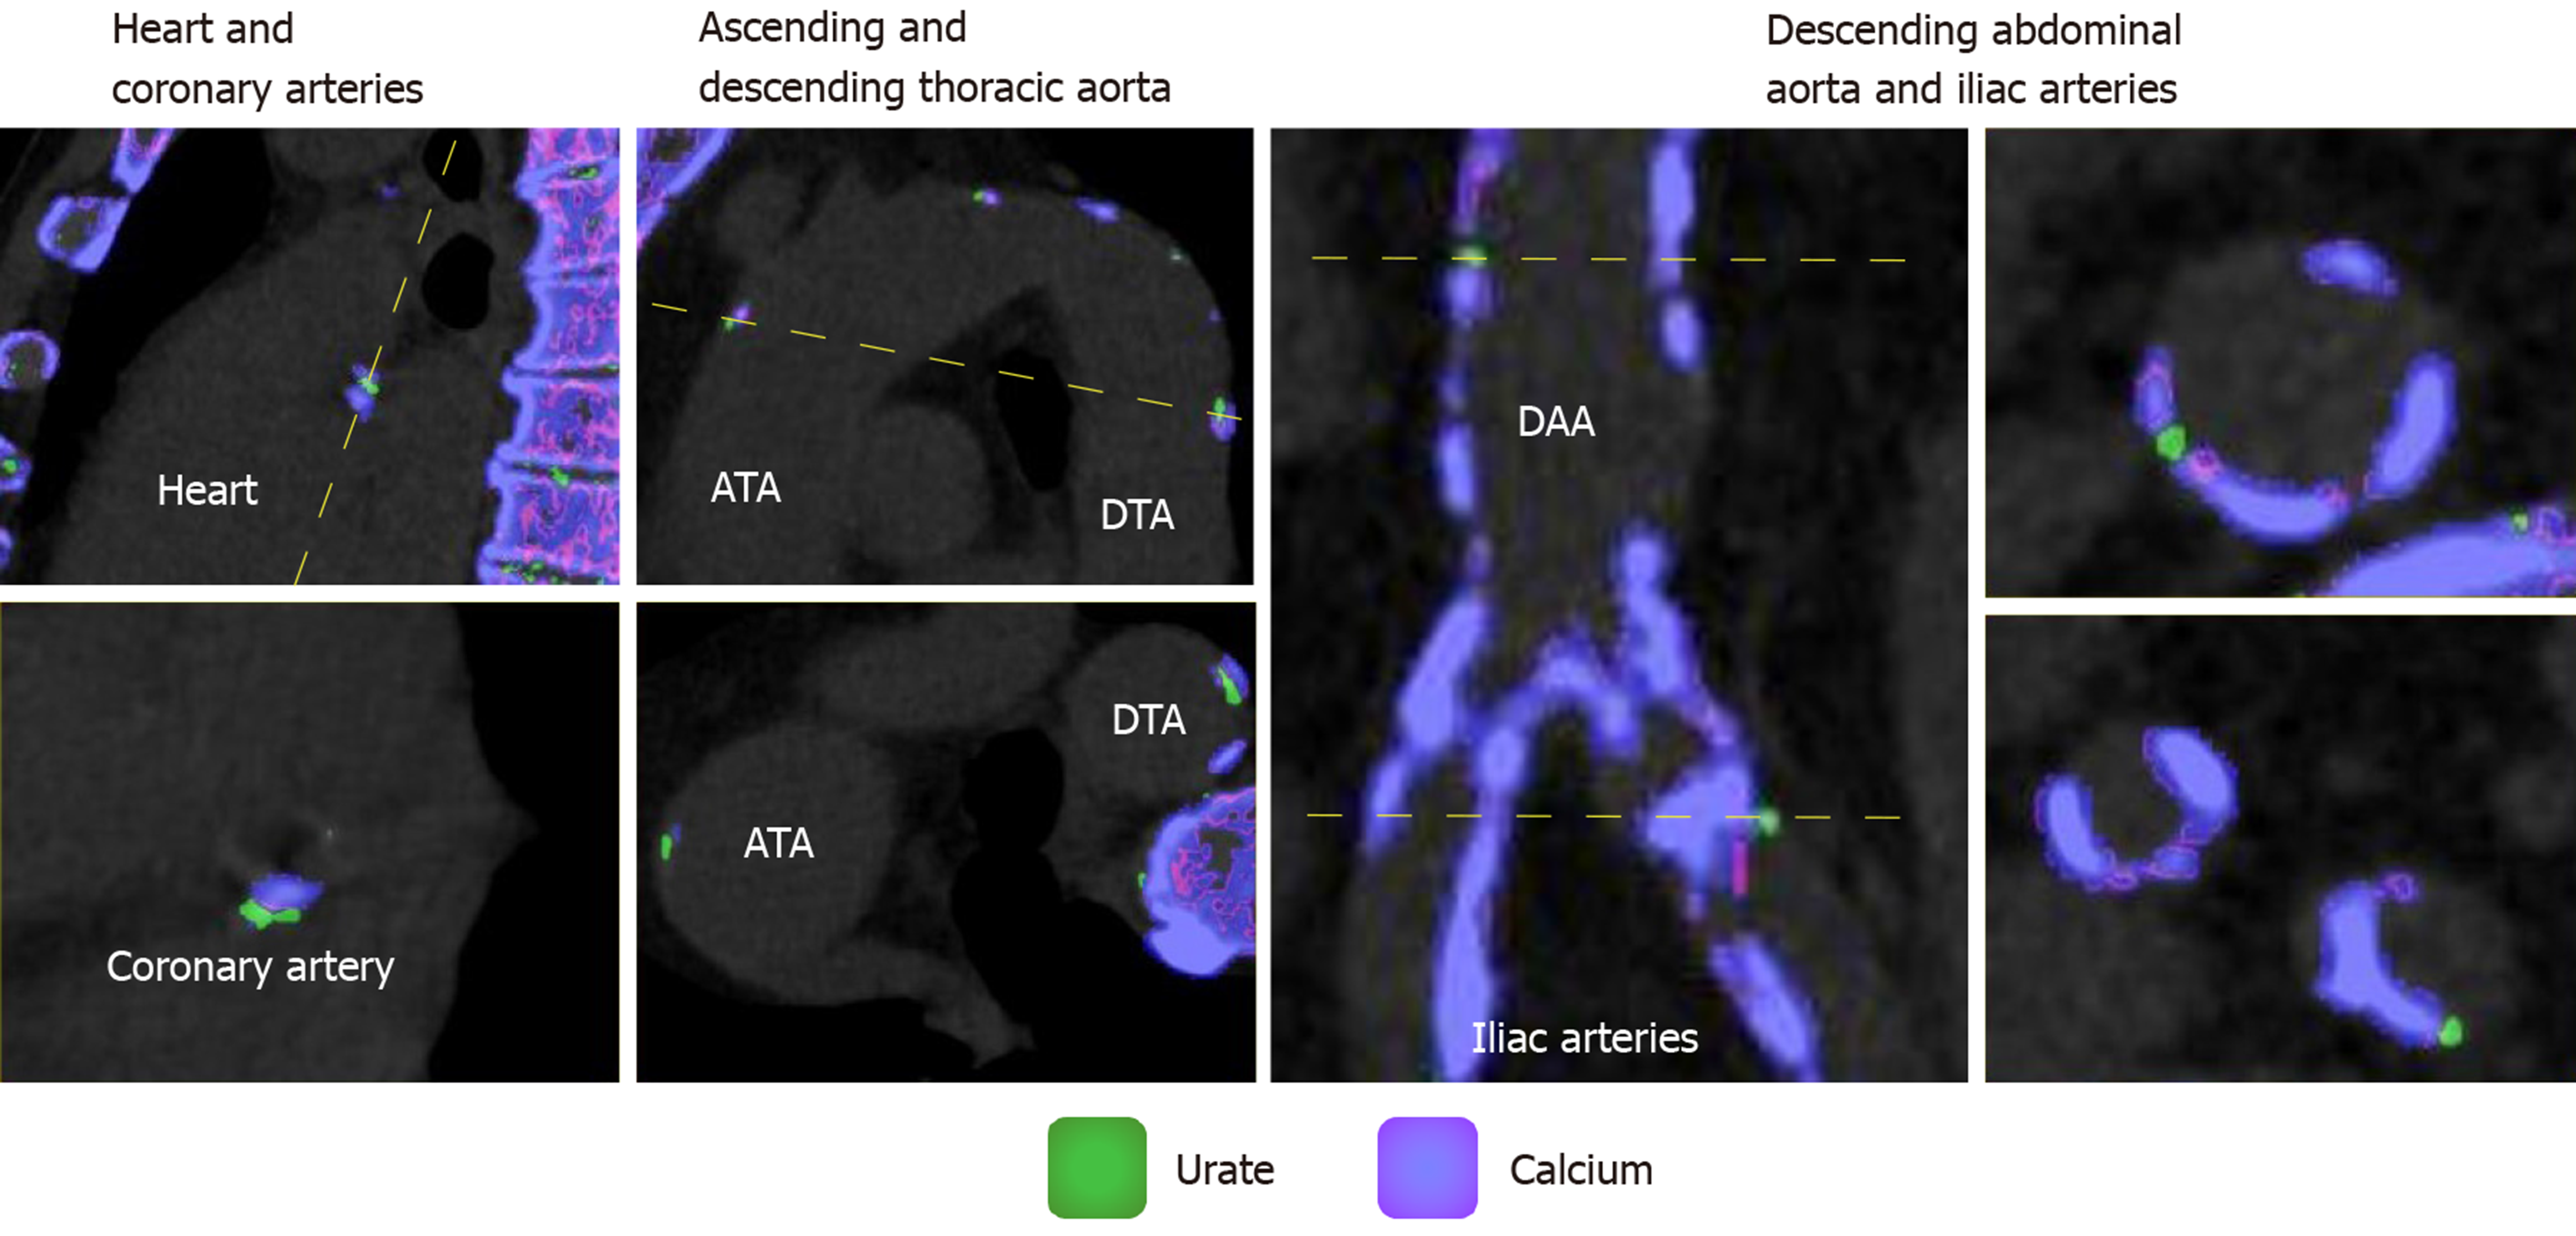
Figure 1 Sample in vivo images of greed coded regions (monosodium urate deposits) within the different vascular territories.
Coronary arteries (left panel), ascending and descending aorta (2nd from left), descending abdominal aorta and iliac arteries (right panels). Monosodium urate deposition is color coded in green whereas calcium is coded in purple/pink. ATA: Ascending thoracic aorta; DTA: Descending thoracic aorta; DAA: Descending abdominal aorta.
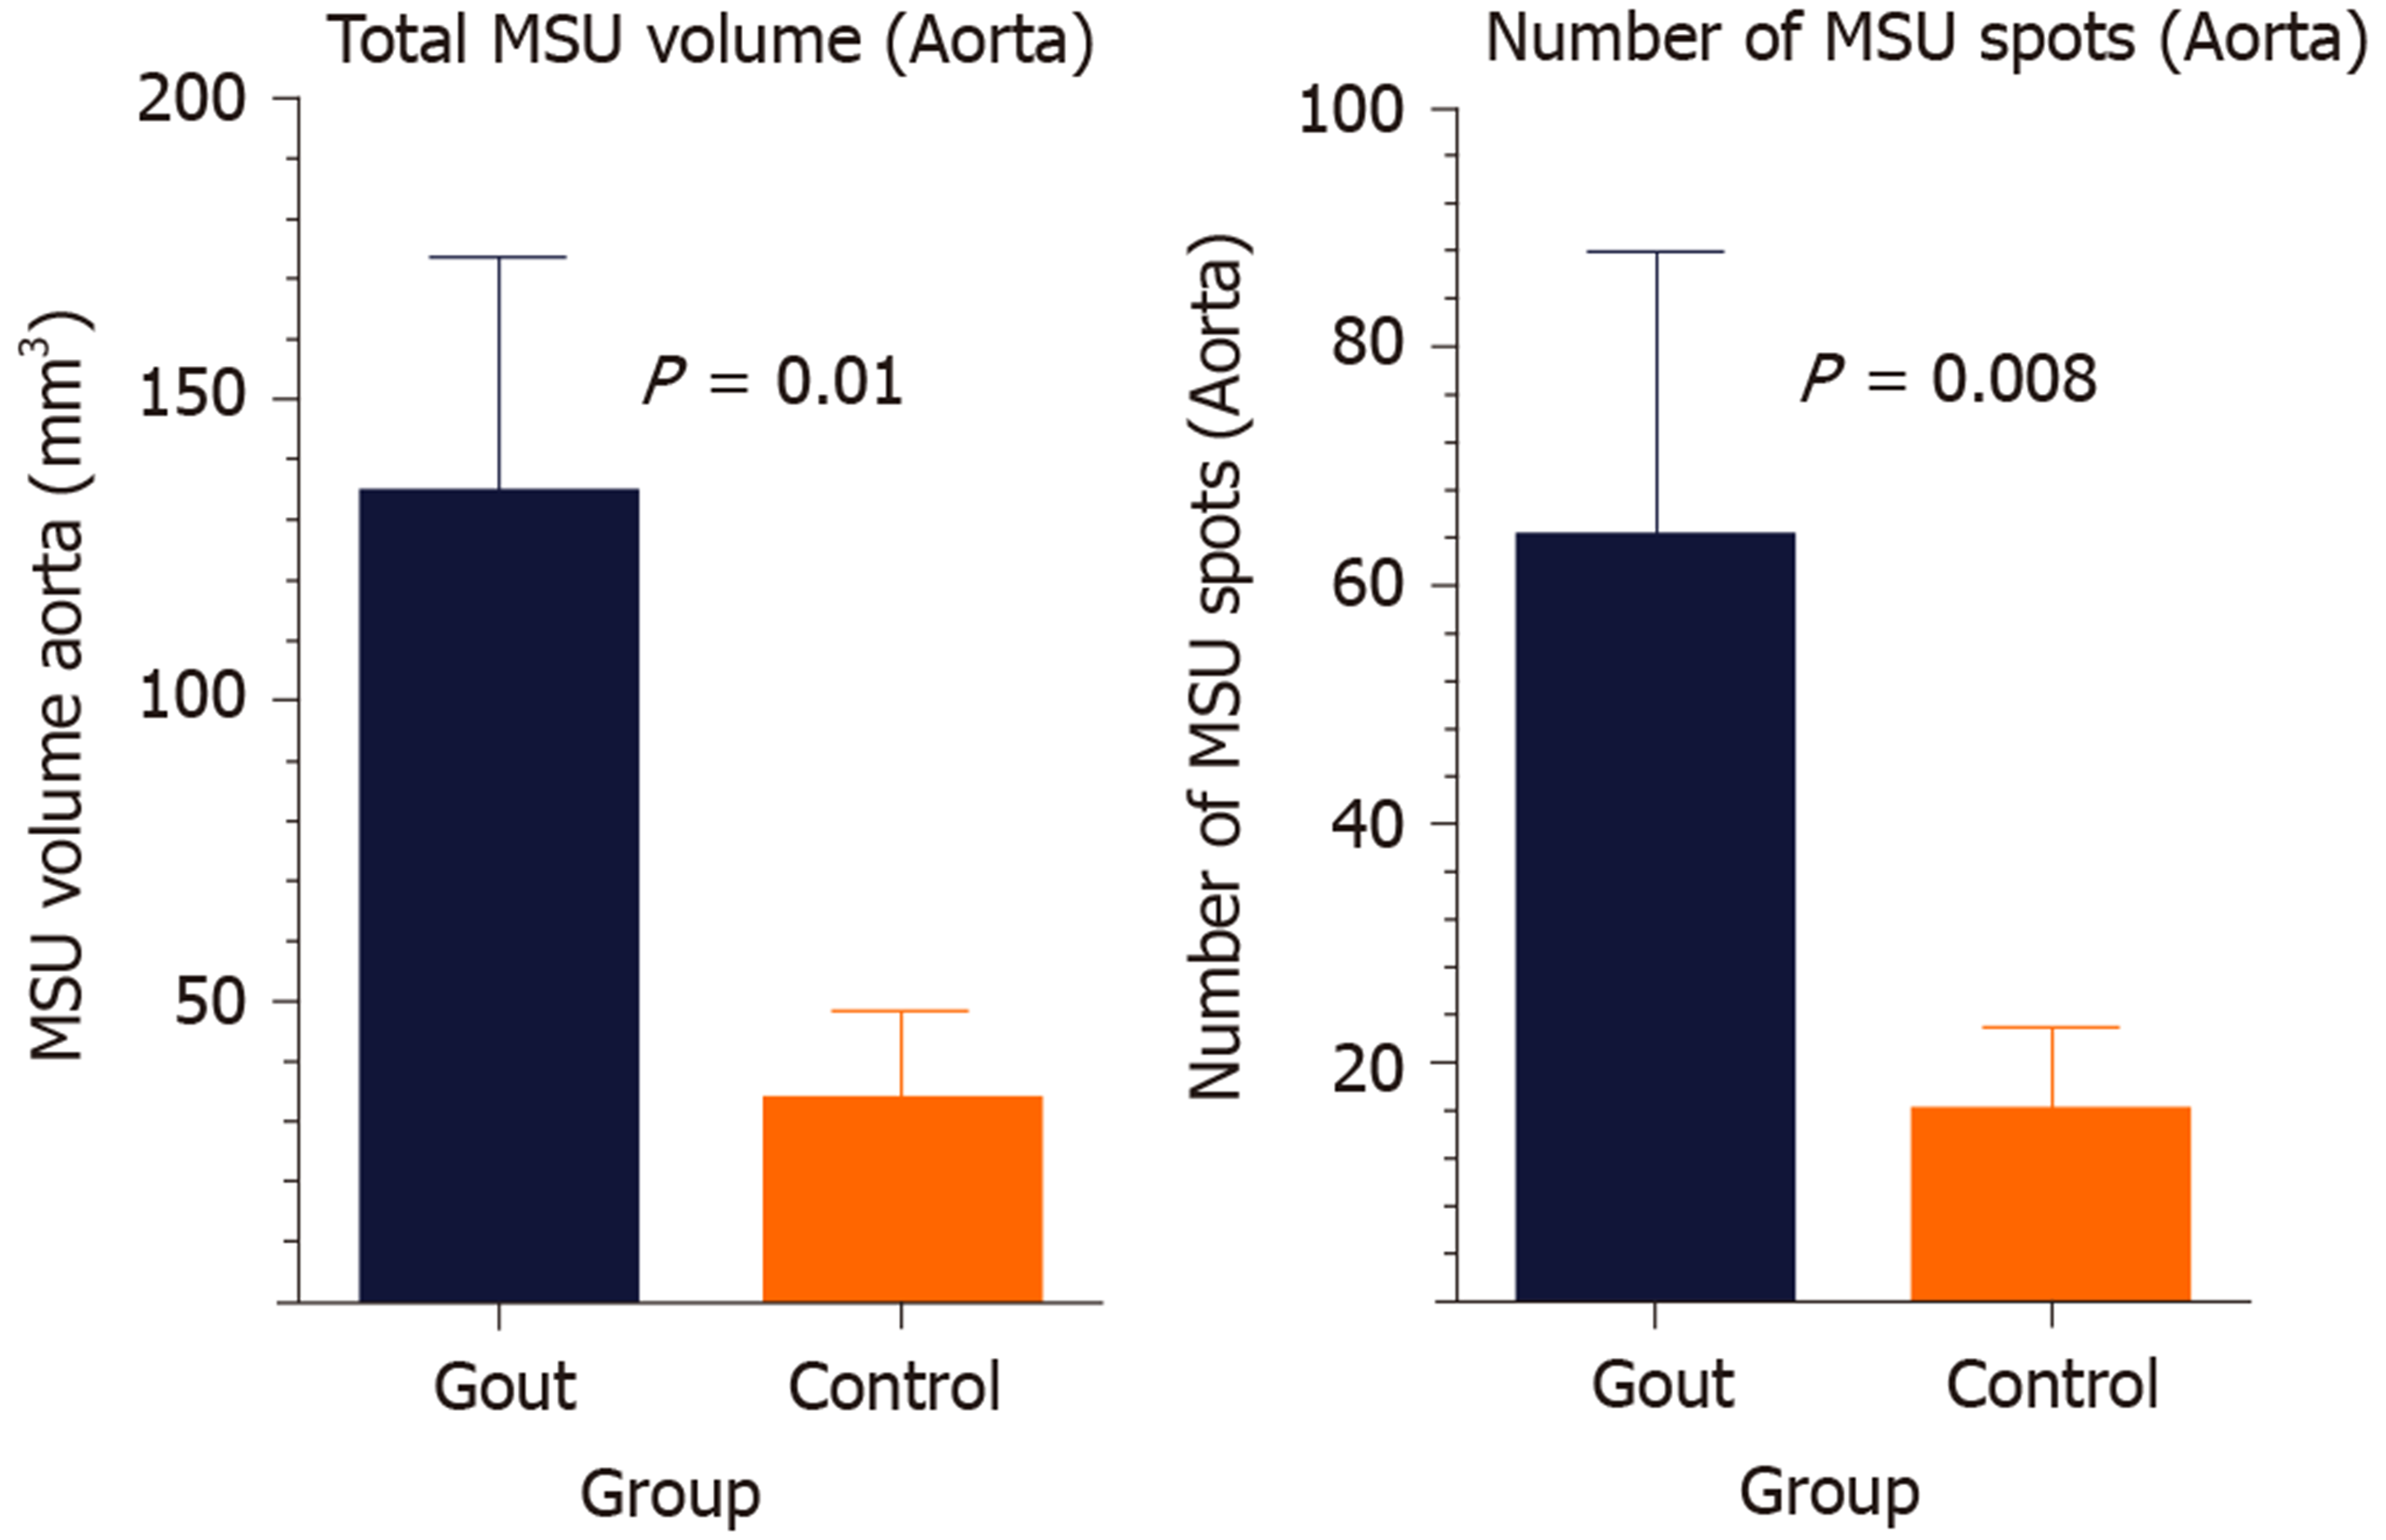
Figure 2 Plots showing total volume of green coded areas (urate deposition) within the aorta (mean ± SD) (Left).
Number of green deposits/spots in the aortas of gout and control subjects (mean ± SD) (Right). MSU: Monosodium urate.
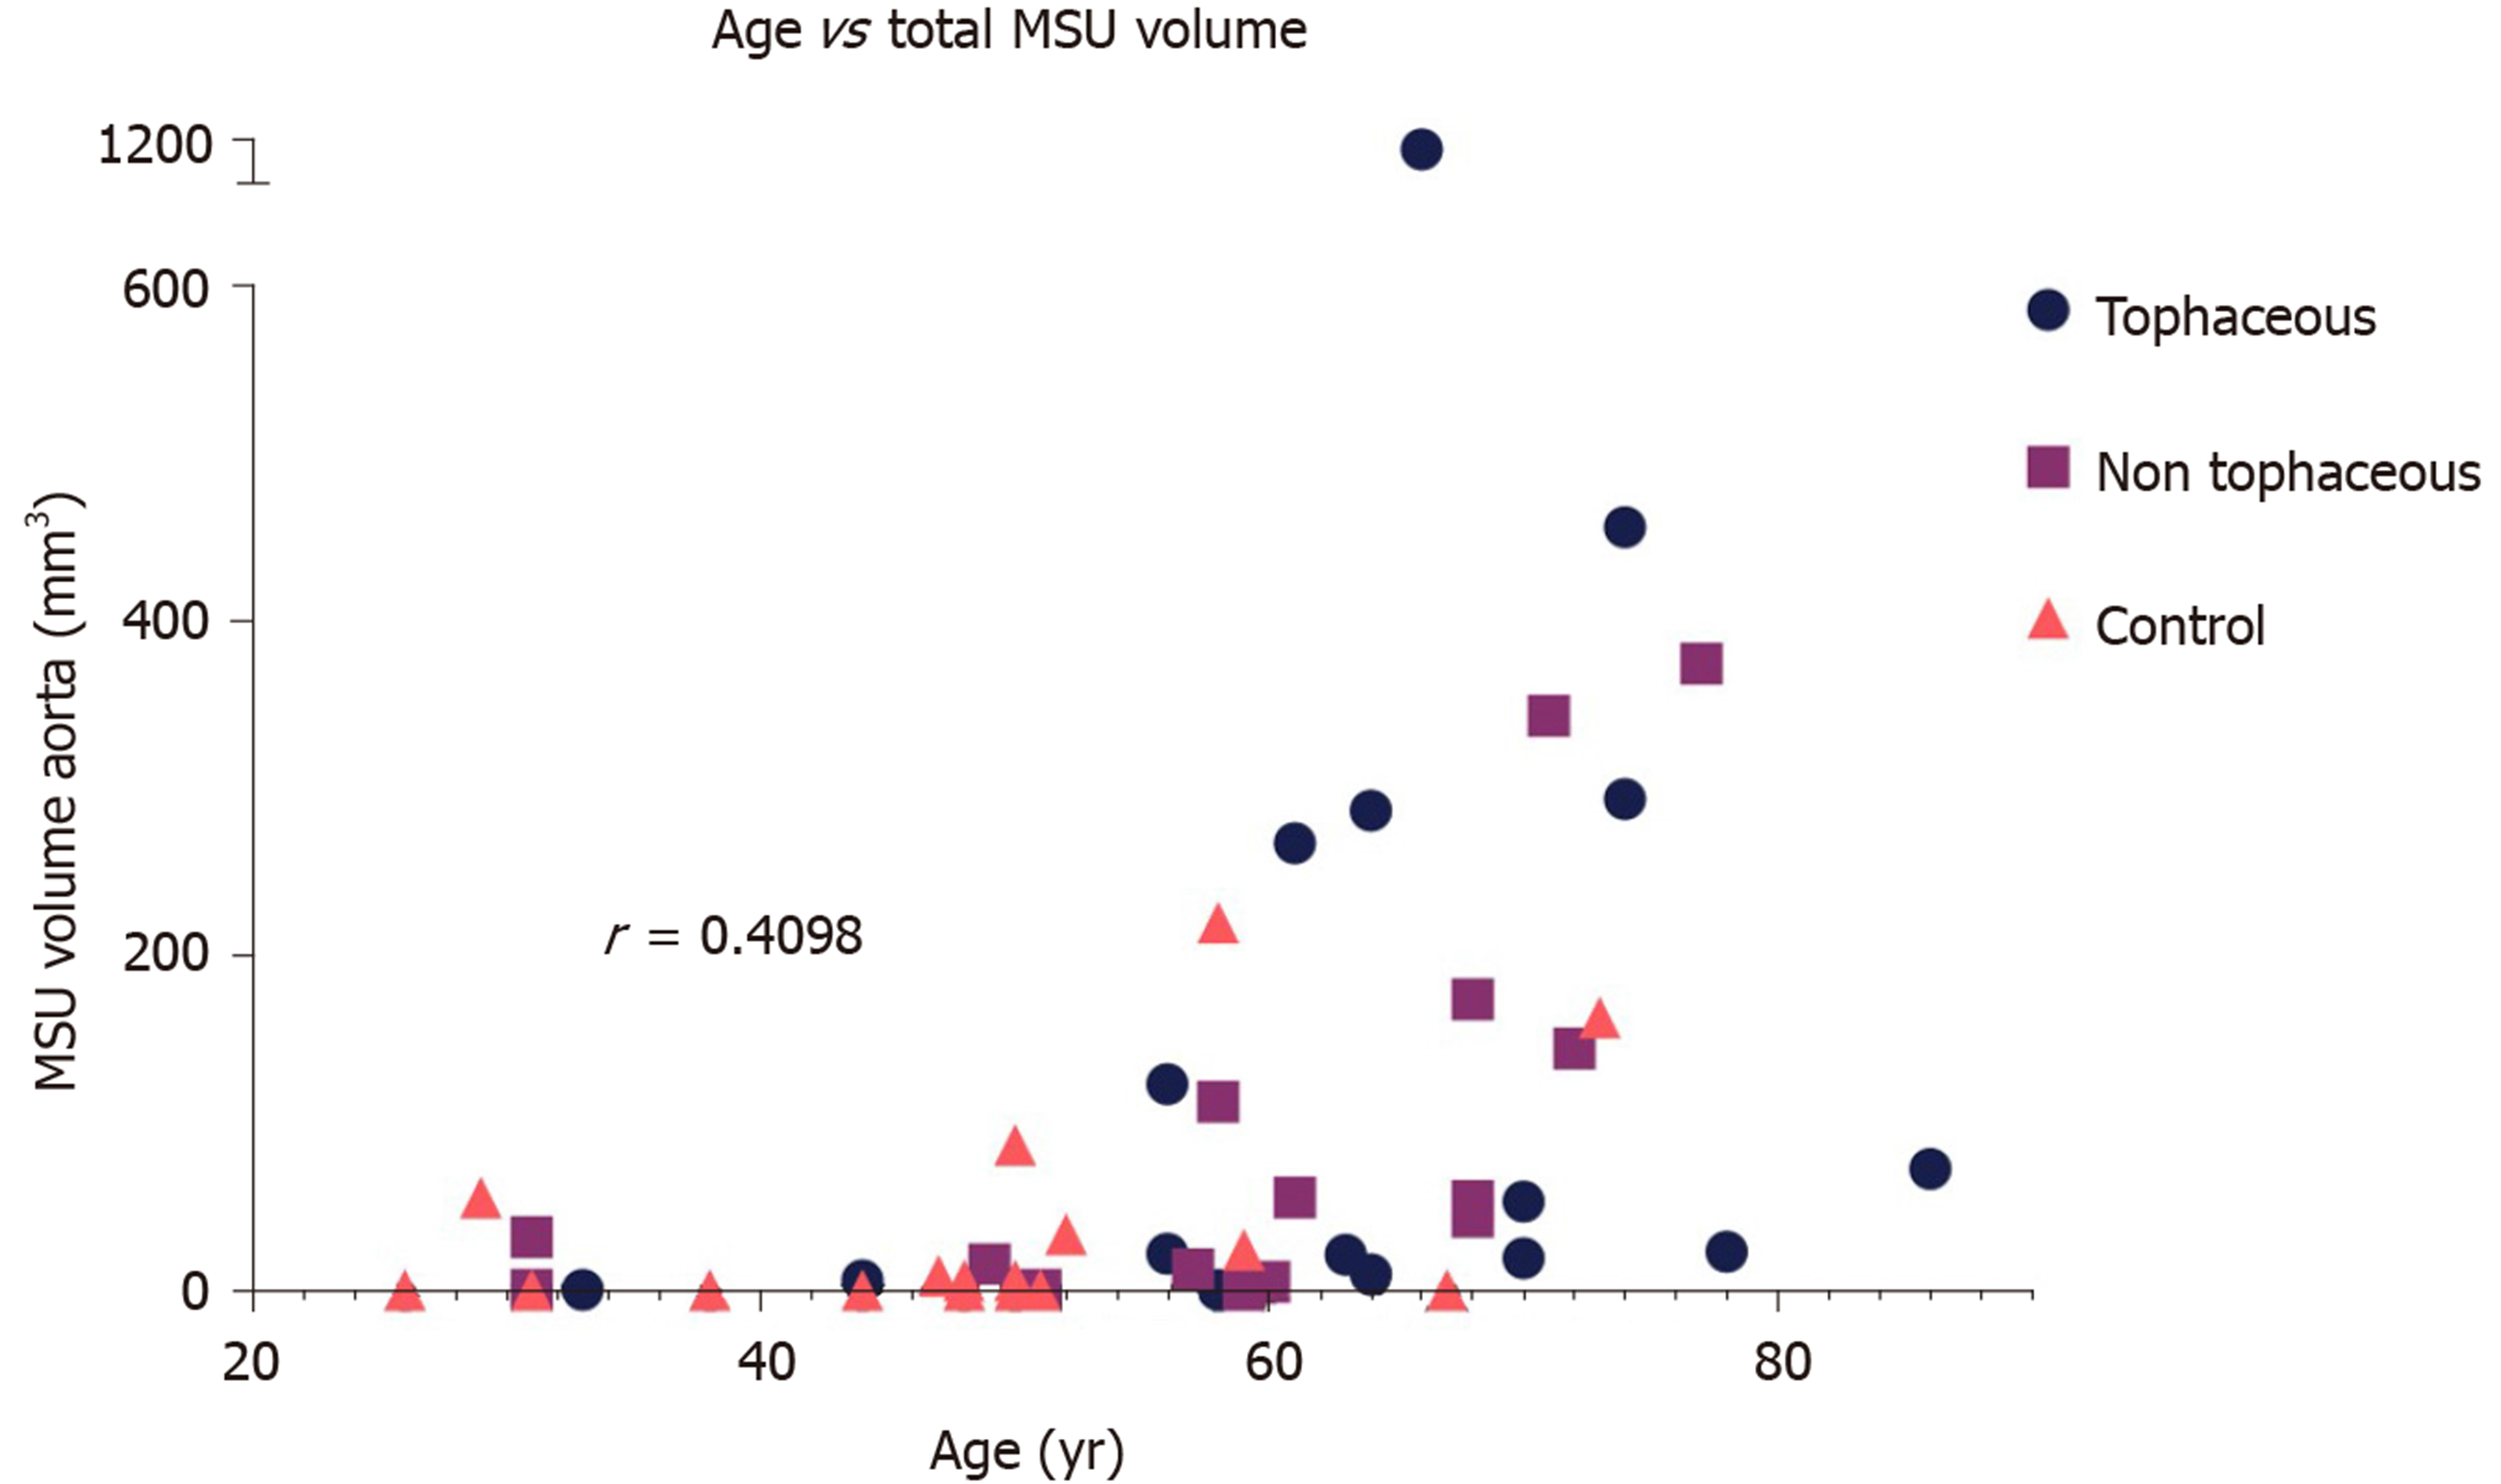
Figure 3 Relationship between age and green coded volumes in the aorta (monosodium urate uptake) across the groups.
The estimated Spearman’s rank correlation coefficient for the two variables was 0.64 (95% confidence interval: 0.43-0.78). MSU: Monosodium urate.
- Citation: Barazani SH, Chi WW, Pyzik R, Chang H, Jacobi A, O’Donnell T, Fayad ZA, Ali Y, Mani V. Quantification of uric acid in vasculature of patients with gout using dual-energy computed tomography. World J Radiol 2020; 12(8): 184-194
- URL: https://www.wjgnet.com/1949-8470/full/v12/i8/184.htm
- DOI: https://dx.doi.org/10.4329/wjr.v12.i8.184


