Copyright
©The Author(s) 2020.
World J Radiol. Aug 28, 2020; 12(8): 172-183
Published online Aug 28, 2020. doi: 10.4329/wjr.v12.i8.172
Published online Aug 28, 2020. doi: 10.4329/wjr.v12.i8.172
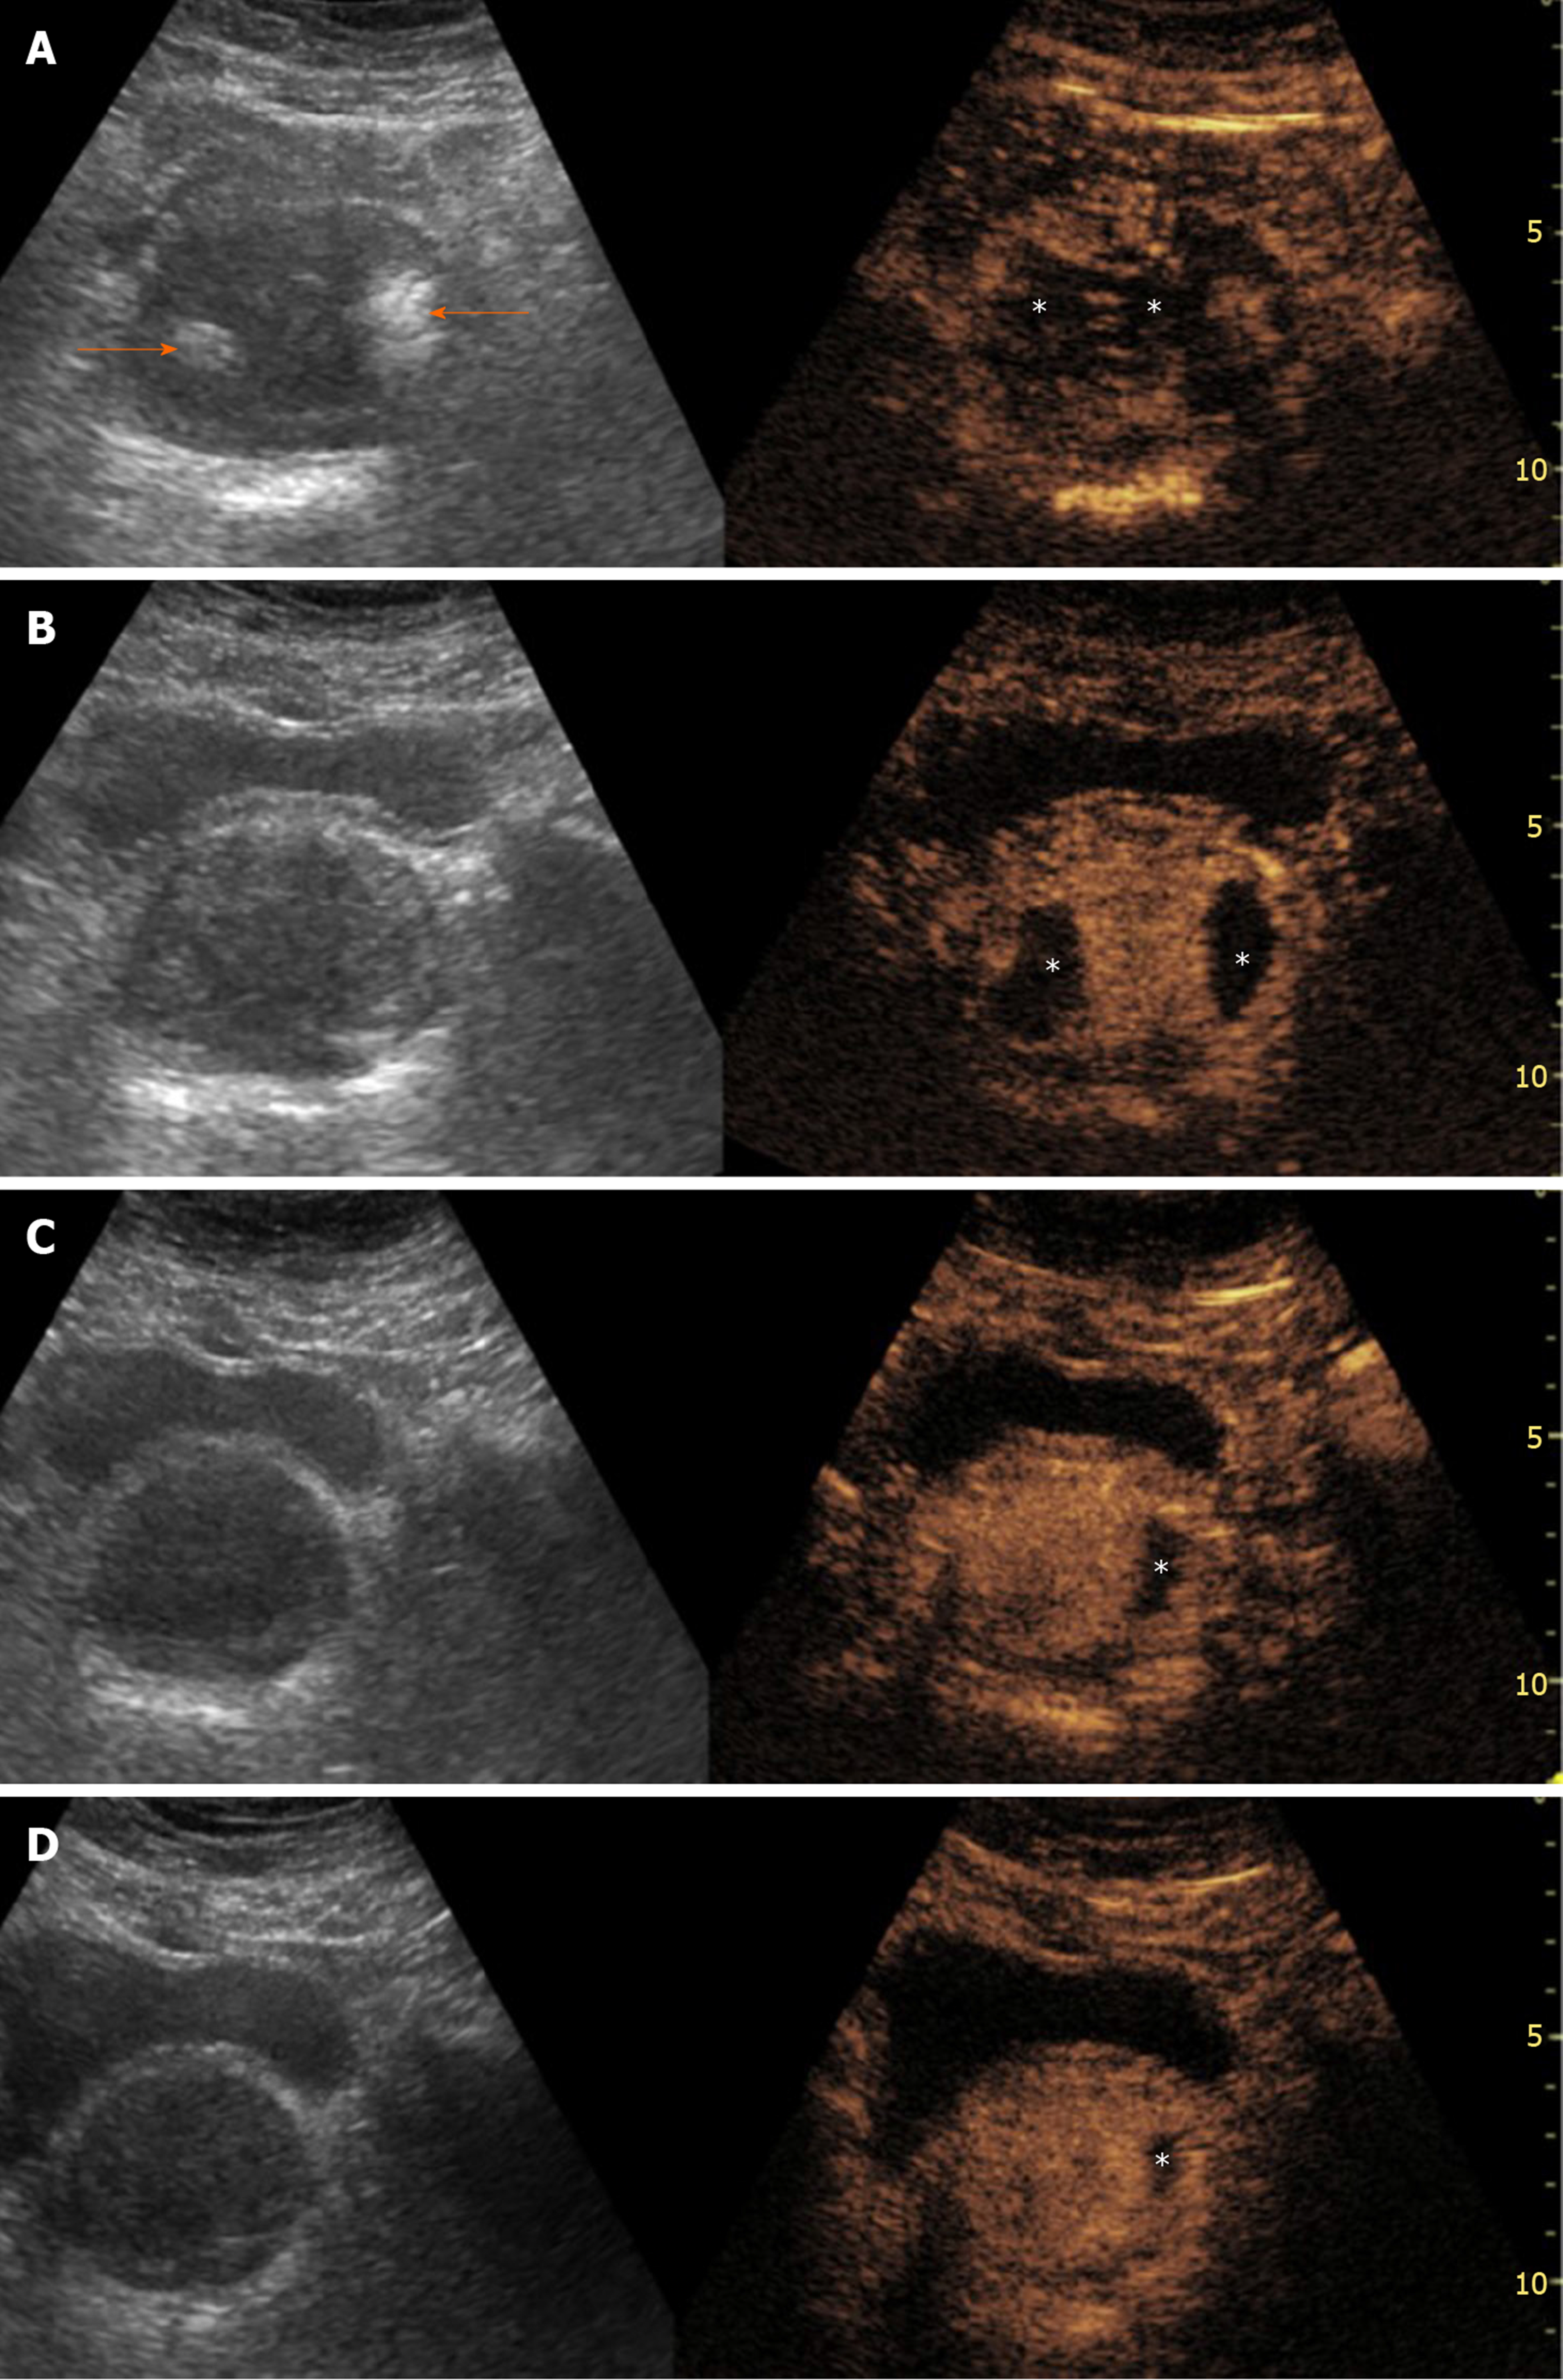
Figure 1 Evolution of ultrasonography and contrast-enhanced ultrasonography findings post-prostatic artery embolization.
Findings are presented in a “split-screen” mode with unenhanced, reference B-mode image on the left, and corresponding contrast-enhanced ultrasonography (CEUS) image on the right. A: One day post-prostatic artery embolization (PAE), transabdominal US (t.a.-US) shows newly appearing echogenic foci, in both prostatic lobes (arrows). t.a.-CEUS shows extensive bilateral prostatic infarction; B: One month post-PAE, the echogenic foci have disappeared and prostatic infarcts are better delineated and smaller in size; C and D: Evaluation 6 and 12 mo post-PAE, respectively, shows that infarcts are diminished or have disappeared and prostate shrinkage can be appreciated. Asterisks indicate prostatic infarcts in all CEUS images. All images are in axial plane.
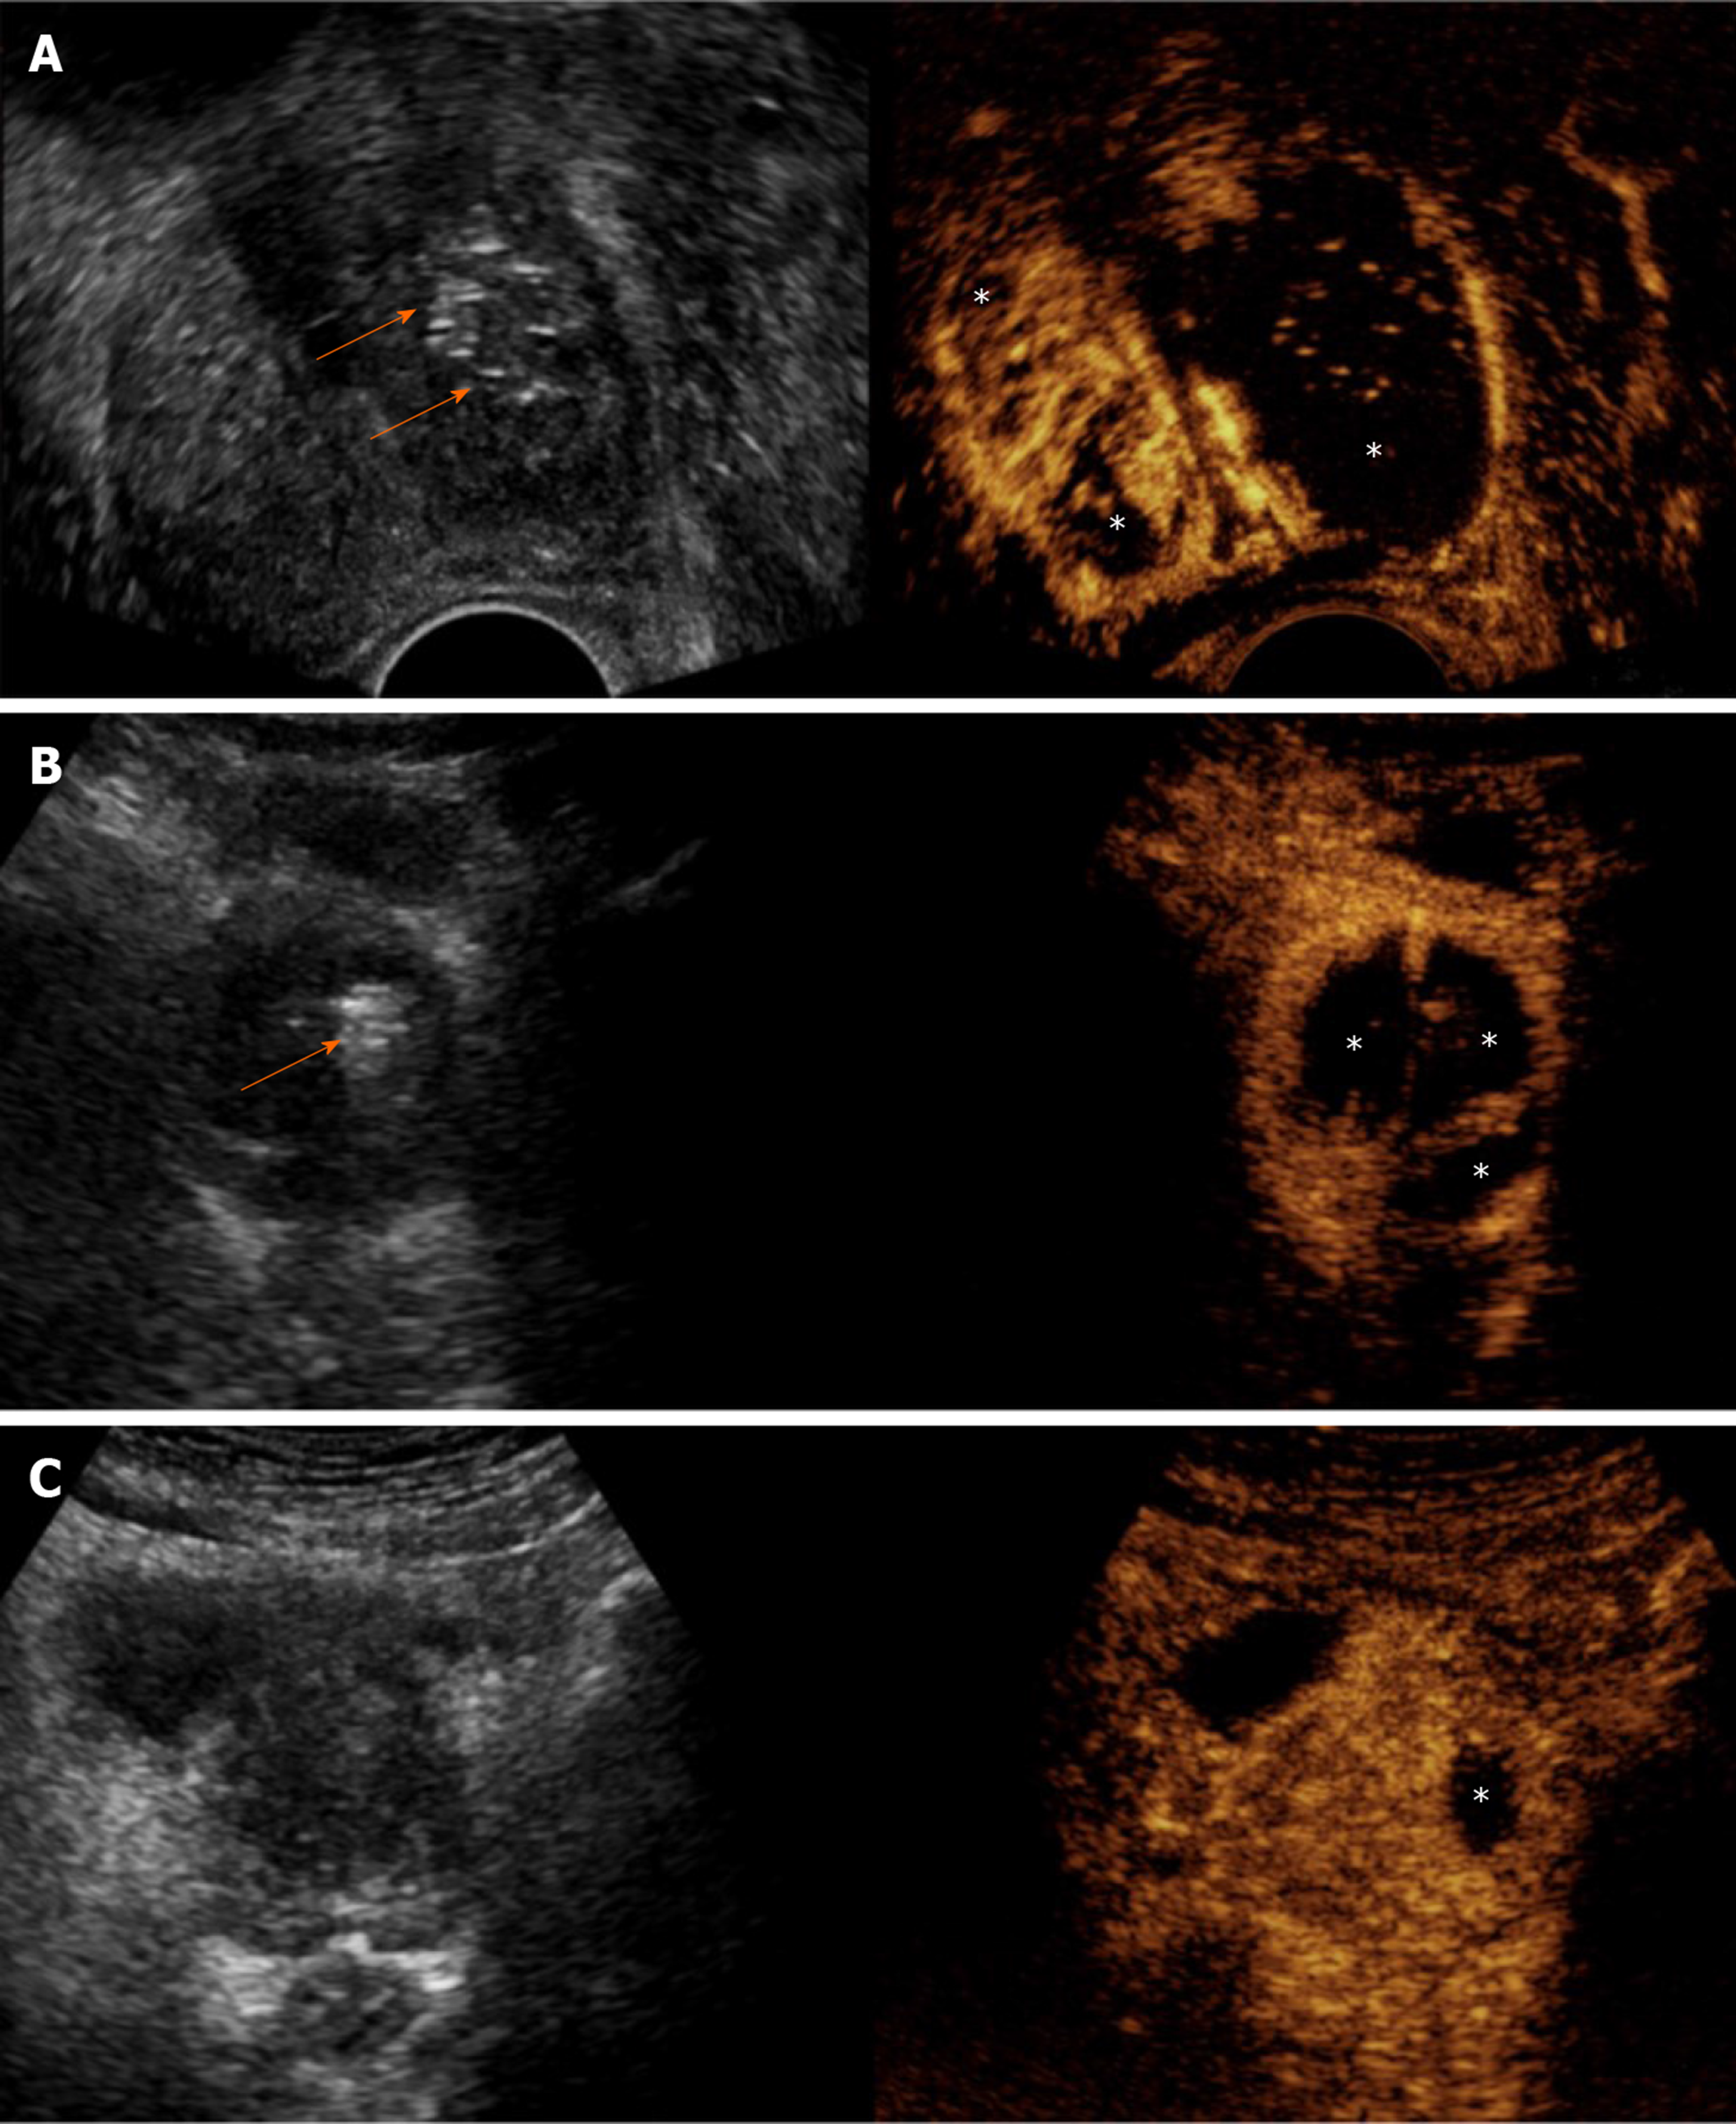
Figure 2 Varying extent and distribution of prostatic infarcts in patients with different clinical outcomes.
Findings are presented in a “split-screen” mode with unenhanced, reference B-mode image on the left, and corresponding contrast-enhanced ultrasonography (CEUS) image on the right. A: Transrectal CEUS 5 d post-bilateral prostatic artery embolization (PAE) in a patient with indwelling bladder catheter shows extensive infarction of the left prostatic lobe and smaller infarcts in the right. Removal of the Foley catheter and spontaneous voiding was possible a week later; B: Transabdominal CEUS (t.a.-CEUS) one day post-bilateral PAE shows extensive bilateral prostatic infarction. The patient experienced a rapid and durable symptomatic improvement (64% reduction of the International Prostate Symptom Score); C: t.a.-CEUS one day post-unilateral (left) PAE in a patient with indwelling bladder catheter shows a small left infarct lobe infarction. Multiple trials for removal of the Foley catheter failed in this patient and he eventually underwent transurethral resection. Asterisks indicate prostatic infarcts in all CEUS images. Arrows indicate echogenic foci, which appear in the embolized parts of the prostate shortly after PAE. Note that no echogenic foci can be detected in the case with the small unilateral infarct. All images are in axial plane.
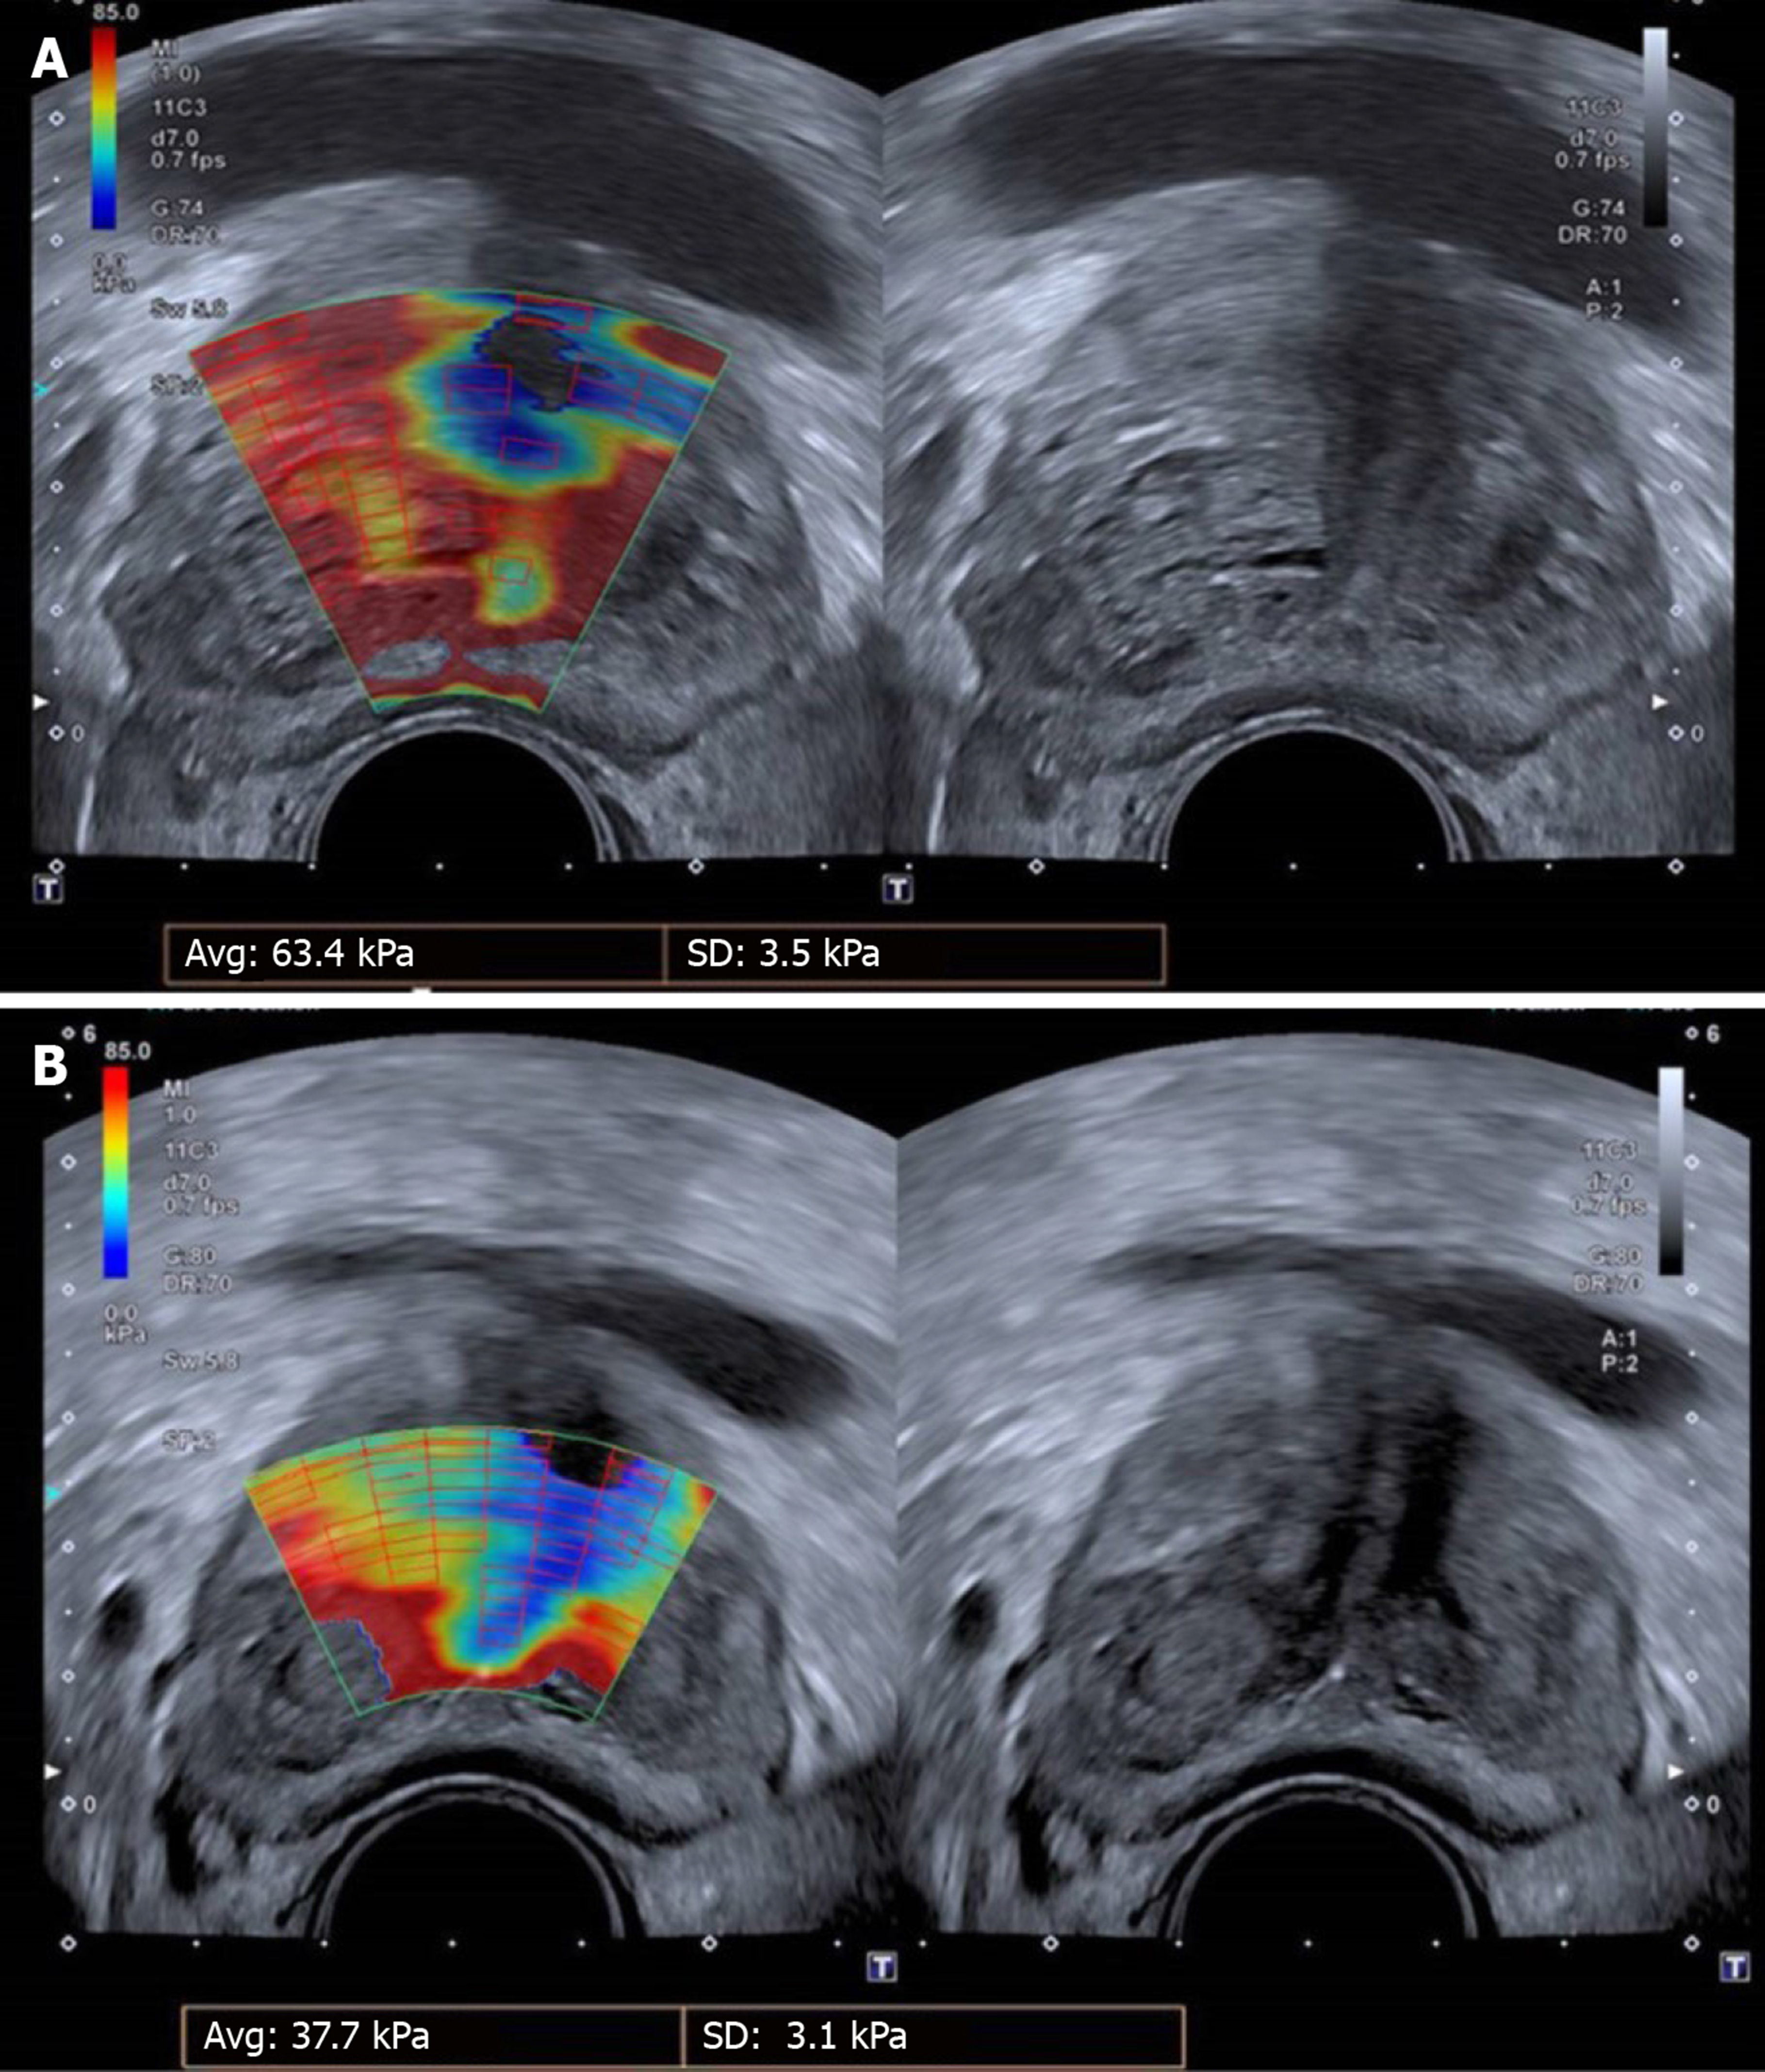
Figure 3 Shear-wave elastography of the prostate.
A: Before; B: Three months post-bilateral prostatic artery embolization (PAE). A significant reduction (40.5%) in the elastic modulus (EM) of the transitional zone is demonstrated, indicating increased prostatic tissue elasticity post-PAE. The elastographic changes were accompanied by marked improvement of clinical parameters (96.7% reduction of the International Prostate Symptom Score, 100% reduction of quality of life) and of prostate volume (55% reduction) and post-void residual volume (76% reduction). In this examination, red color tones indicate hard (stiffer) tissues, with high EM values (in kPa); blue tones indicate soft tissues, with low EM values; yellow or green tones indicate tissues of intermediate stiffness. Case courtesy of Dr. de Assis AM, Interventional Radiology Department, Radiology Institute, University of Sao Paulo Medical School.
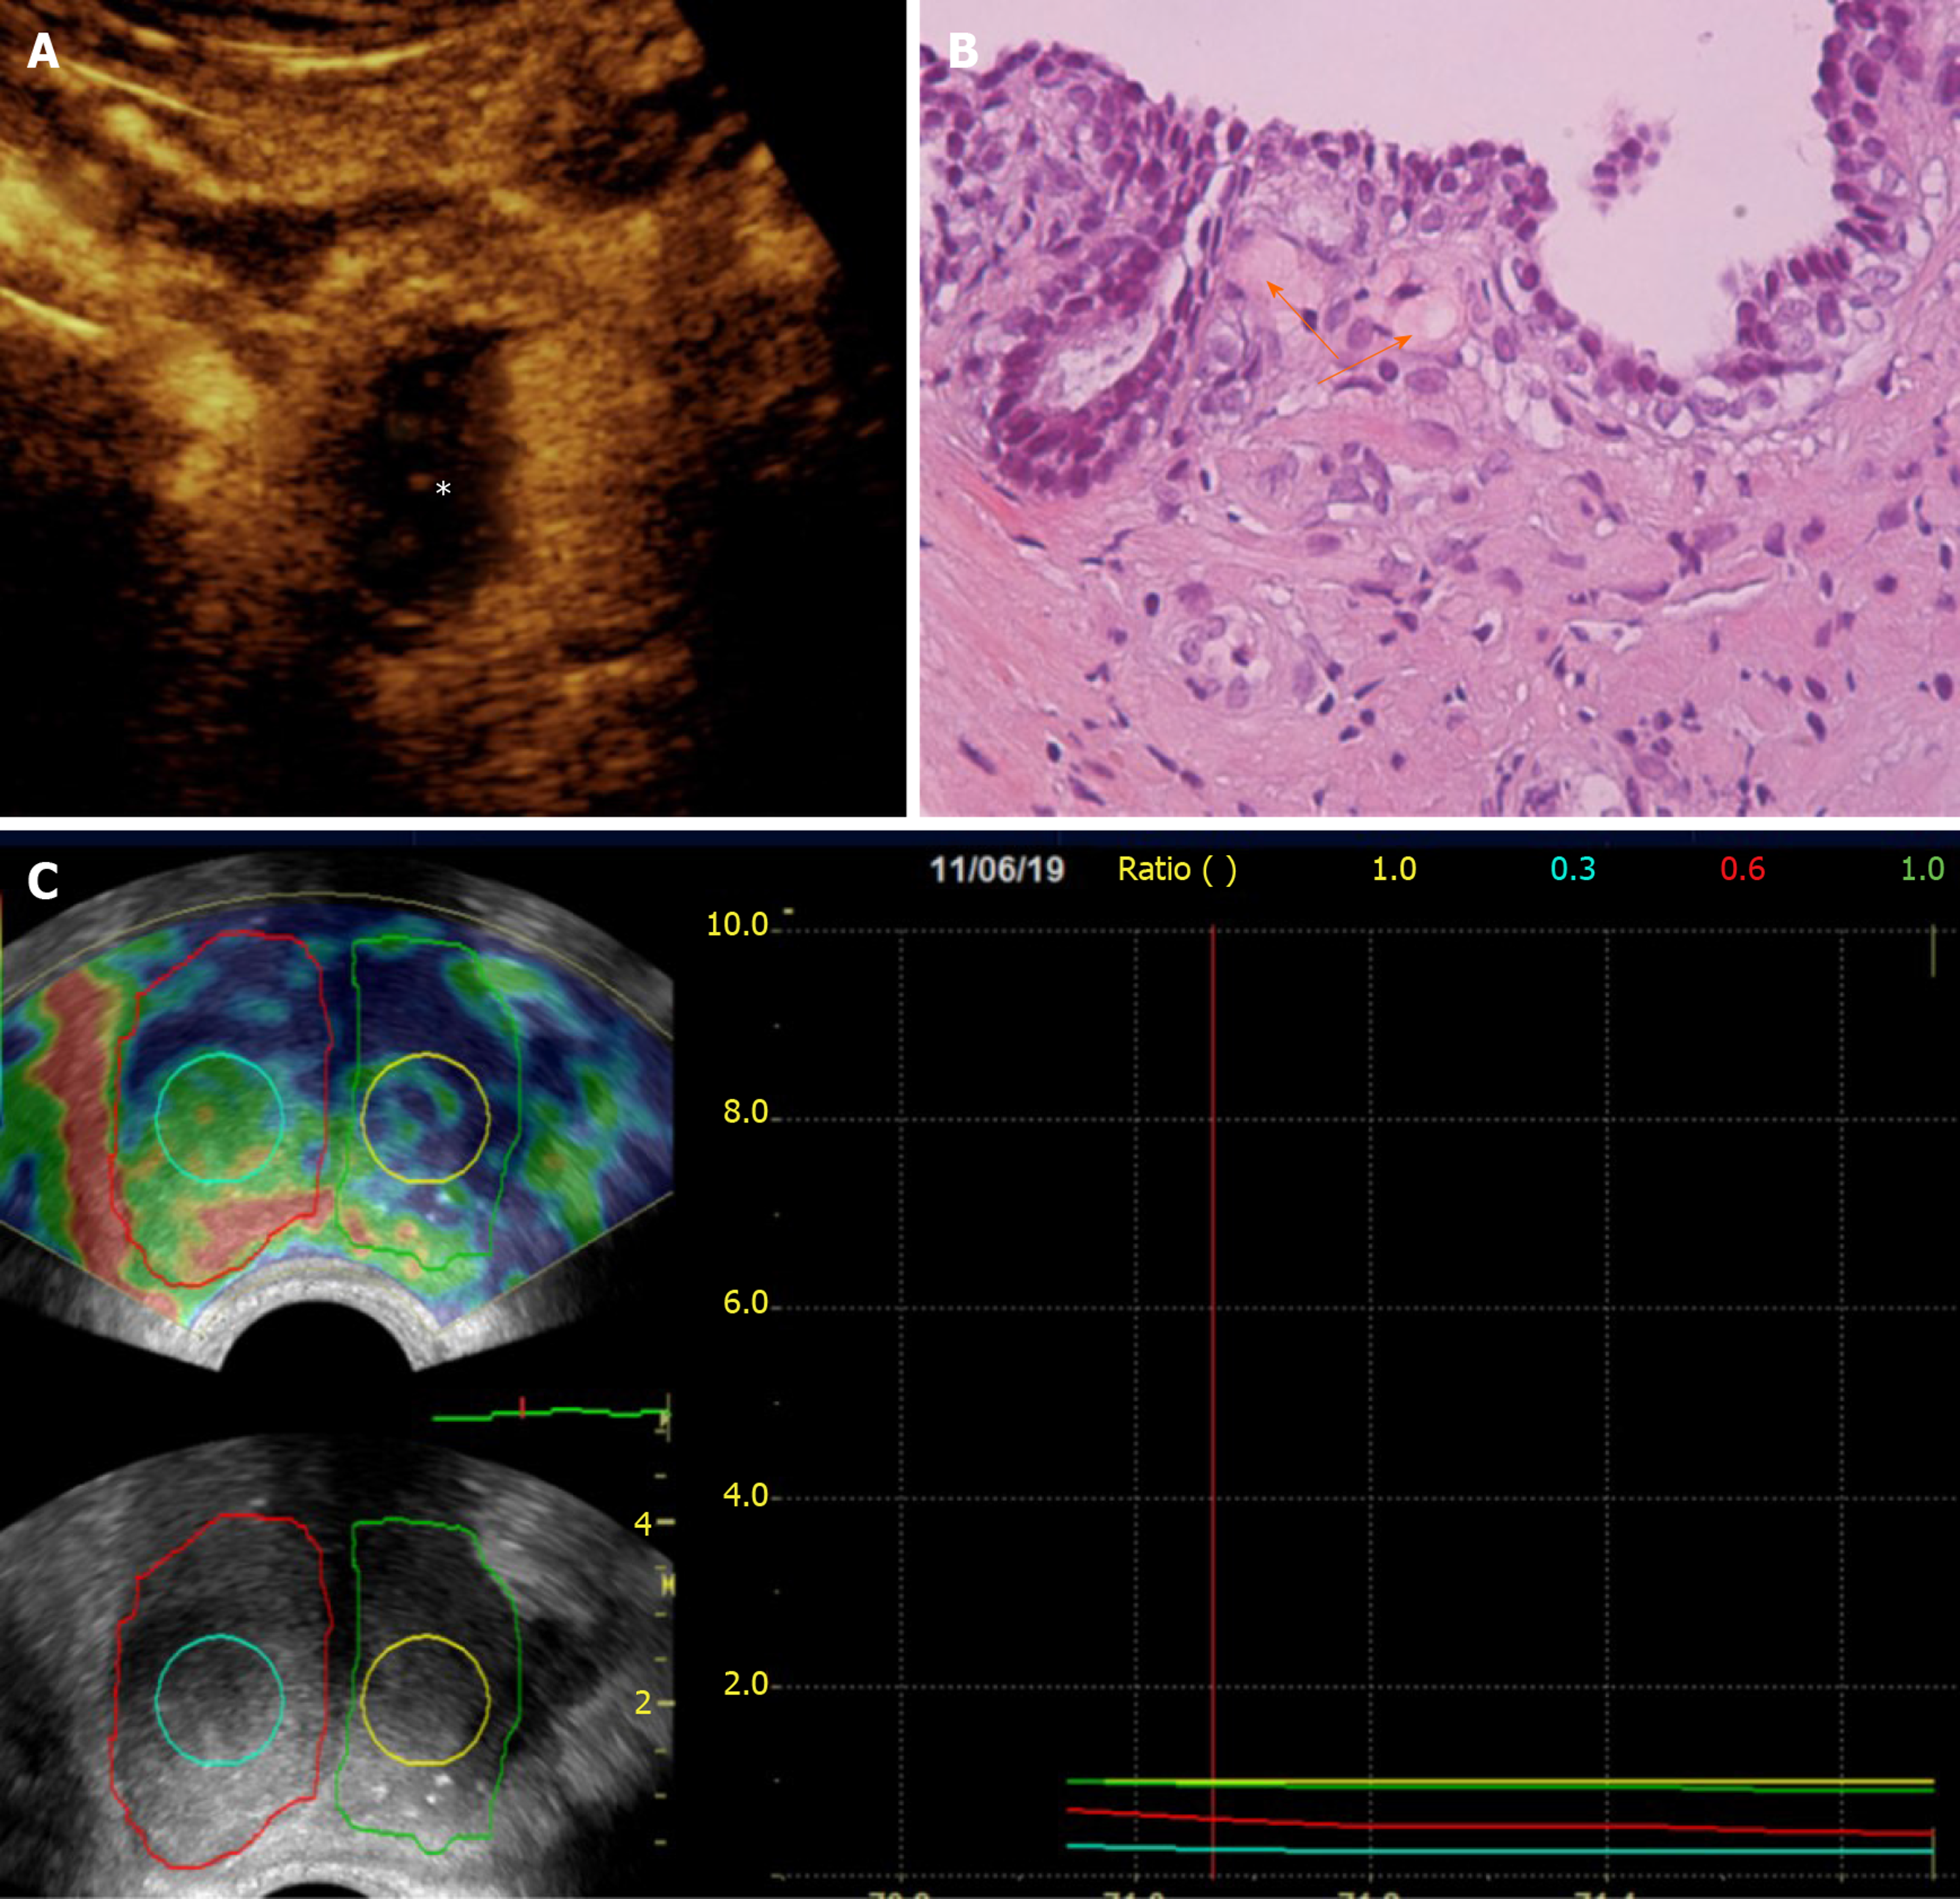
Figure 4 Correlation of contrast-enhanced ultrasonography, histopathologic and elastographic findings post-unilateral (right) prostatic artery embolization.
A: Transabdominal contrast-enhanced ultrasonography (CEUS) image (axial section) obtained one week post-prostatic artery embolization (PAE) shows extensive infarction of the right hemiprostate (asterisk); B: Histopathology (Hematoxylin-Eosin stain, original magnification × 40) of a transrectal US-guided biopsy specimen of the right transitional zone confirms the presence of eosinophilic microspheres (arrows) in arterioles surrounding a prostatic acinus. This biopsy had been performed 12 mo post-PAE, for recently elevated prostate-specific antigen and was negative for cancer; C: Transrectal strain elastographic images (axial sections) of the prostate 13 mo post-PAE shows increased strain in the right hemiprostate and in the center of the right transitional zone (outlined by the red and turquoise line, respectively) compared to the left hemiprostate and to the center of the left transitional zone (outlined by the green and yellow line, respectively). In this elastogram, blue color tones indicate hard (stiffer) tissues, red indicate soft tissues, and yellow or green tones indicate tissues of intermediate stiffness. This patient experienced significant and long-lasting symptomatic improvement post-PAE (75% reduction of the International Prostate Symptom Score, 2 years post-PAE).
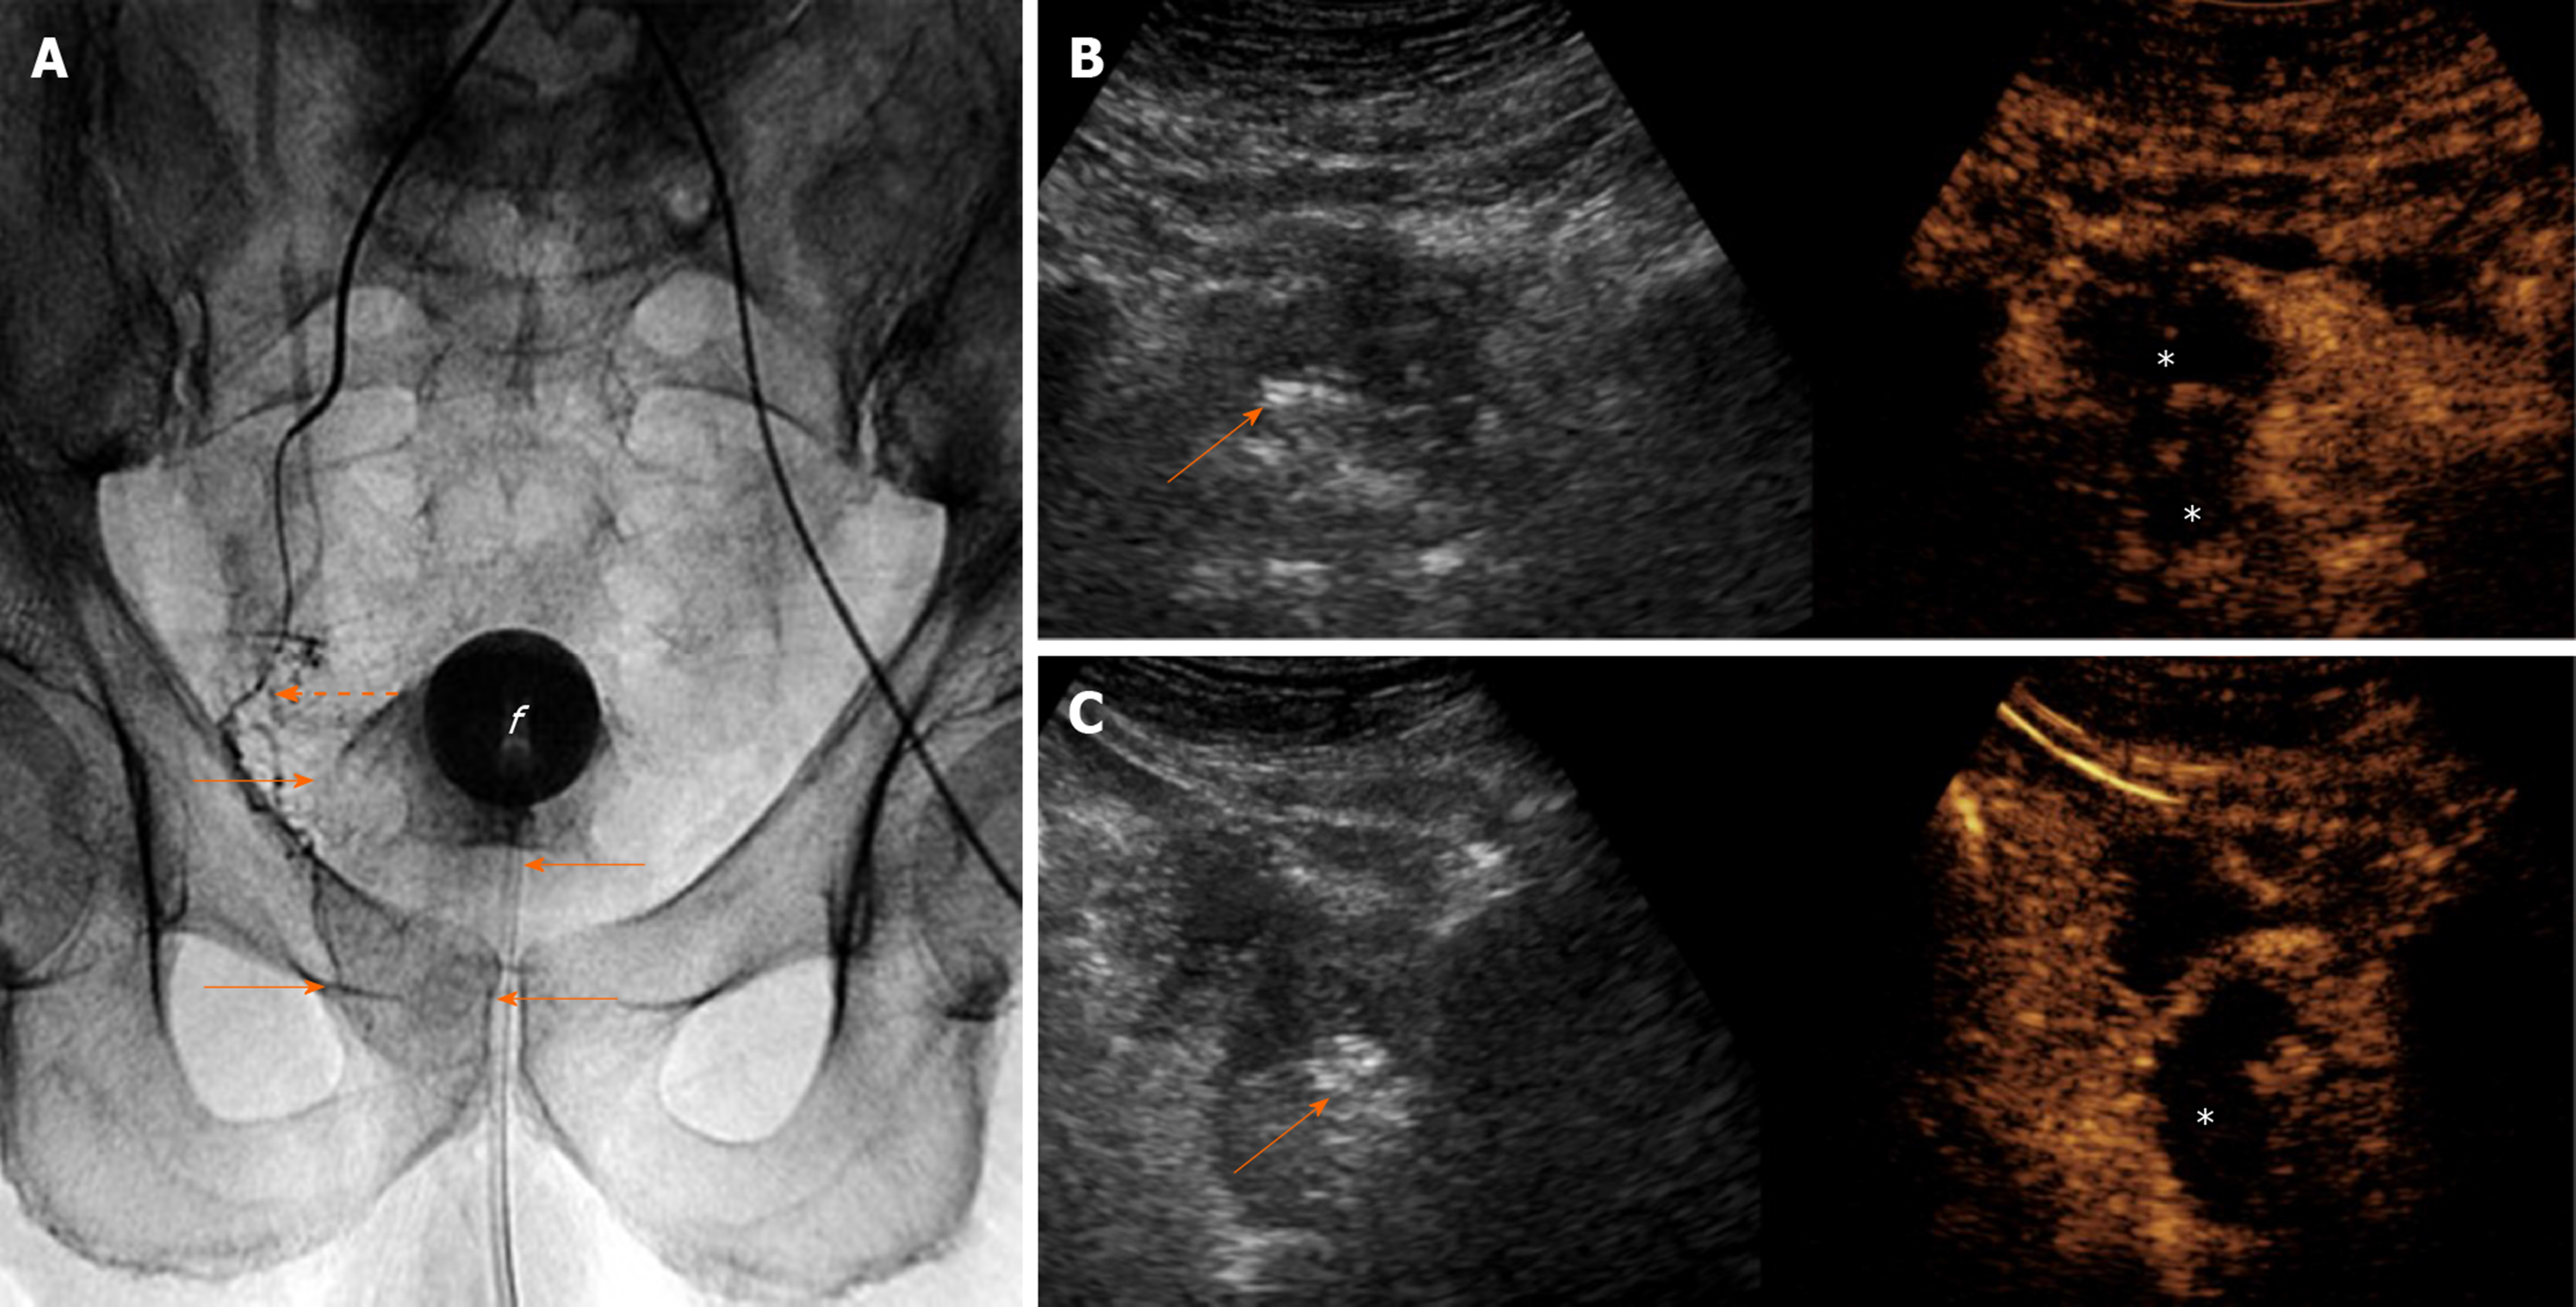
Figure 5 Intraprocedural sonographic evaluation of prostatic artery embolization with i.
v.-contrast-enhanced ultrasonography. A: Digital radiograph (anteroposterior projection) immediately post-right prostatic artery embolization shows the tip of the microcatheter (dotted arrow) at the proximal (extraprostatic) part of the right prostatic artery. Pooling of the contrast of the embolic mixture has caused opacification of the right hemiprostate (arrows). “f” indicates the balloon of the Foley catheter; B and C: Transabdominal contrast-enhanced ultrasonography (CEUS), axial and right parasagittal section, respectively, with standard (i.v.) injection of the echo-enhancer, confirms adequate devascularization (infarction) of the right hemiprostate (asterisks). Findings are presented in a “split-screen” mode with unenhanced, reference B-mode image on the left, and corresponding CEUS image on the right. Stippled and linear hyperechogenicities appear in the right hemiprostate. They are more striking (arrows) on the unenhanced, reference B-mode images.
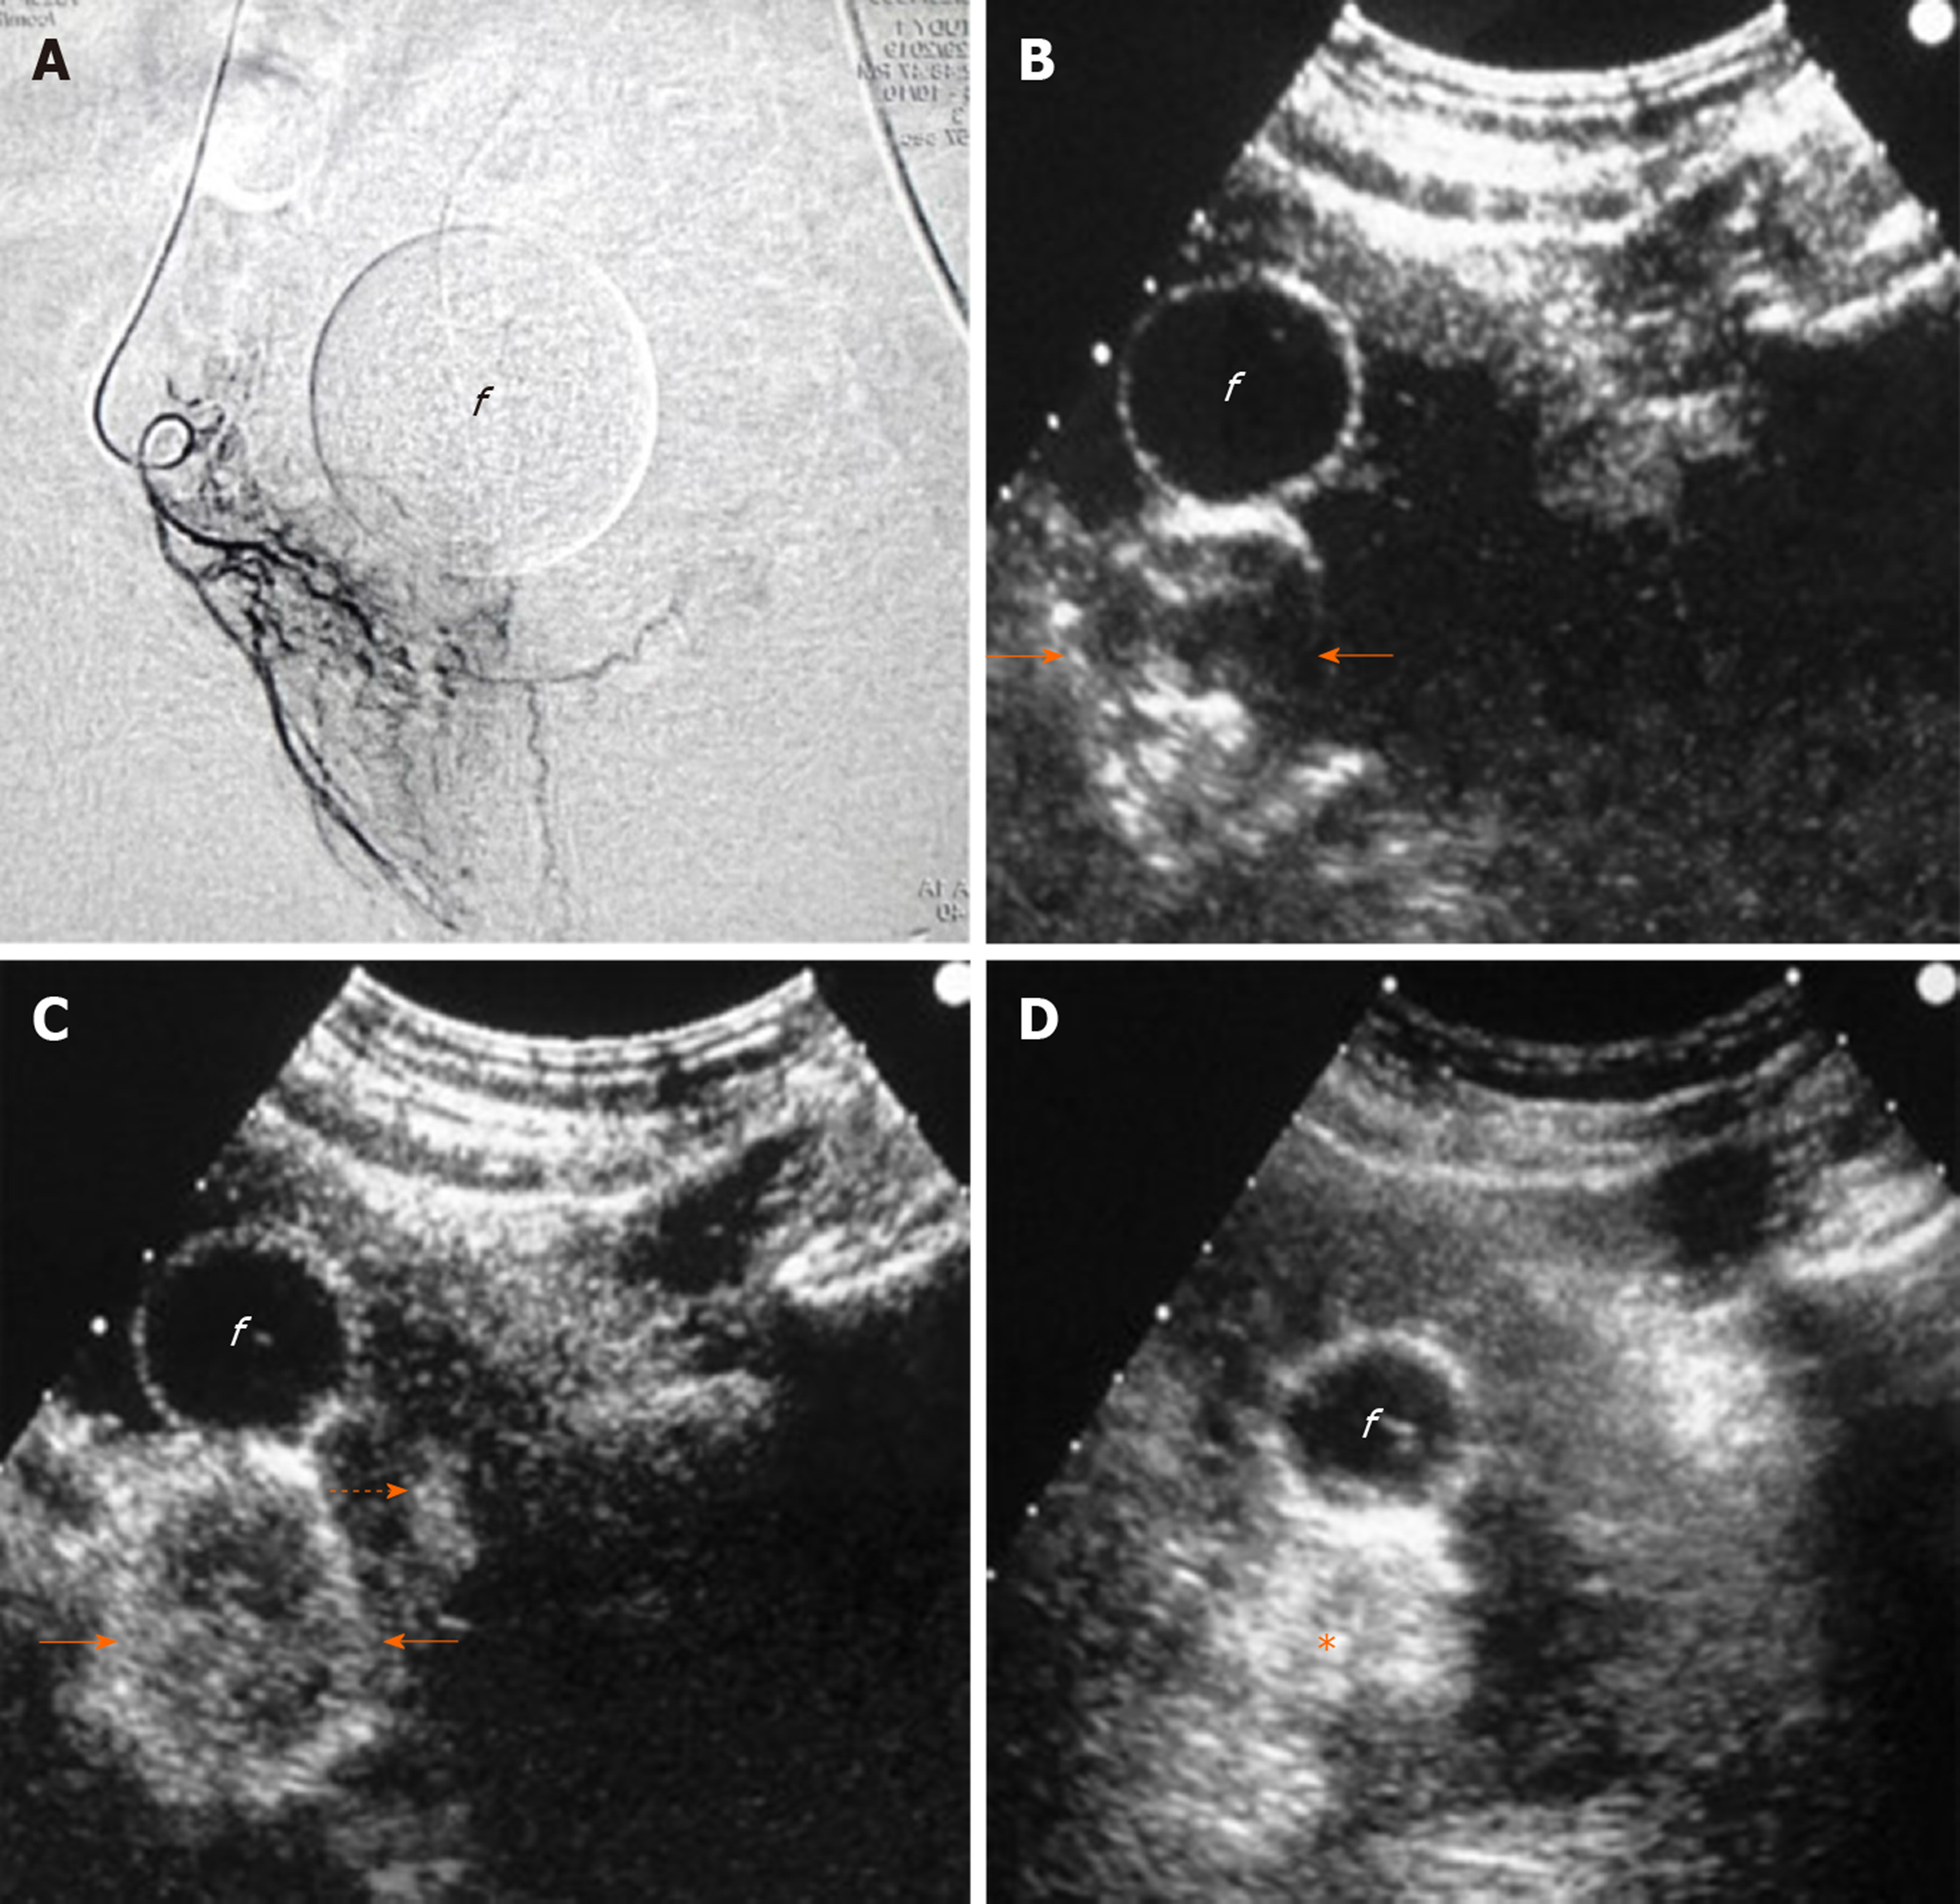
Figure 6 Intraprocedural sonographic evaluation of prostatic artery embolization with intraarterial contrast-enhanced ultrasonography.
A: Angiographic image (anteroposterior projection) shows the right prostatic artery and its branches; B: Transabdominal contrast-enhanced ultrasonography (t.a.-CEUS) image 3 s after intraarterial injection of diluted Sonovue shows rapid, intense enhancement of the right prostatic lobe, more prominent at its periphery (arrows); C: t.a.-CEUS image 7 s later, shows more diffuse enhancement of the right lobe and subtle enhancement in a small area of the left lobe (dotted arrow). No signs of extraprostatic enhancement were noticed and embolization was performed with microspheres (diameter: 100-300 μm); D: Unenhanced t.a.-US image 10 min post-embolization shows increased echogenicity of the right lobe (asterisk). “f” indicates the balloon of the Foley catheter in all images. CEUS images are in axial plane.
- Citation: Moschouris H, Dimakis A, Anagnostopoulou A, Stamatiou K, Malagari K. Sonographic evaluation of prostatic artery embolization: Far beyond size measurements. World J Radiol 2020; 12(8): 172-183
- URL: https://www.wjgnet.com/1949-8470/full/v12/i8/172.htm
- DOI: https://dx.doi.org/10.4329/wjr.v12.i8.172


