Copyright
©The Author(s) 2020.
World J Radiol. Jun 28, 2020; 12(6): 87-100
Published online Jun 28, 2020. doi: 10.4329/wjr.v12.i6.87
Published online Jun 28, 2020. doi: 10.4329/wjr.v12.i6.87
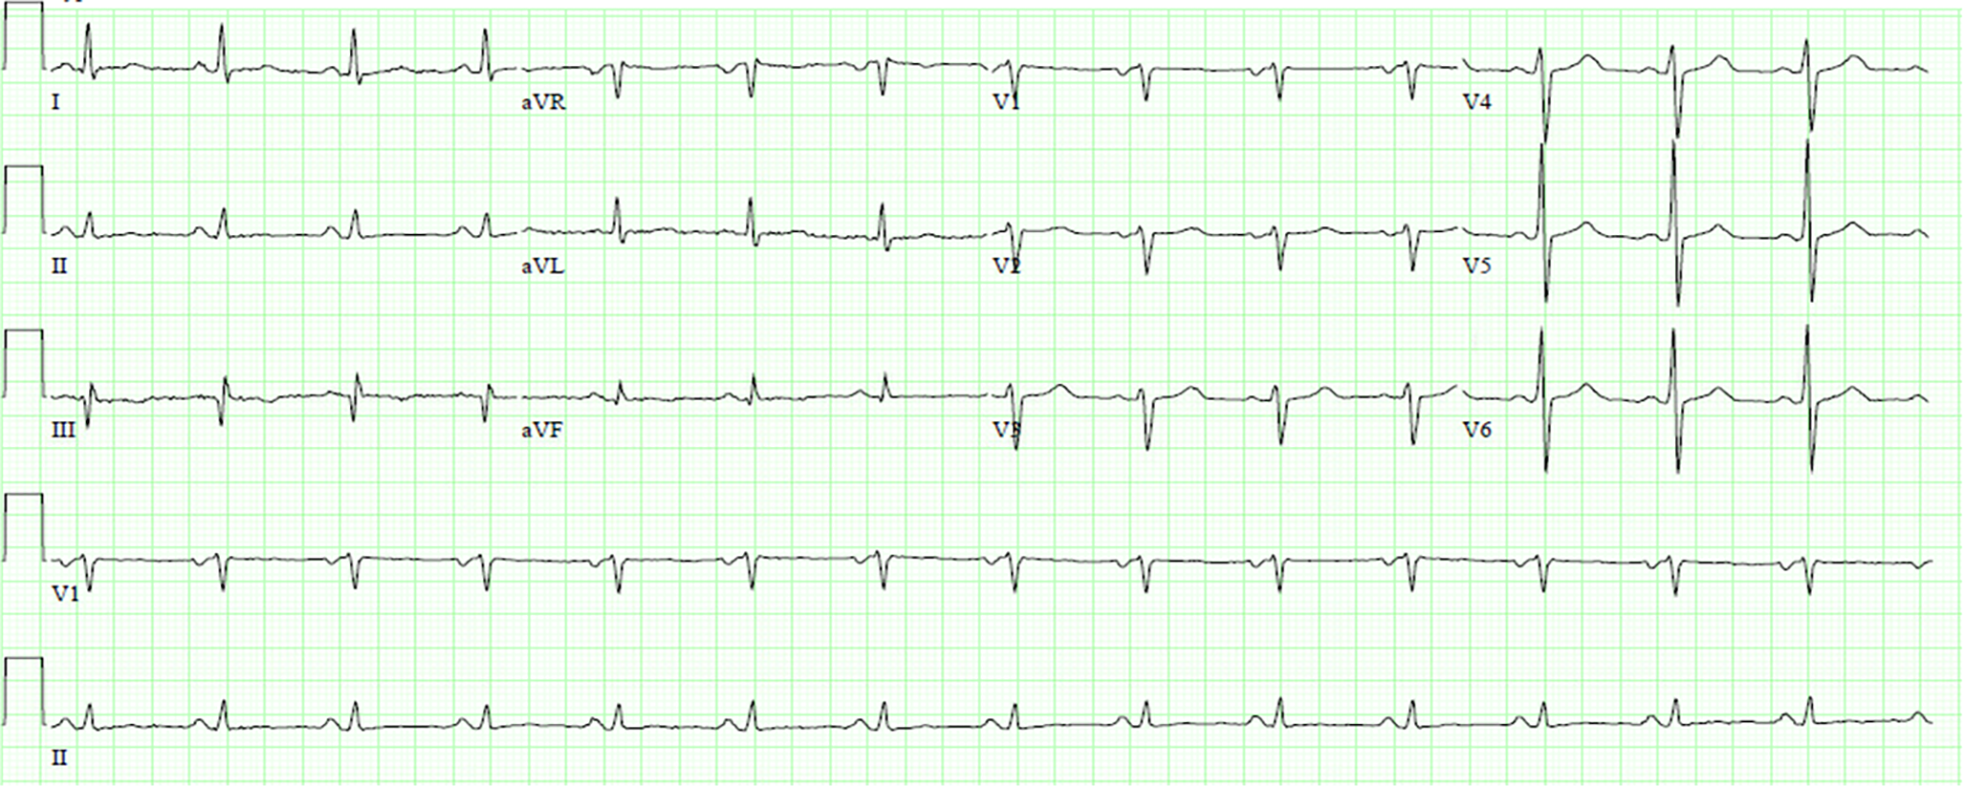
Figure 1 Characteristic electrocardiogram of cardiac amyloidosis demonstrating low QRS voltages.
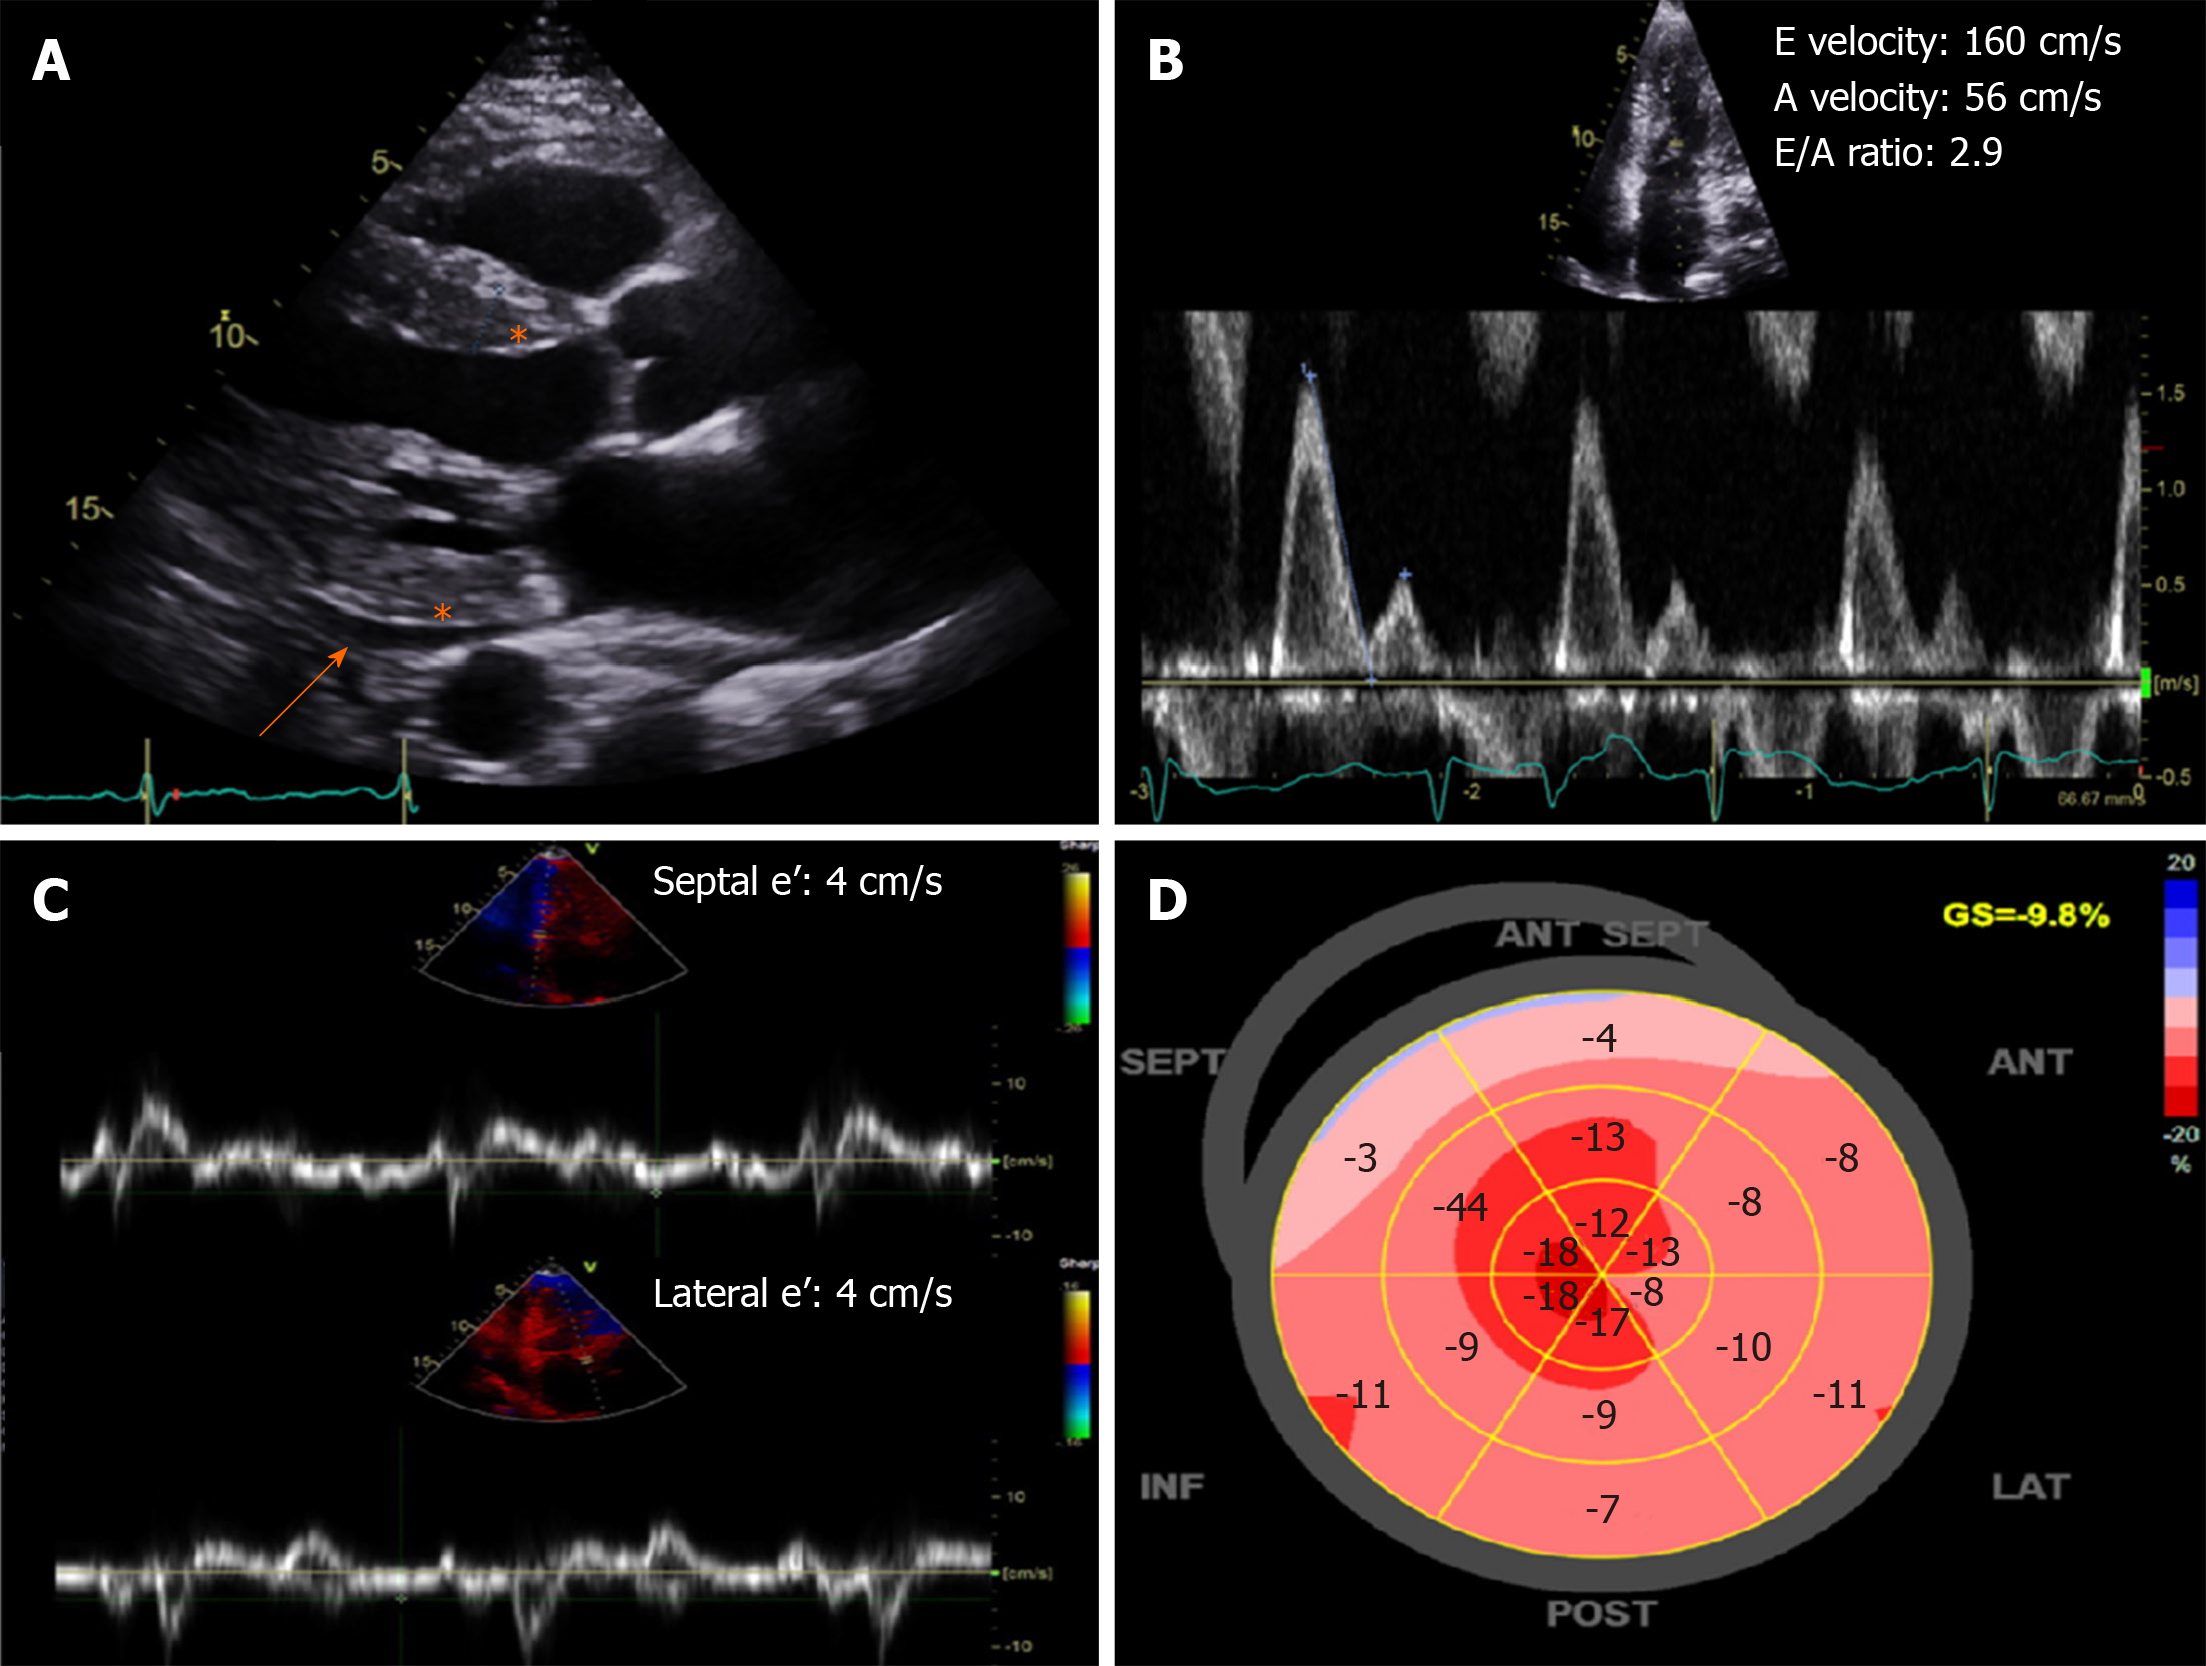
Figure 2 Characteristic echocardiography findings of cardiac amyloidosis.
A: Increased left ventricular wall thickness and echogenicity (asterisk) with small effusion (orange arrow); B and C: Severe (restrictive) diastolic dysfunction with mitral inflow E/A ratio > 2.0 and low septal and lateral e’ velocities by tissue Doppler; D: Bull’s eye plot showing a “cherry-top” pattern of left ventricular peak systolic longitudinal strain, consistent with apical sparing pattern.
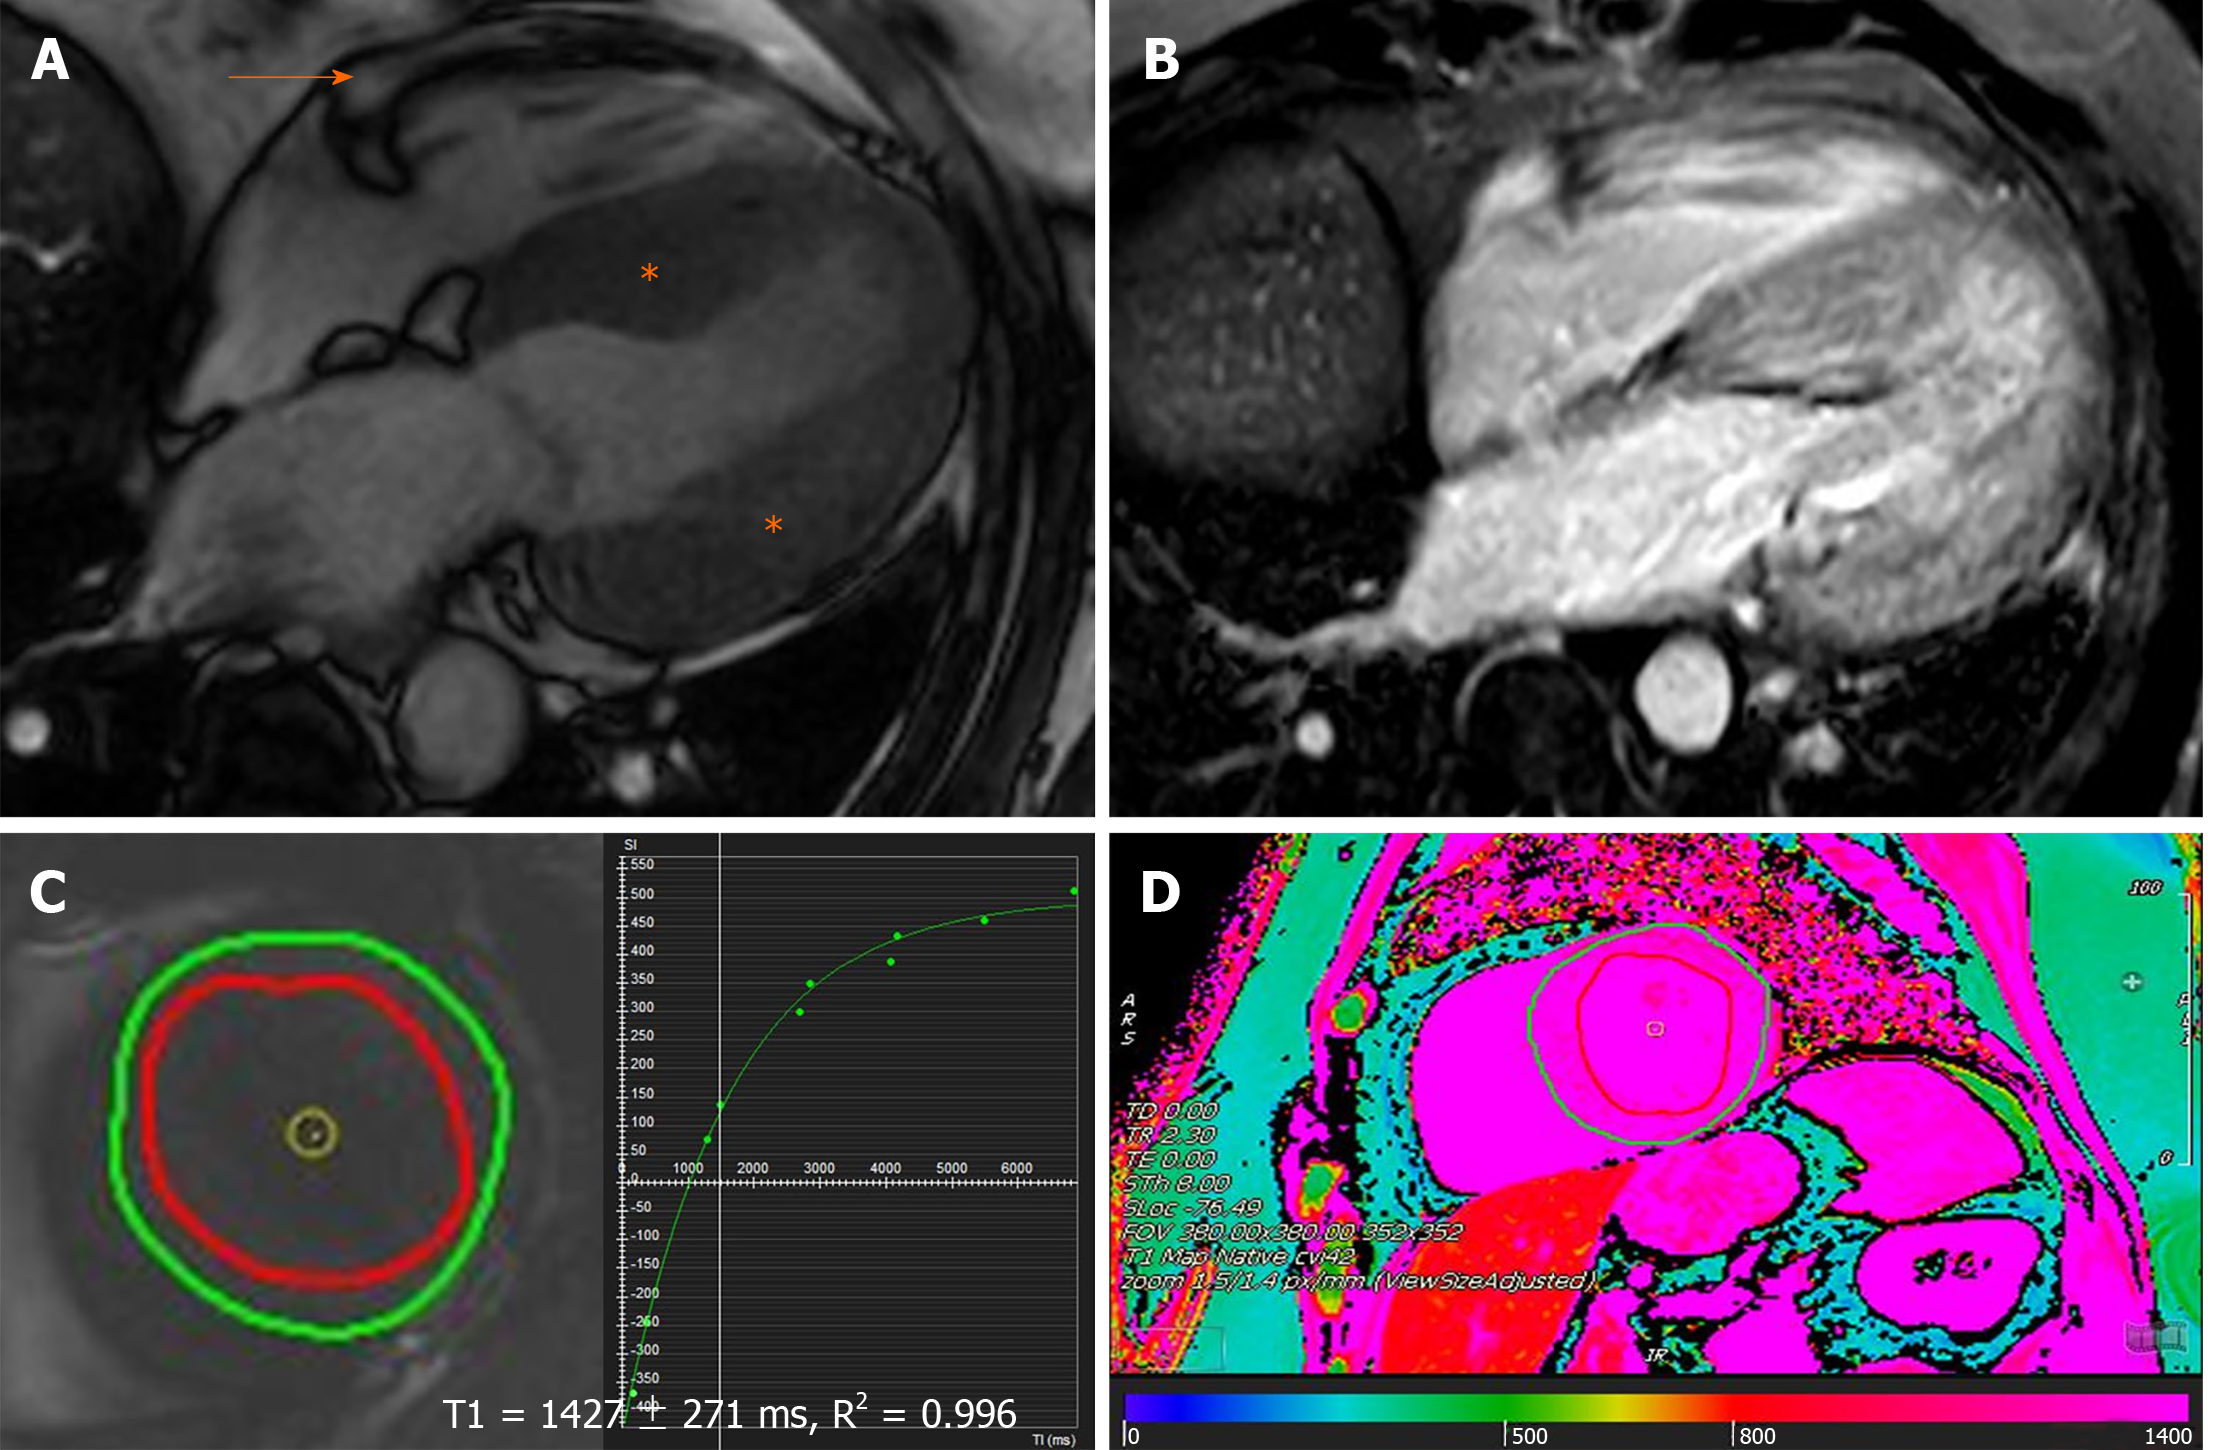
Figure 3 Characteristic magnetic resonance findings of cardiac amyloidosis.
A: Increased left ventricular wall thickness (asterisk) with trivial pericardial effusion (orange arrow) on steady state free precession; B: Delayed enhancement imaging (phase sensitive inversion recovery sequence) demonstrating diffusely abnormal, transmural late gadolinium enhancement in the myocardium; C and D: Native T1-mapping (using the modified look-locker inversion recovery sequence) at left ventricular (C) basal level short-axis slice and (D) color map at left ventricular mid level short-axis, showing significantly elevated native T1-values and consistent with interstitial fibrosis. Note that the imaging acquisition in this example was performed using a dedicated 3.0 Tesla machine.
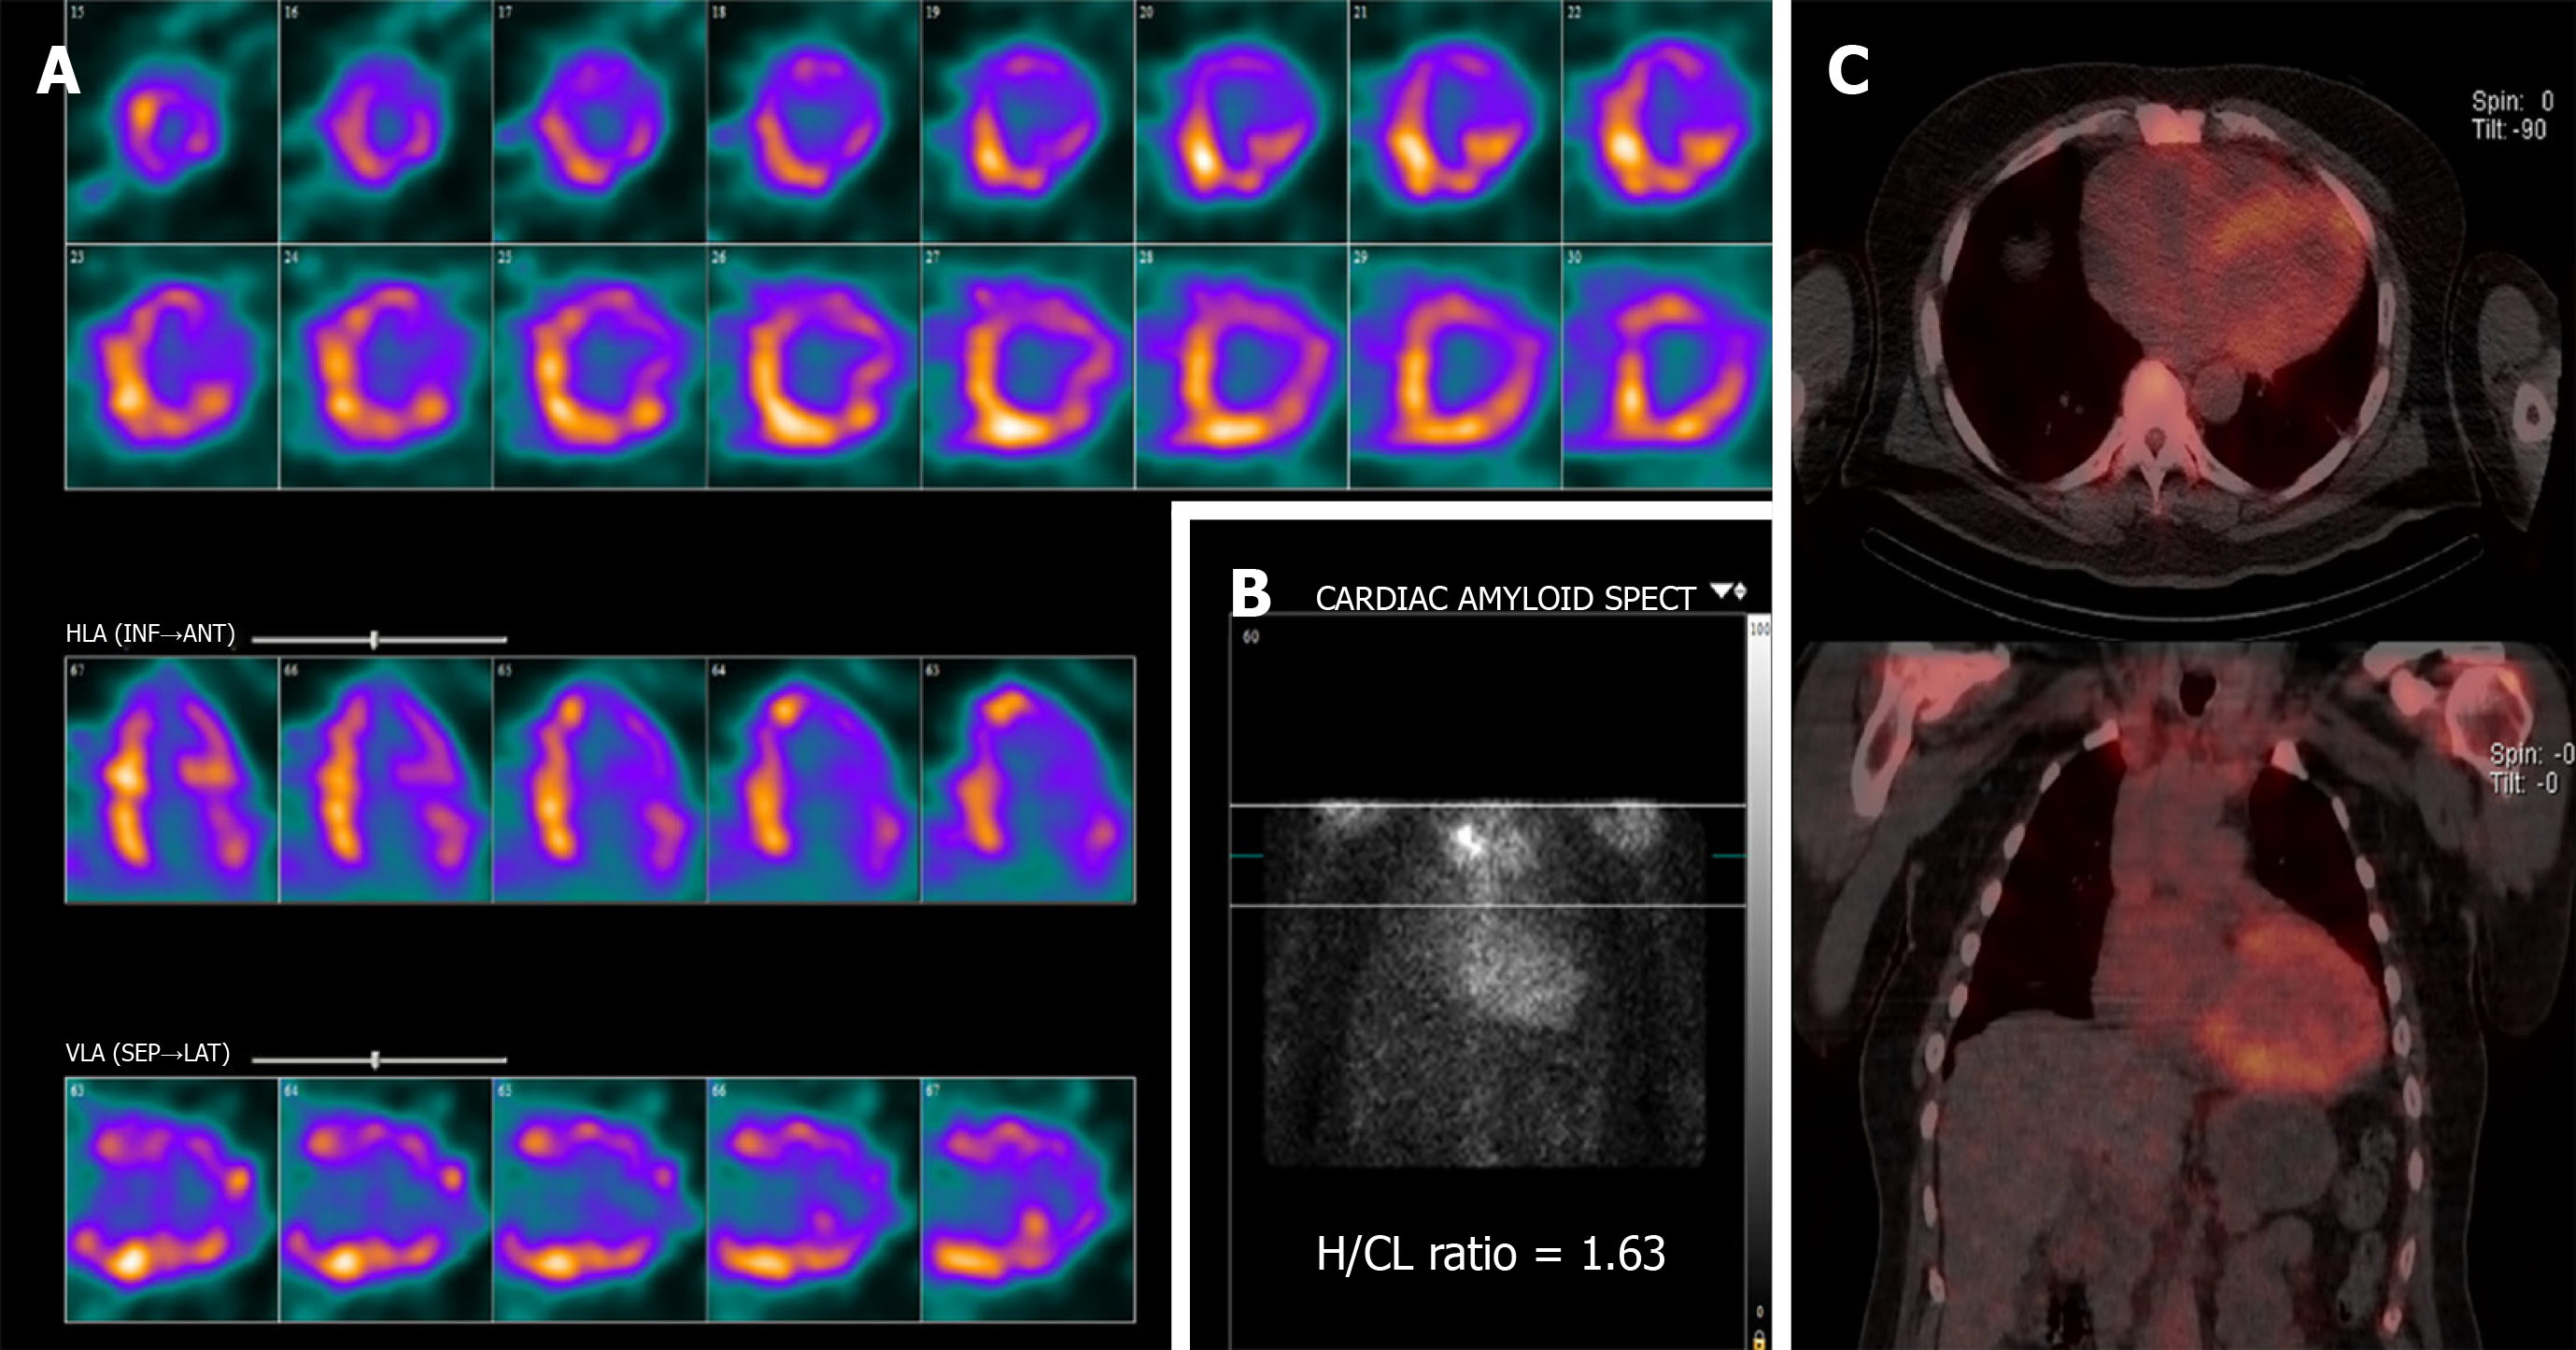
Figure 4 Tc-99m-Pyrophosphate SPECT of the chest with computed tomography attenuation correction at 3 h after intravenous injection of Tc-99m Pyrophosphate.
A: Single-photon emission computerized tomography (SPECT) exhibits diffuse uptake pattern; B: Planar image depicts by visual comparison to bone a Grade 2 uptake (equal to rib uptake). The calculated H/CL ratio is measured at 1.63; C: SPECT/Computed tomography fusion showing distribution of the increased cardiac uptake. SPECT: Single-photon emission computerized tomography; H/CL: Heart-to-contralateral lung.
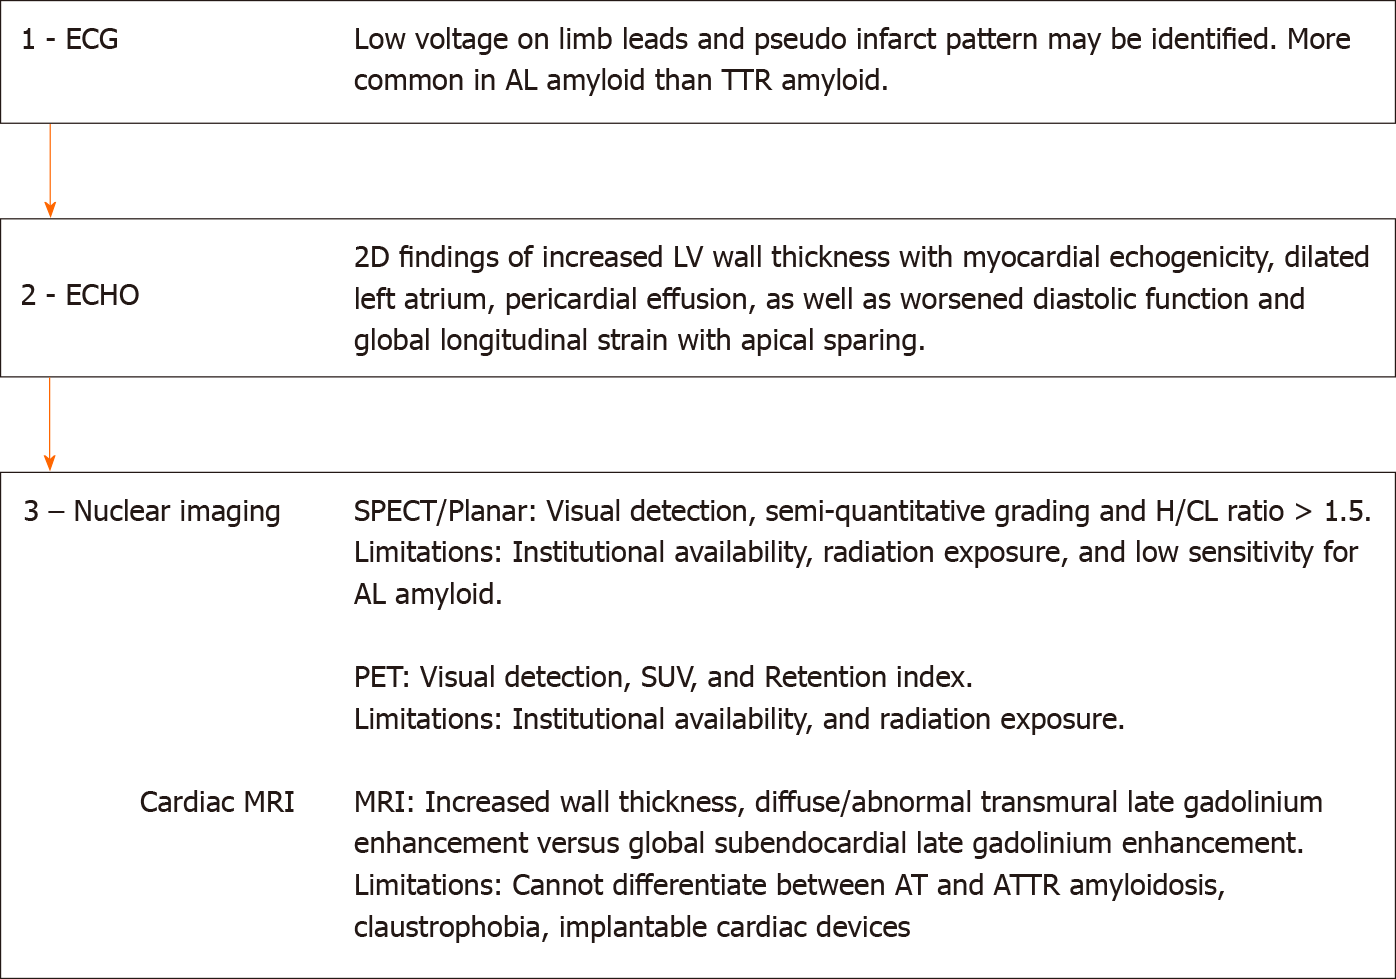
Figure 5 Schematic diagram of the stepwise use of electrocardiogram and multi-modality imaging in the diagnosis and evaluation of cardiac amyloidosis.
ECG: Electrocardiogram; AL: Light chain amyloidosis; TTR: Transthyretin; ECHO: Echocardiogram; SPECT: Single-photon emission computerized tomography; H/CL: Heart-to-contralateral lung; PET: Positron-emission tomography; SUV: Standardized uptake value; MRI: Magnetic-resonance imaging; ATTR: Transthyretin amyloidosis.
- Citation: Wang TKM, Abou Hassan OK, Jaber W, Xu B. Multi-modality imaging of cardiac amyloidosis: Contemporary update. World J Radiol 2020; 12(6): 87-100
- URL: https://www.wjgnet.com/1949-8470/full/v12/i6/87.htm
- DOI: https://dx.doi.org/10.4329/wjr.v12.i6.87


