Copyright
©The Author(s) 2020.
World J Radiol. Oct 28, 2020; 12(10): 231-246
Published online Oct 28, 2020. doi: 10.4329/wjr.v12.i10.231
Published online Oct 28, 2020. doi: 10.4329/wjr.v12.i10.231
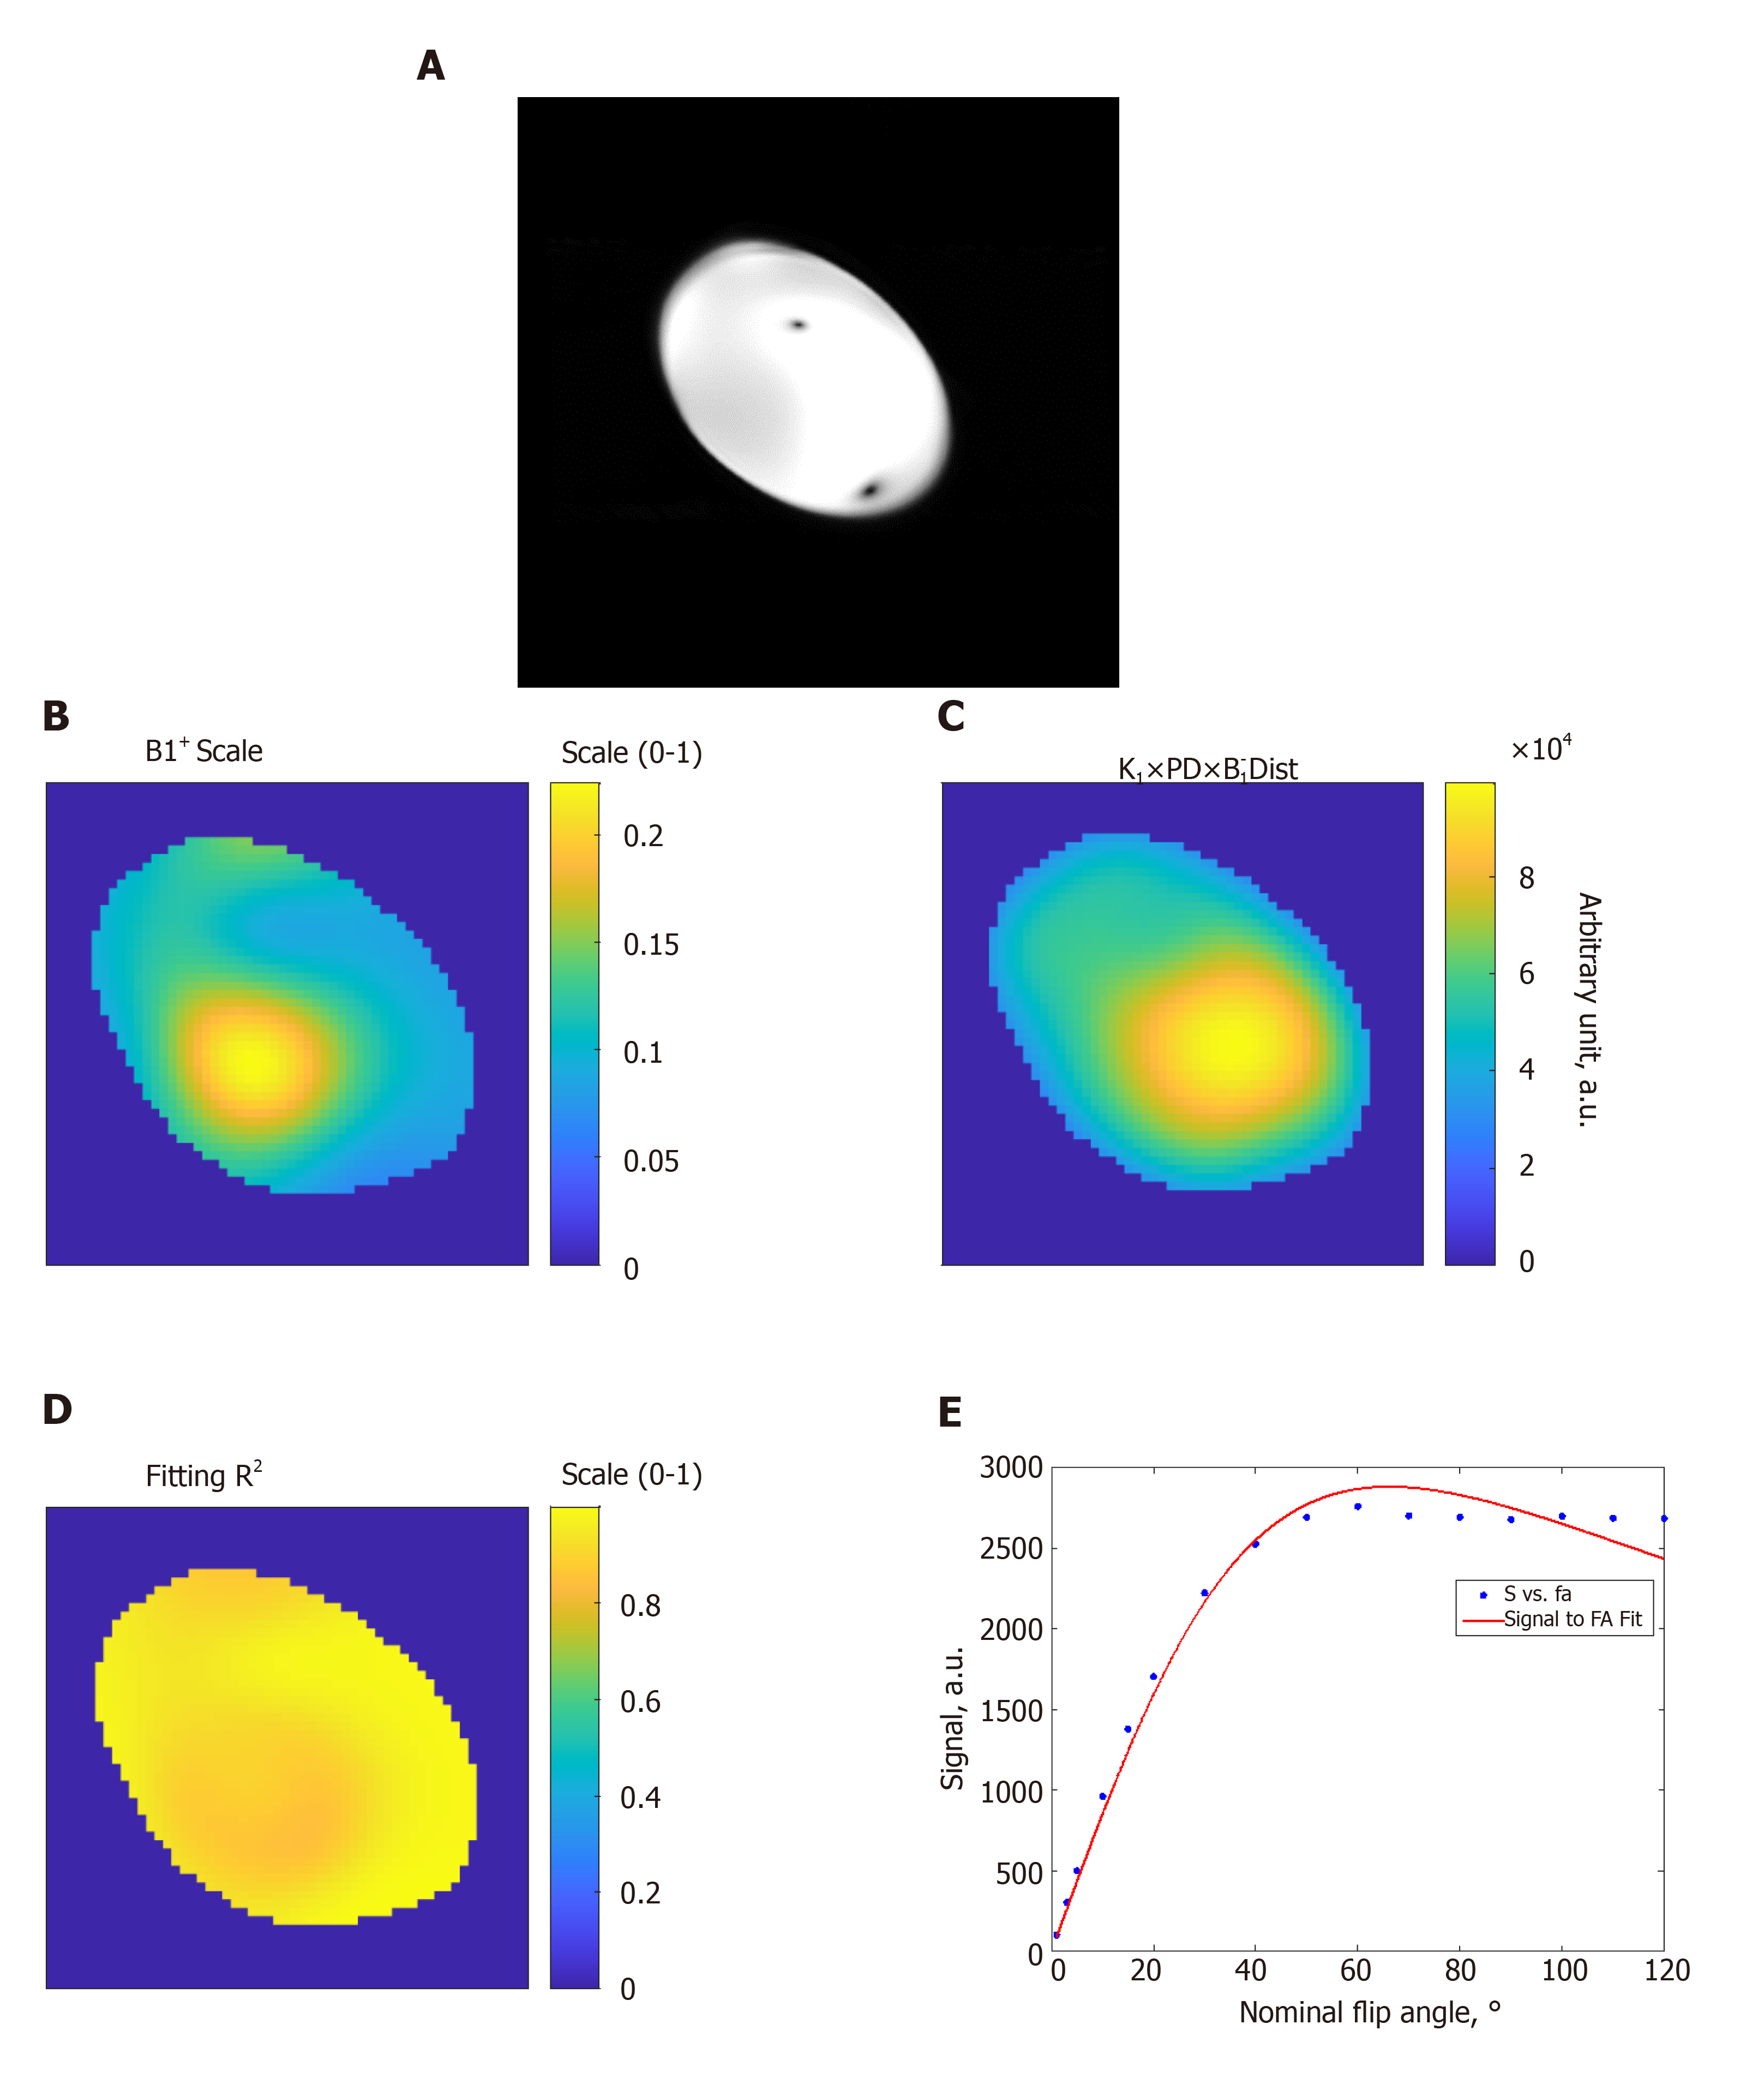
Figure 1 Estimation of the B1 transmission field in a homogeneous phantom.
A: Gradient-echo magnitude image of the phantom; B: B1 scale factor map (range, 0 to 1) of the phantom; C: Proton density distribution map (arbitrary units; a.u.); D: R2 fitting map (range, 0 to 1) shows excellent simulation fittings; E: Example of signal intensity measurements (arbitrary units; a.u.) at different flip angles in degrees (dots) and the fitting curve inside the phantom. The results show altered B1 field across the imaged slice. FA: Flip angle.
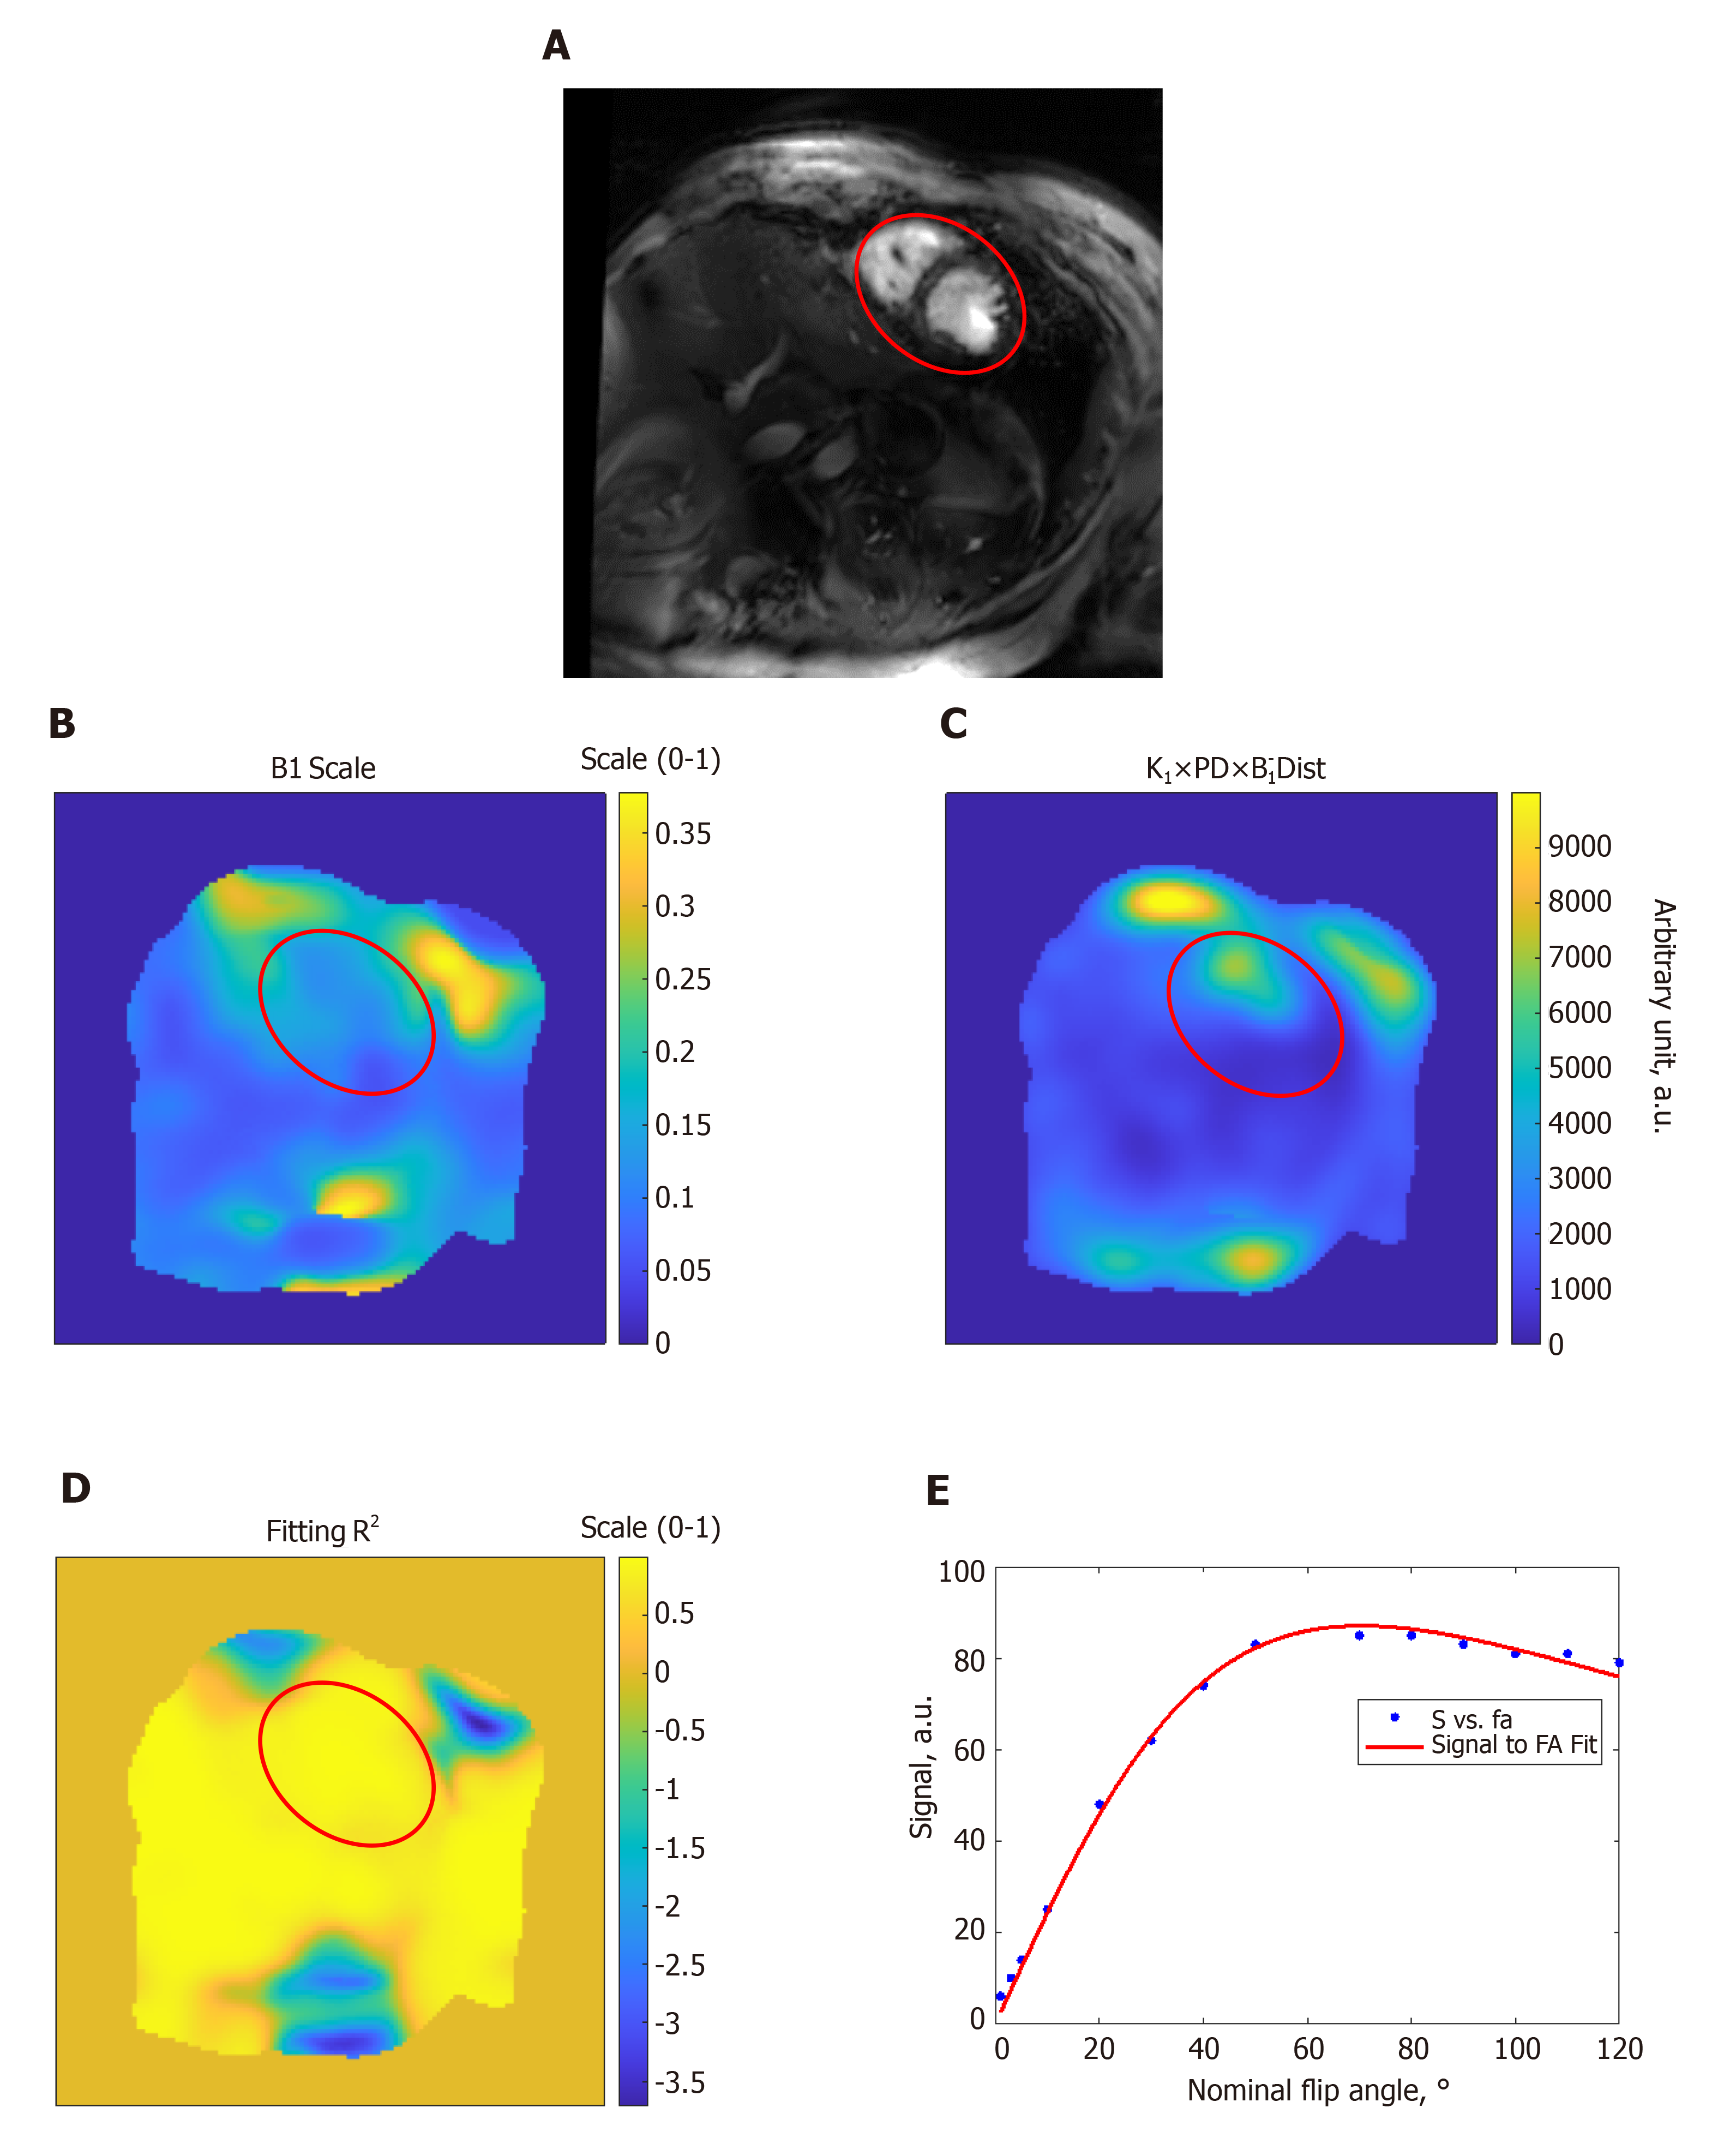
Figure 2 Estimation of the B1 transmission field in a volunteer scan.
A: Gradient-echo short-axis image; B: B1 scale factor map (range, 0 to 1); C: Proton density distribution map (arbitrary units; a.u.); D: R2 fitting map (range, 0 to 1) shows excellent simulation fittings; E: Example of signal intensity measurements (arbitrary units; a.u.) at different flip angles in degrees (dots) and the fitting curve inside the heart region (red circle). The results show altered B1 field across the imaged slice. FA: Flip angle.
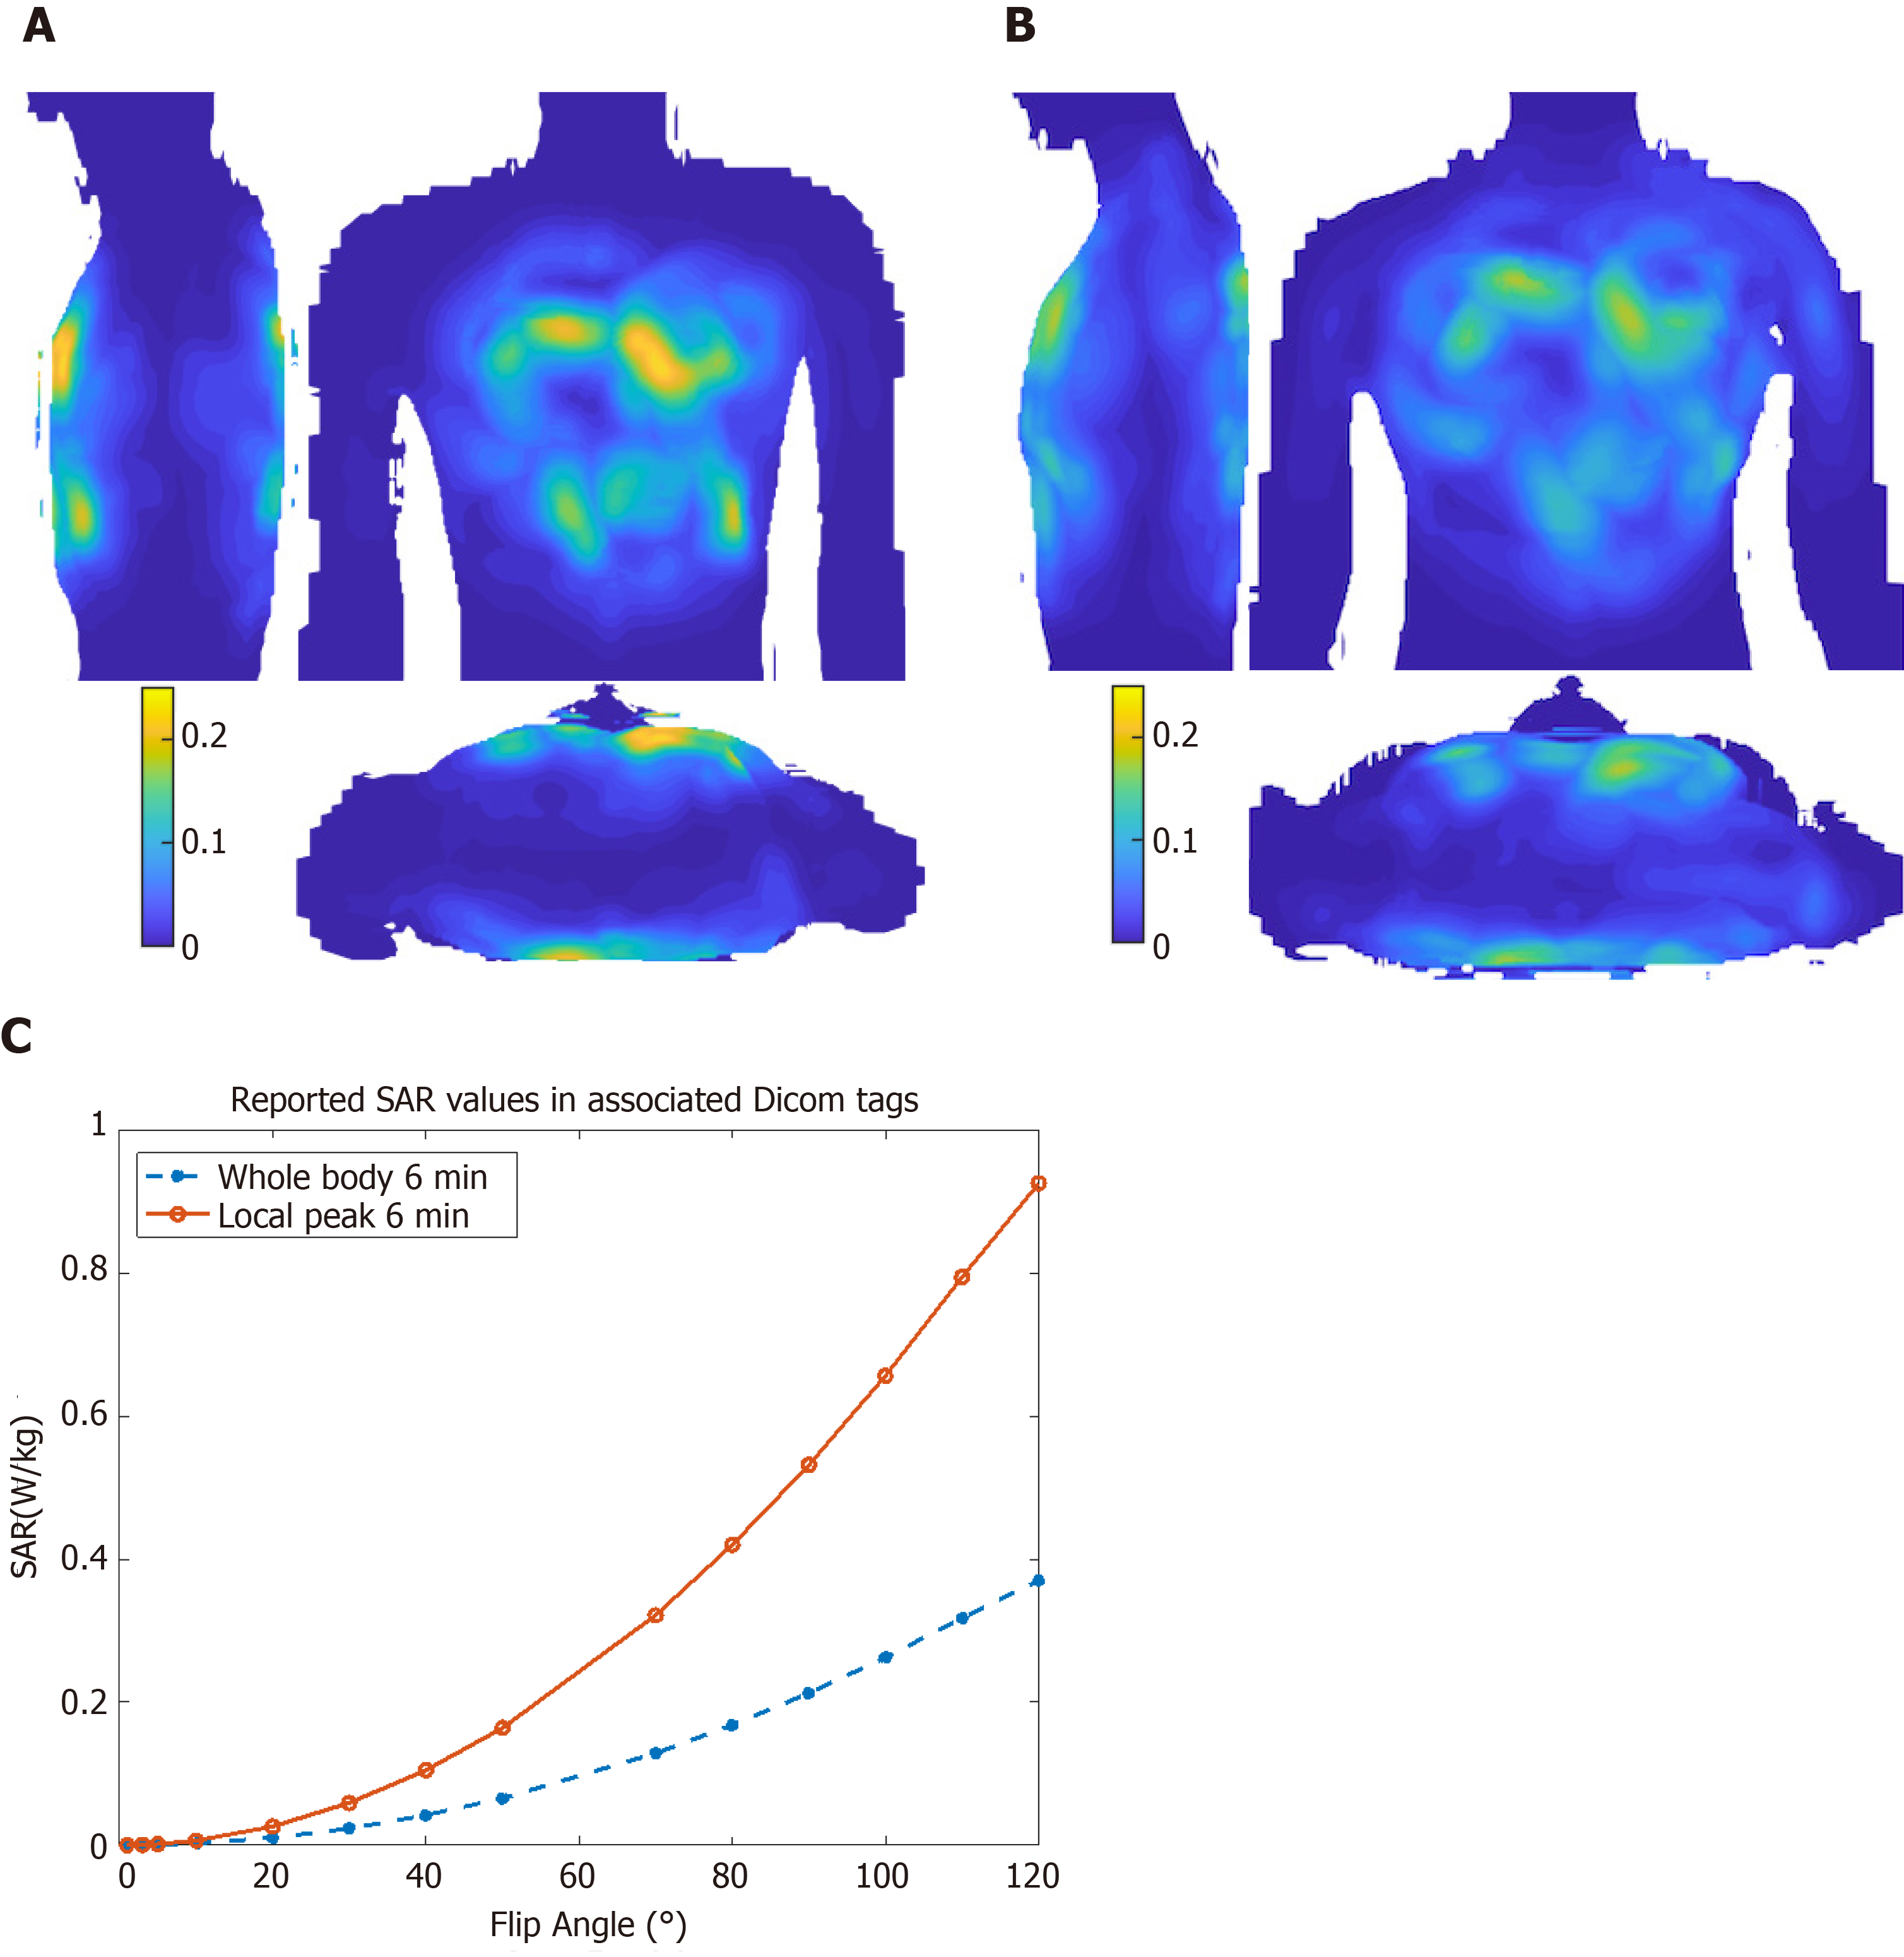
Figure 3 Specific absorption ratio calculations.
Maximum intensity projections of 10 g-averaged specific absorption ratio (SAR) normalized to 1W forward power at the coil plug using male ‘Duke’ (A) and female ‘Ella’ (B) virtual body modes; C: Reported SAR values for different flip angle from the cine scan Dicom tags in the subject in Figure 2. SAR: Specific absorption ratio.
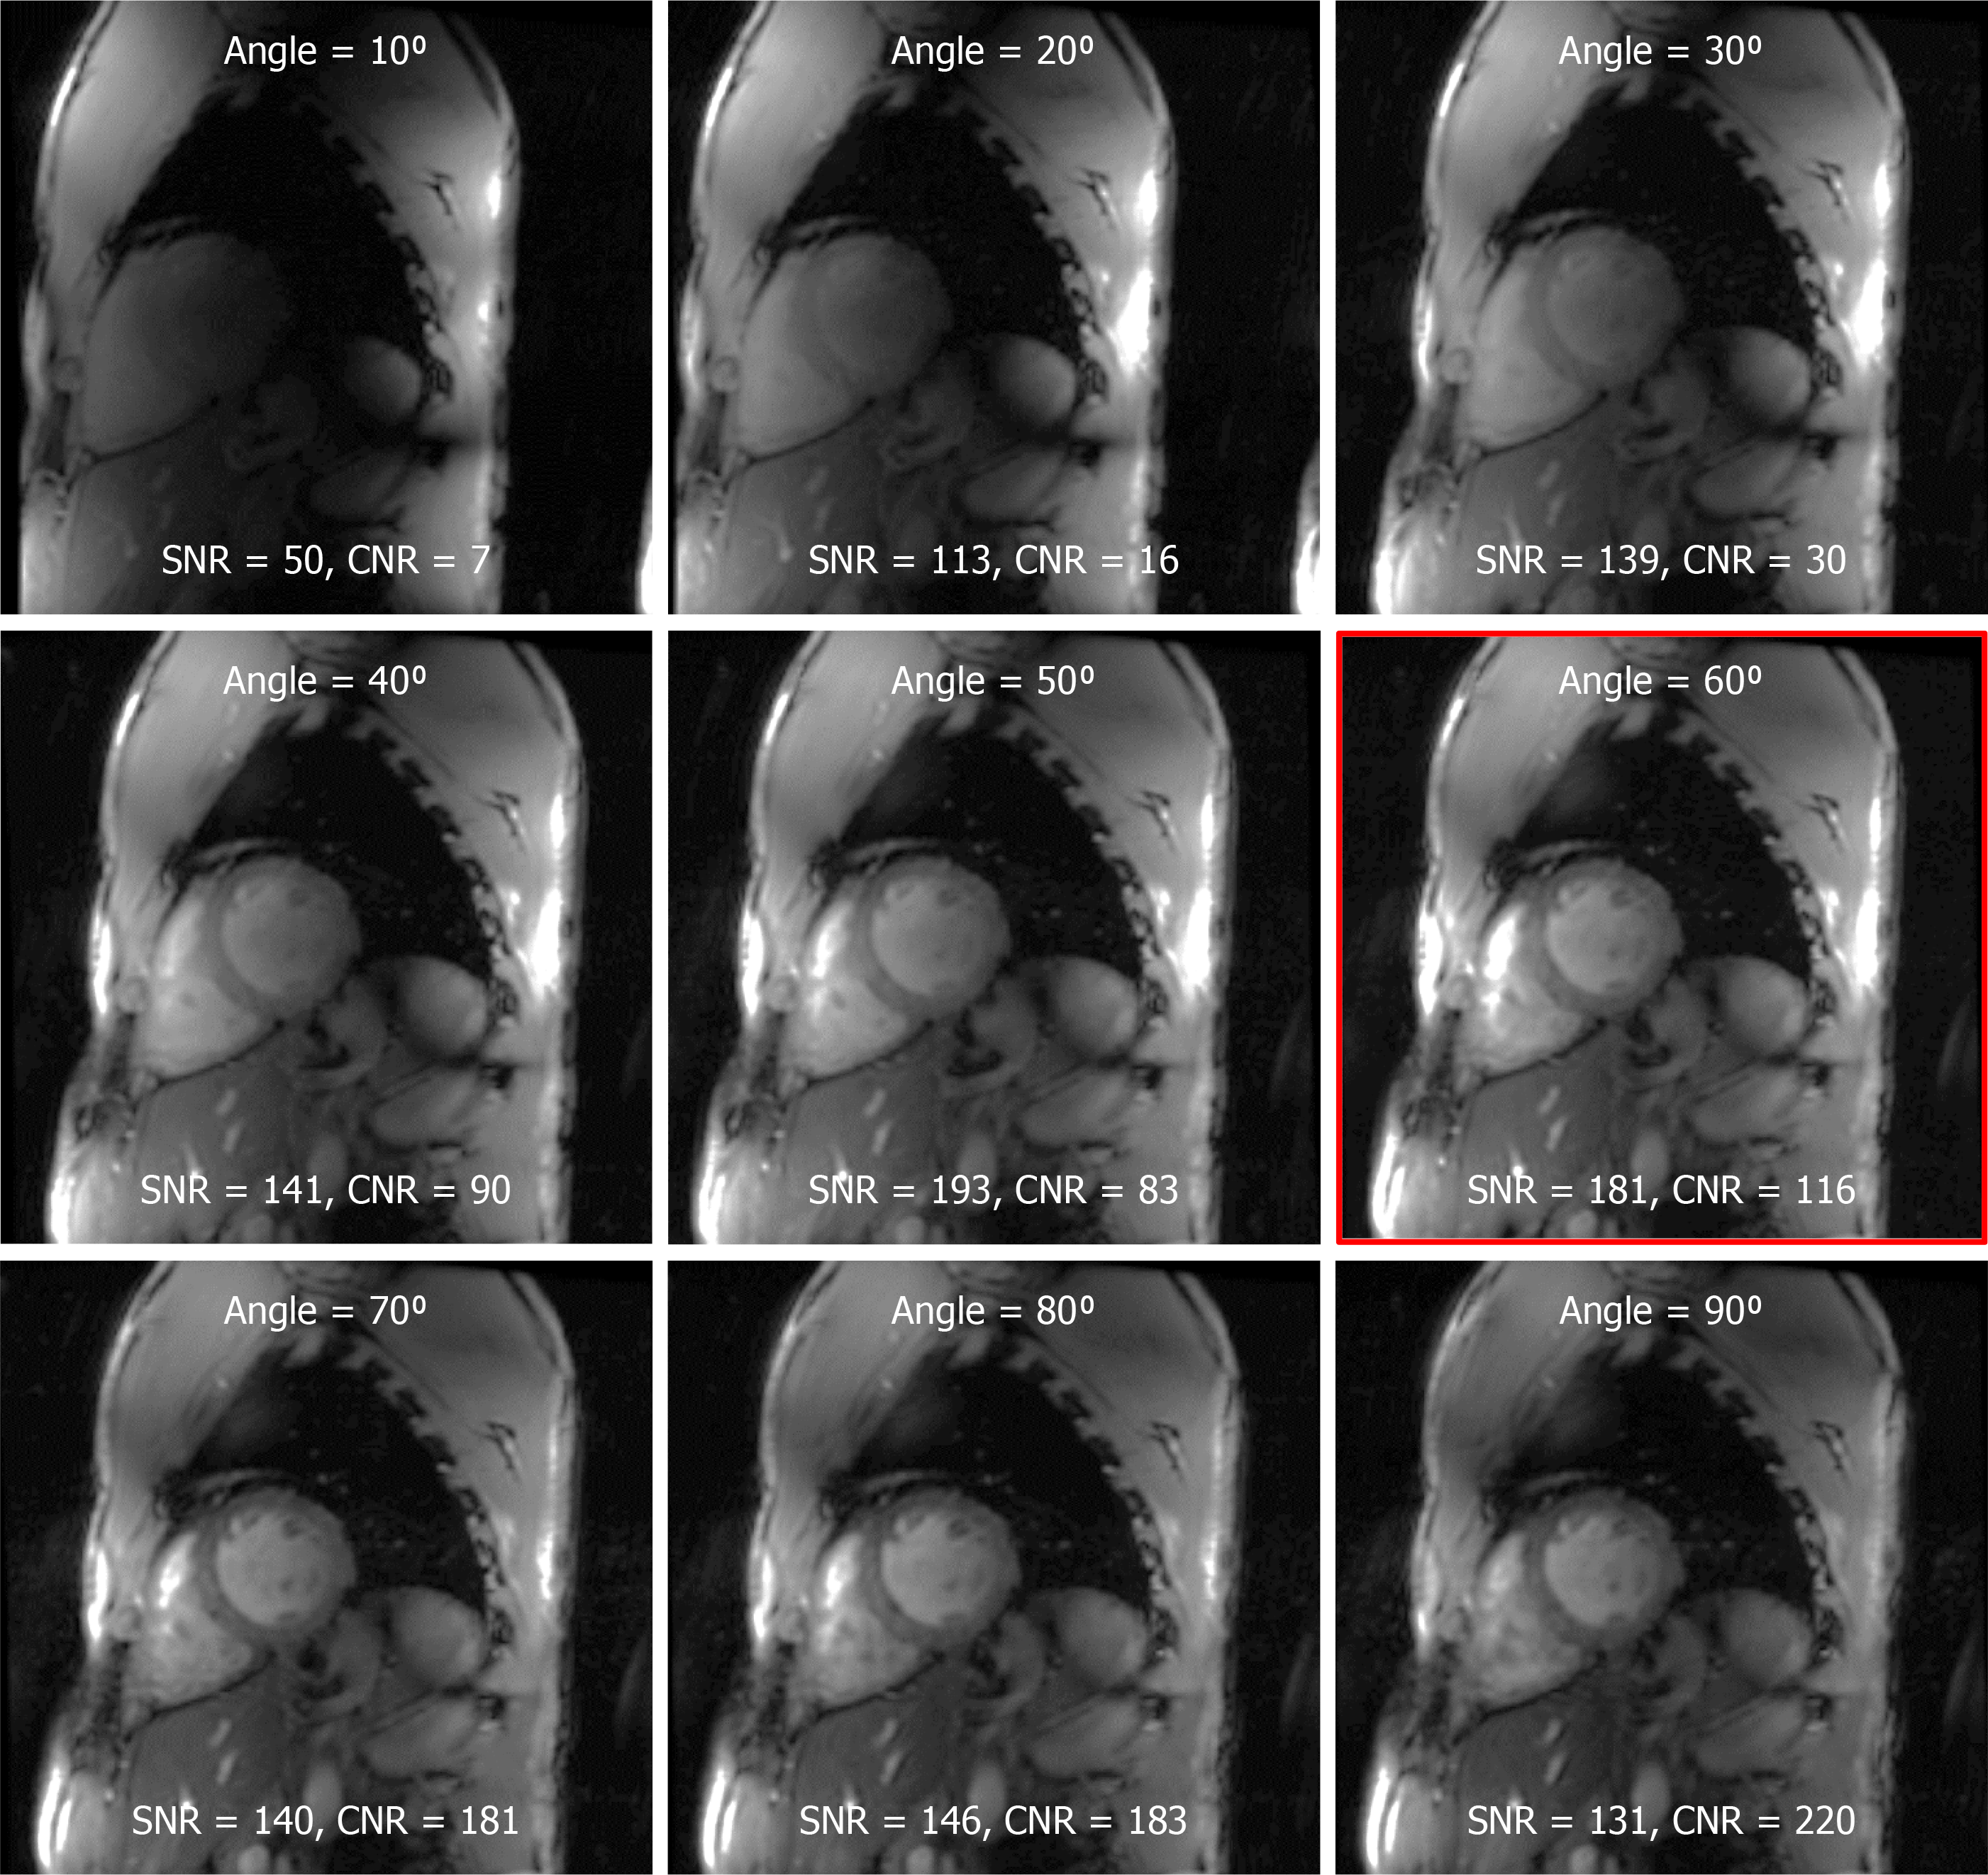
Figure 4 The effect of the prescribed flip angle on myocardium signal-to-noise ratio and blood-to-myocardium contrast-to-noise ratio.
Optimal signal-to-noise ratio (SNR) was achieved at prescribed flip angle of approximately 60° (red framed image). Although higher flip angles resulted in better blood-to-myocardium contrast-to-noise ratio, this came at the cost of reduced SNR. SNR: Signal-to-noise ratio; CNR: Contrast-to-noise ratio.
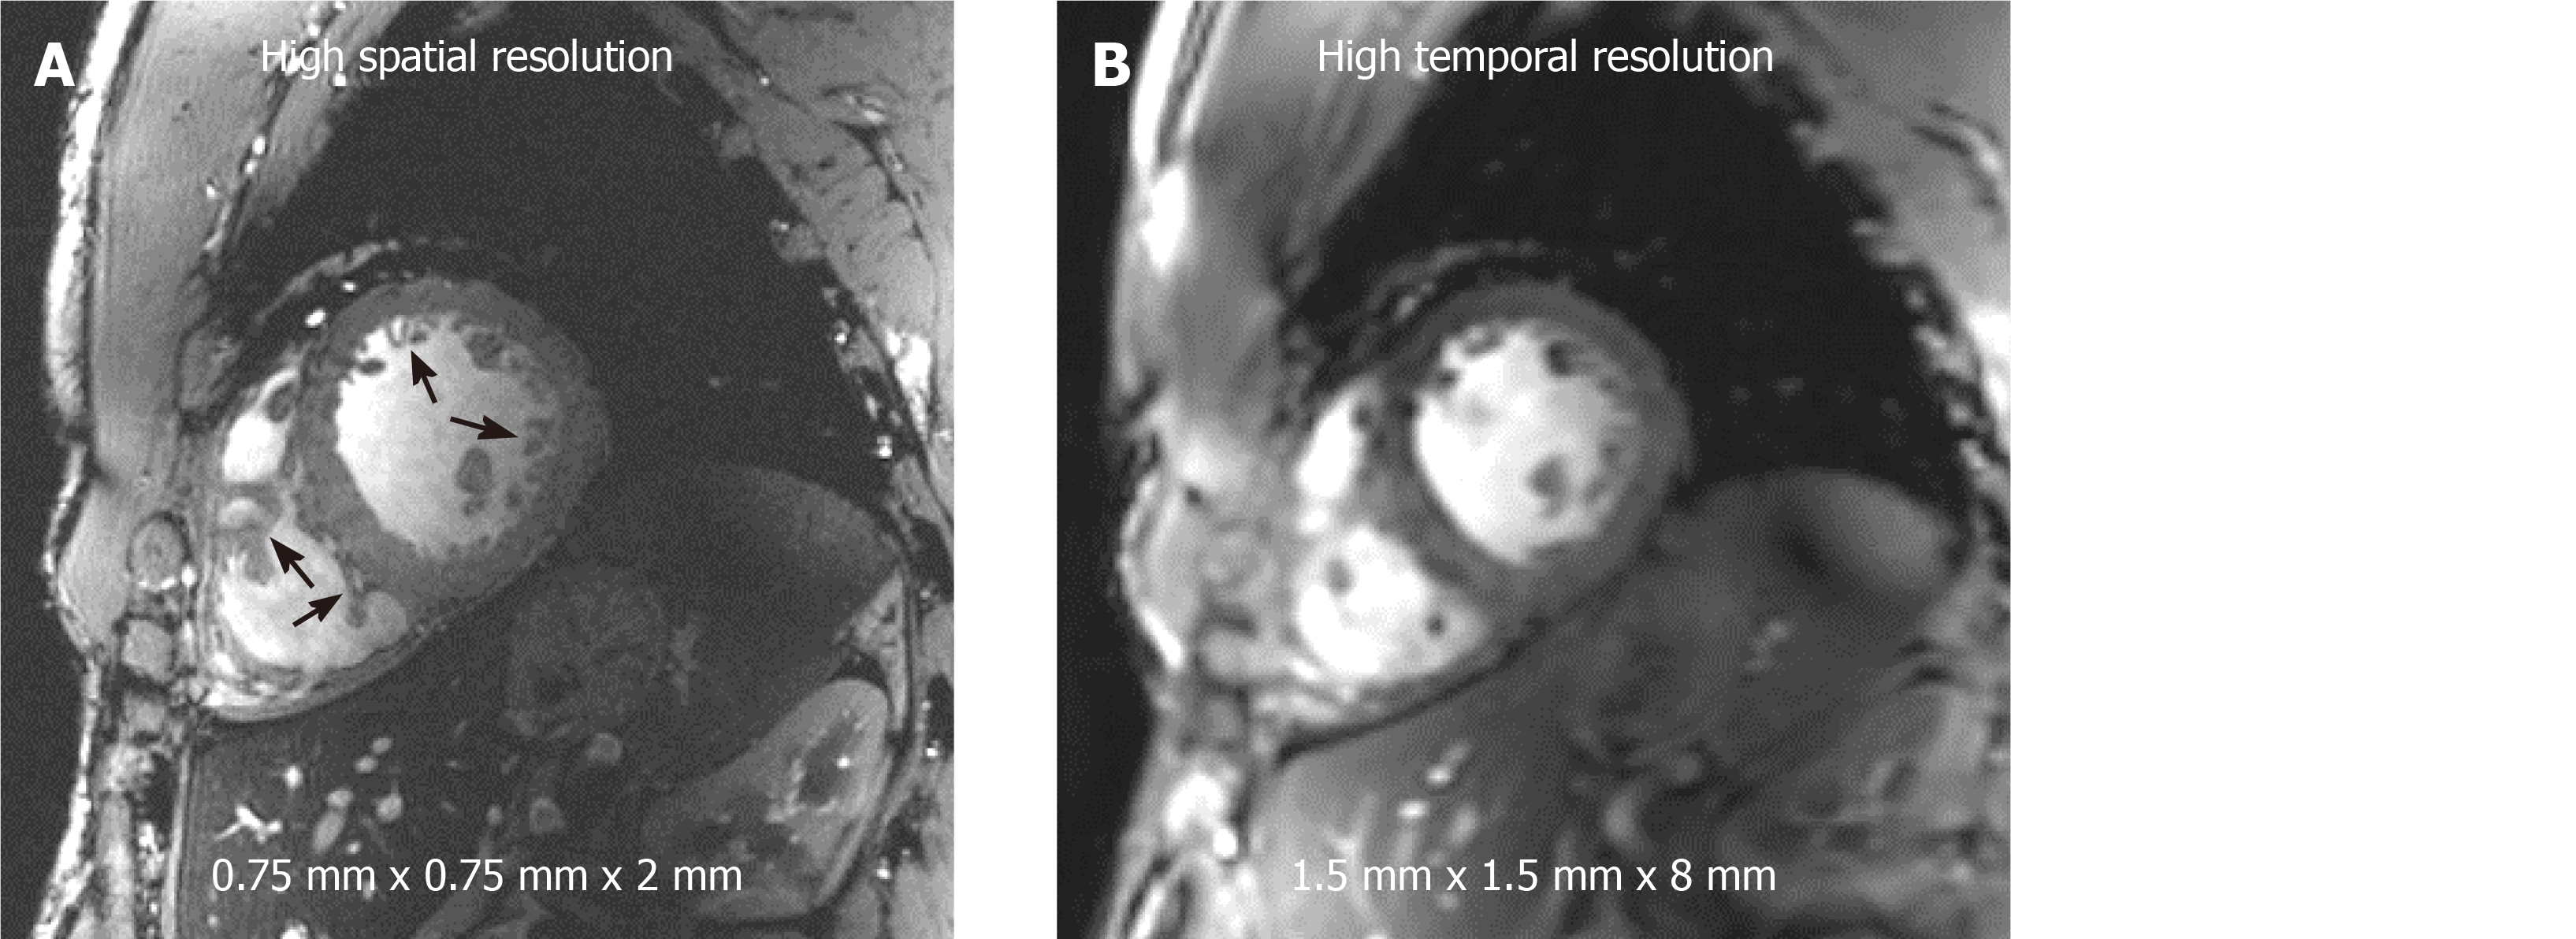
Figure 5 Improved image resolution achieved at 7T cardiac magnetic resonance imaging.
High signal-to-noise ratio (SNR) at 7T allows for achieving high spatial resolution with 16-fold reduction in voxel size (A) compared to standard clinical resolution in (B). Small voxel size illustrates anatomical details, such as the trabeculations and right ventricle details (arrows), that are not clearly visible at standard clinical resolution. Alternatively, high SNR can be traded for high temporal resolution (approximately 20 ms) imaging at conventional spatial resolution as in (B).
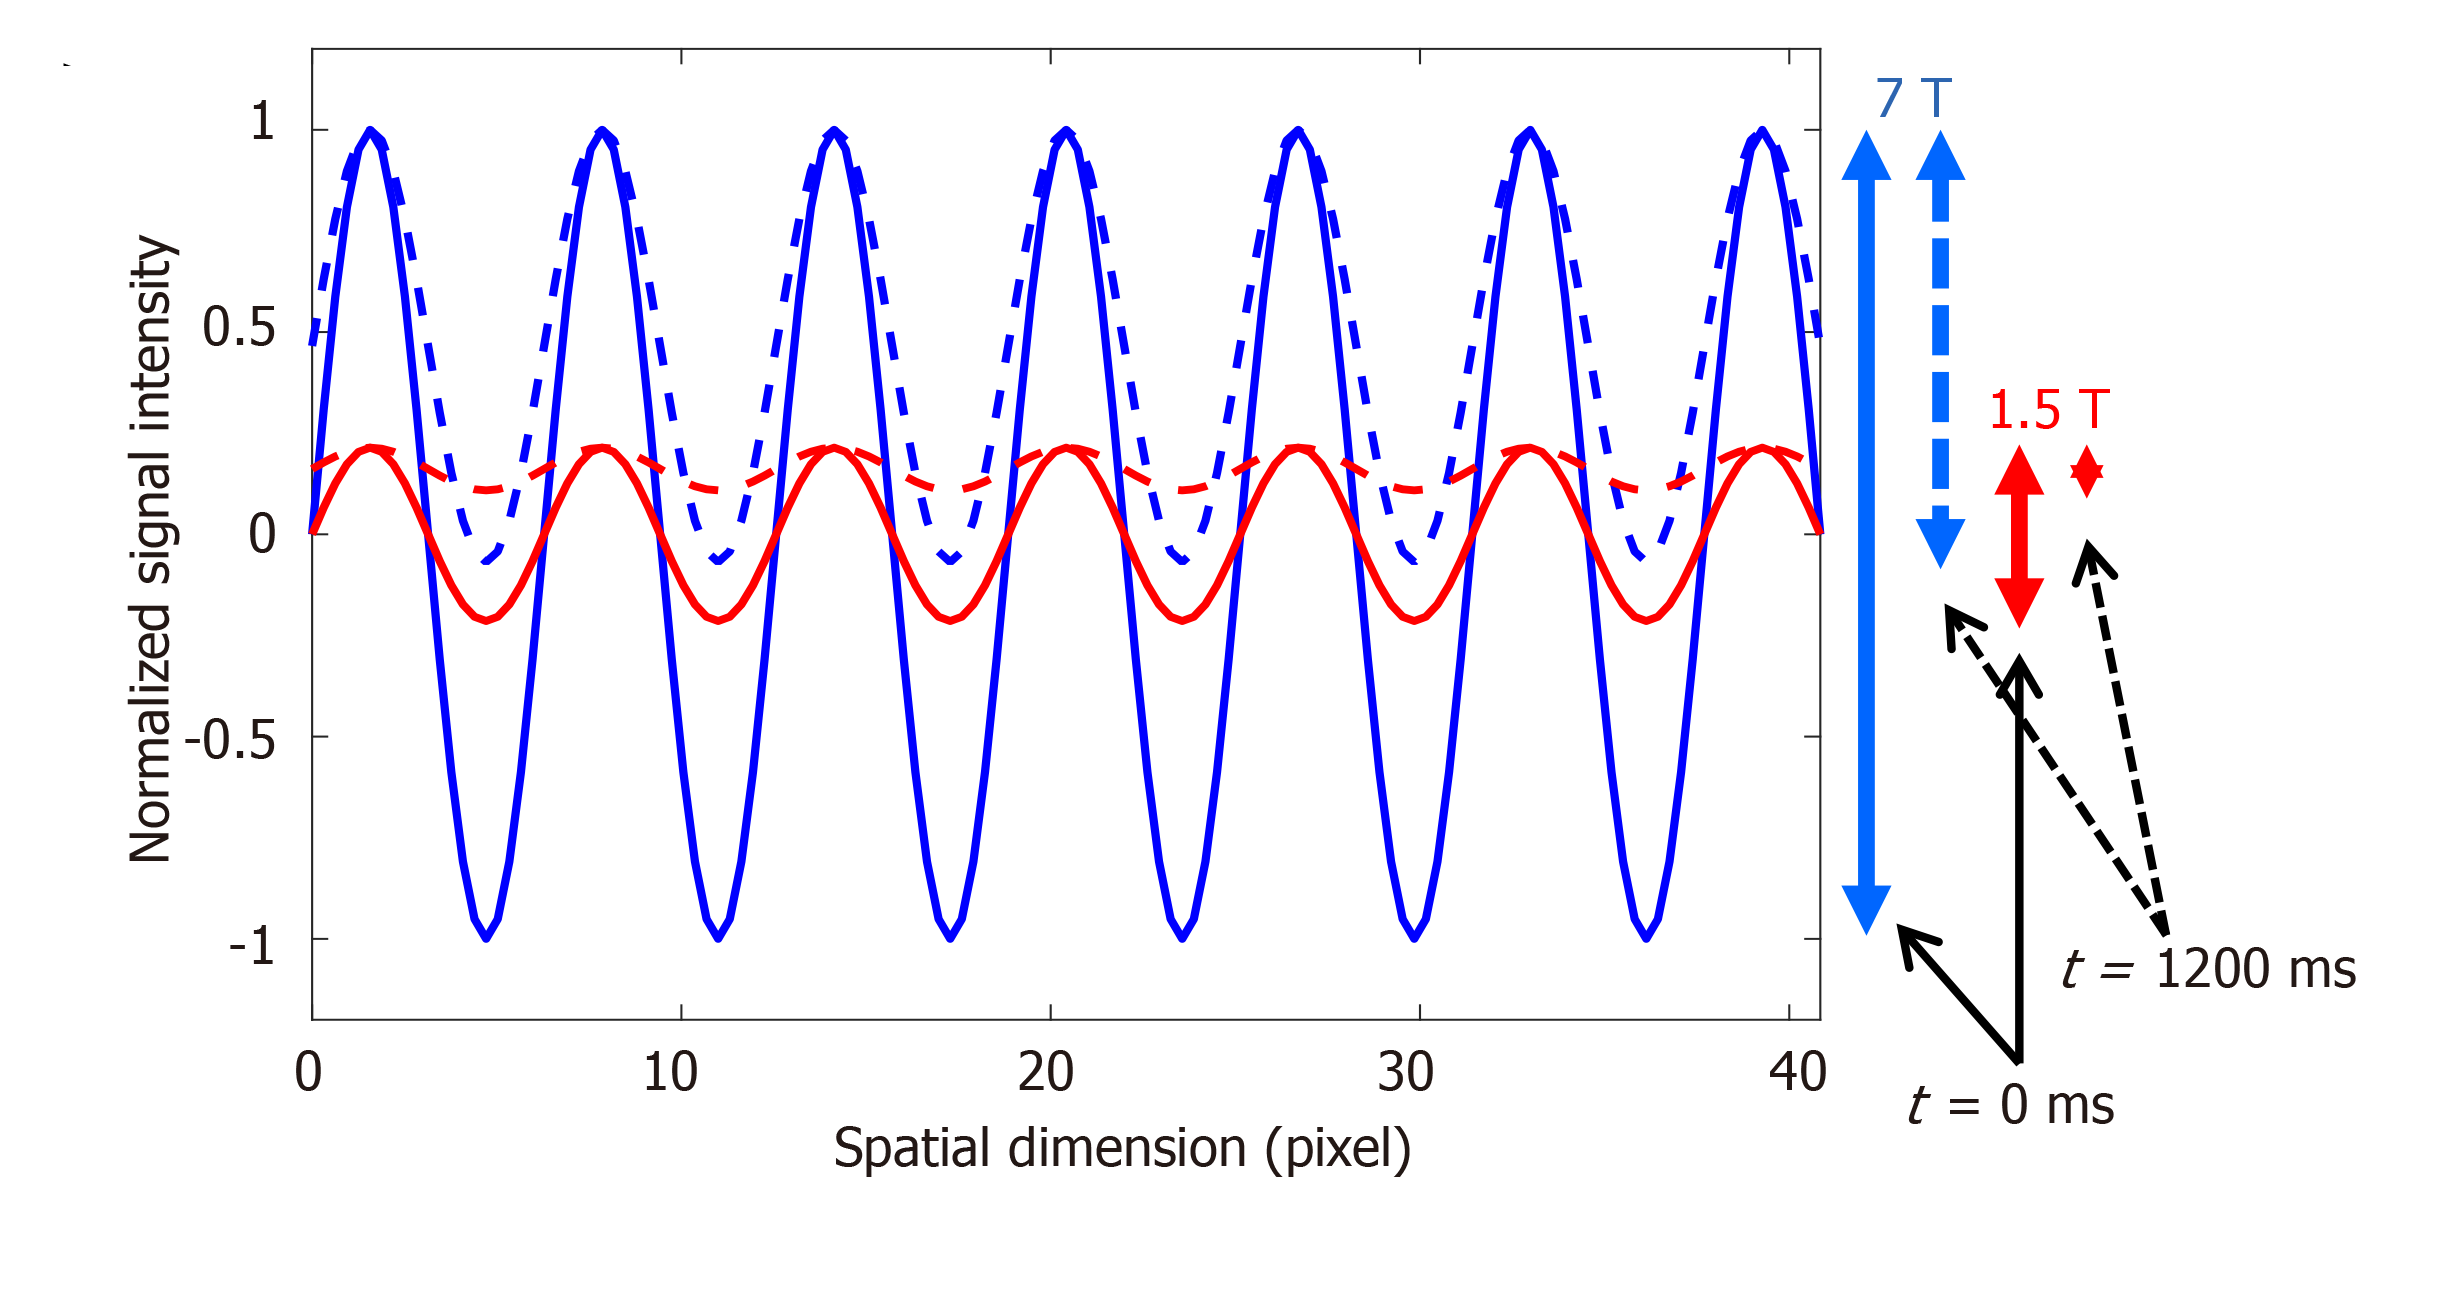
Figure 6 Improved tagging persistence at 7T cardiovascular magnetic resonance.
Numerical simulation of the effect of magnetic field strength on the tagging pattern persistence. The tagging patterns (blue, 7T; red, 1.5T) have maximum contrast (peak-to-peak difference) immediately after tagging creation at the beginning of the cardiac cycle (time = 0 ms), as represented by the solid lines. Note the difference in tagging contrast (vertical solid arrows on the right) corresponding to the difference in field strength. With time, longitudinal magnetization experiences exponential relaxation trying to reach equilibrium with different T1 values of the myocardium depending on the magnetic field strength (T1 = 850 ms and 1900 ms are used for 1.5T and 7T, respectively). By the end of a 1200 ms cardiac cycle (assuming heart rate of 50 bpm), the tagging patterns have experienced fading (dotted lines), such that there is a significant difference in tagging contrast between 7T and 1.5T, as represented by the vertical dotted arrows on the right, which results in diminished visibility of the tagging pattern by the end of the cardiac cycle at the low field strength.
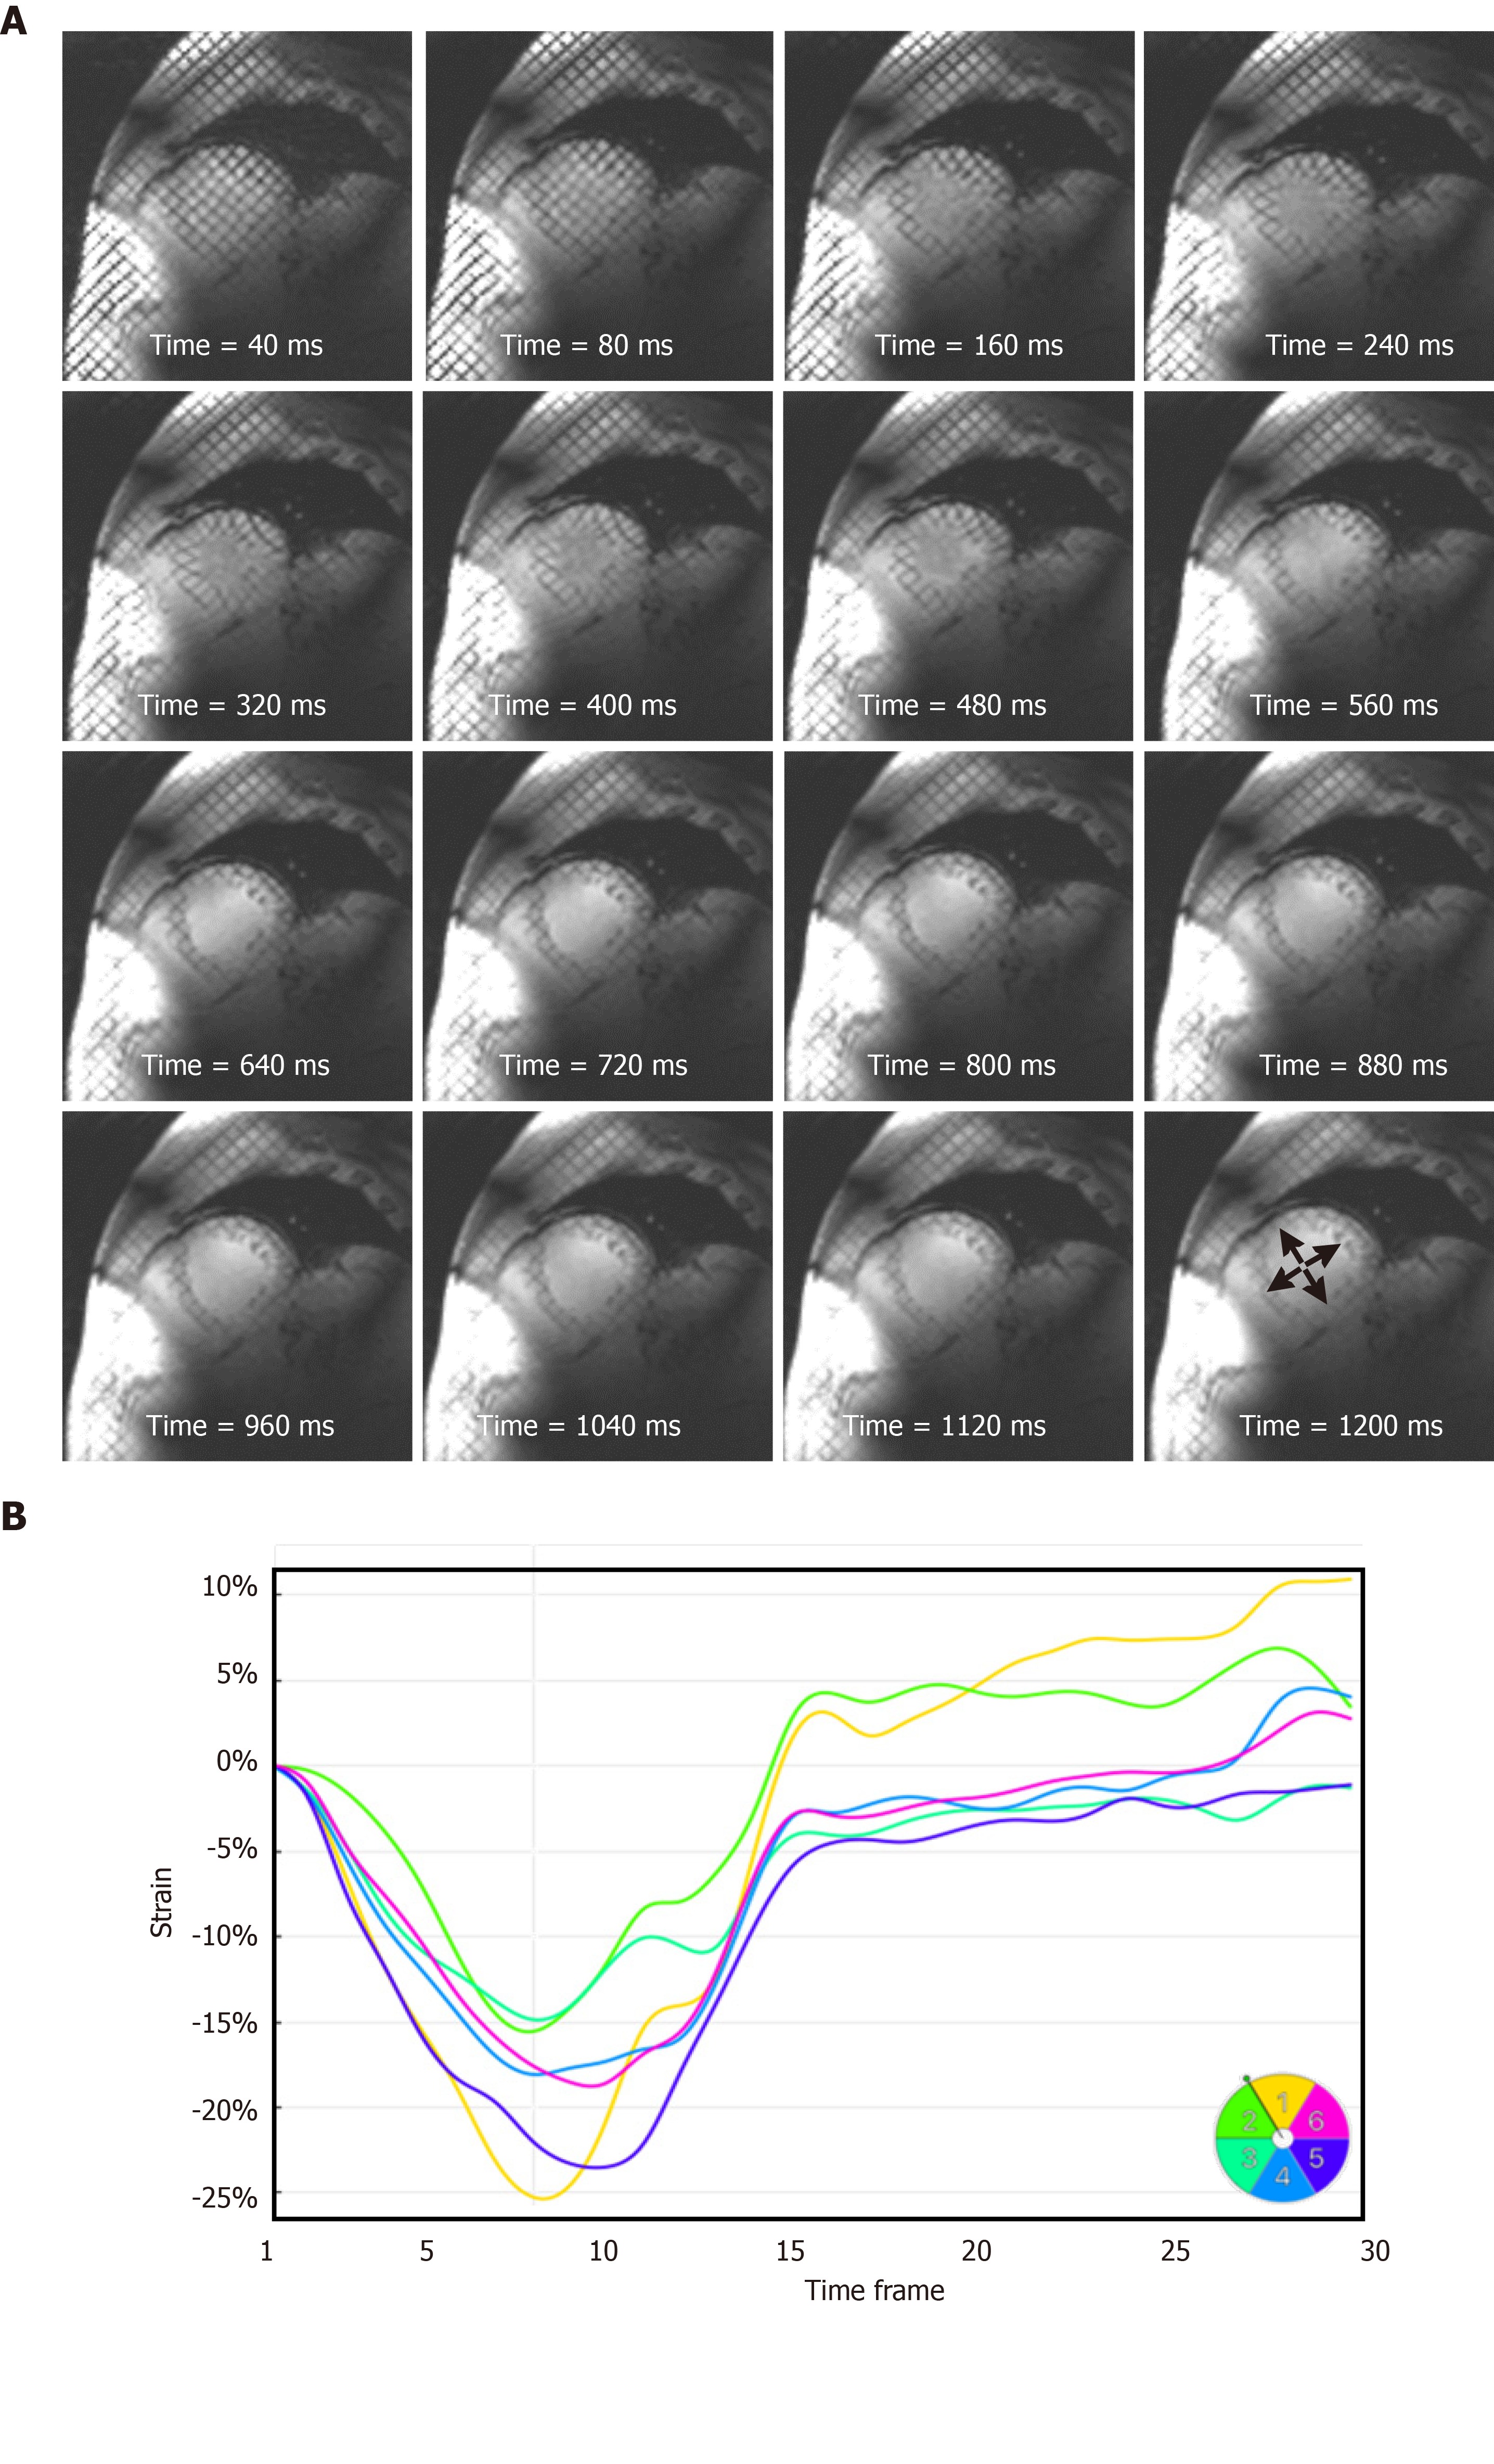
Figure 7 Strain analysis throughout the whole cardiac cycle at 7T cardiovascular magnetic resonance.
A: A series of tagged images acquired at different timepoints of a mid-ventricular short-axis slice throughout a 1200 ms cardiac cycle, showing tagging persistence until the last timeframe (arrows), which allows for measuring strain throughout end-diastole, which is not feasible at low magnetic field strength where the tagging pattern fades before the end of the cardiac cycle; B: Circumferential strain curves showing strain evolution throughout the whole cardiac cycle in different left-ventricular myocardial segments of the slice in (A). Segments are numbered according to American Heart Association 17-segment model.
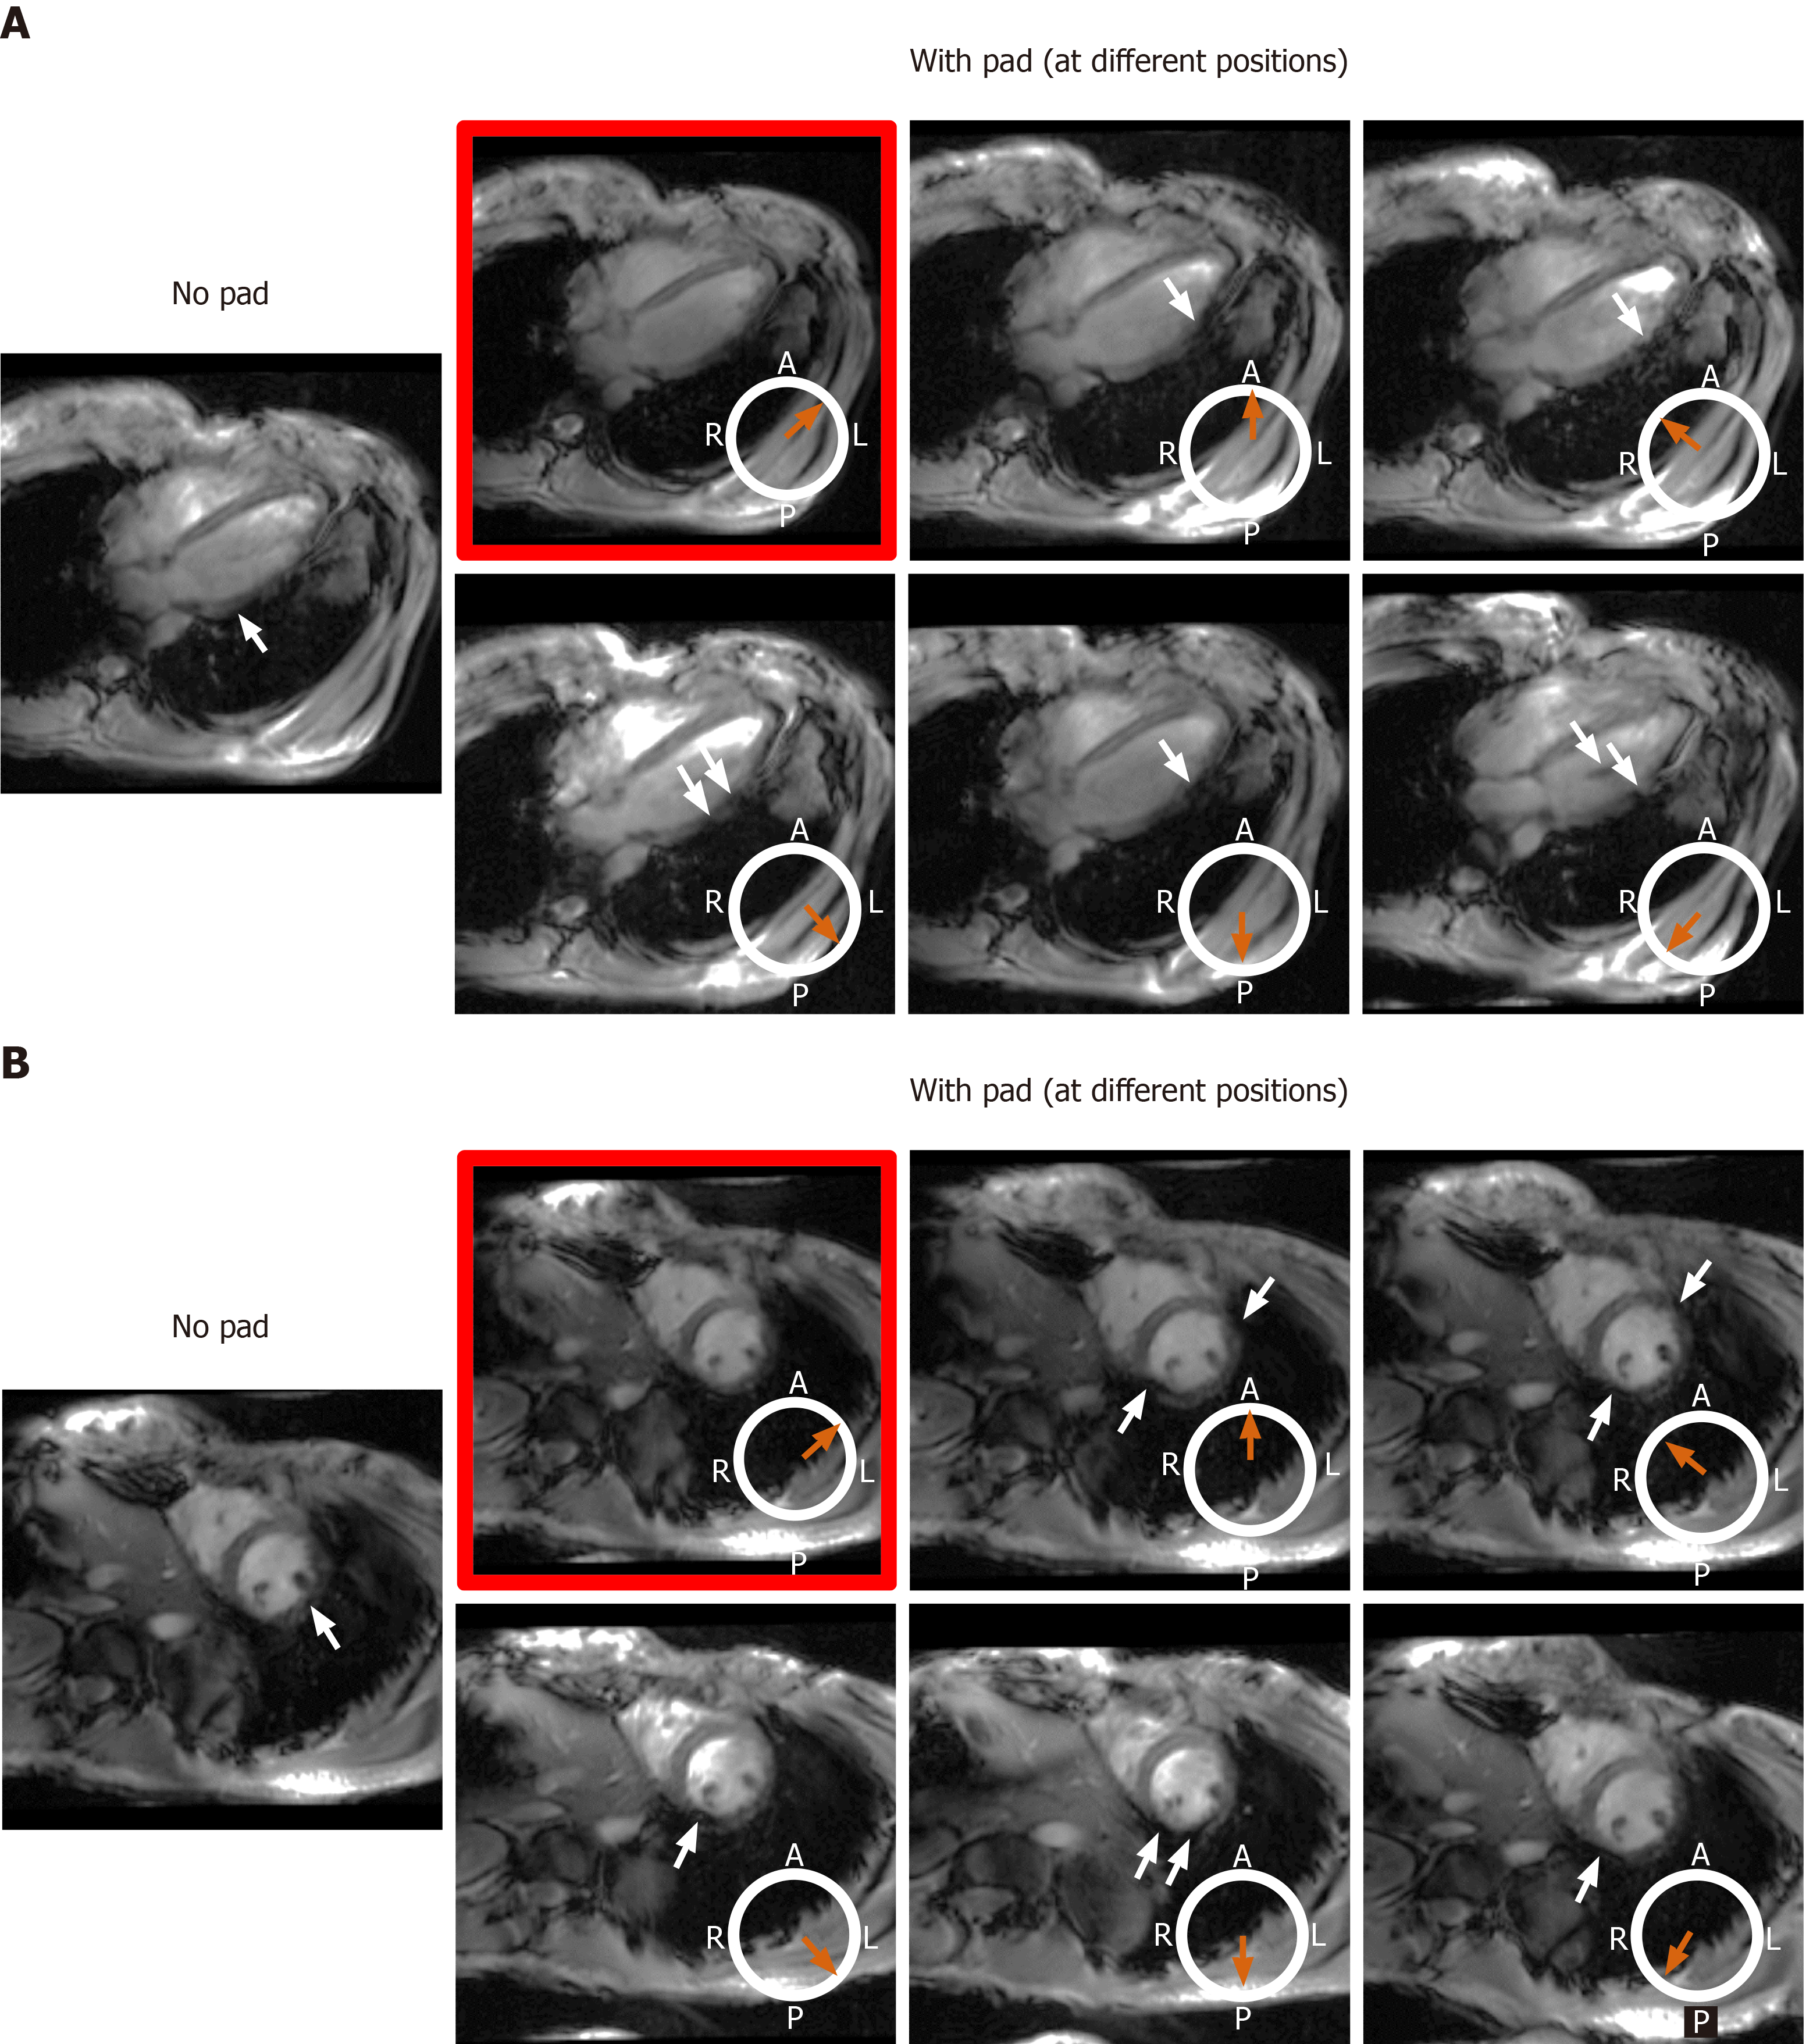
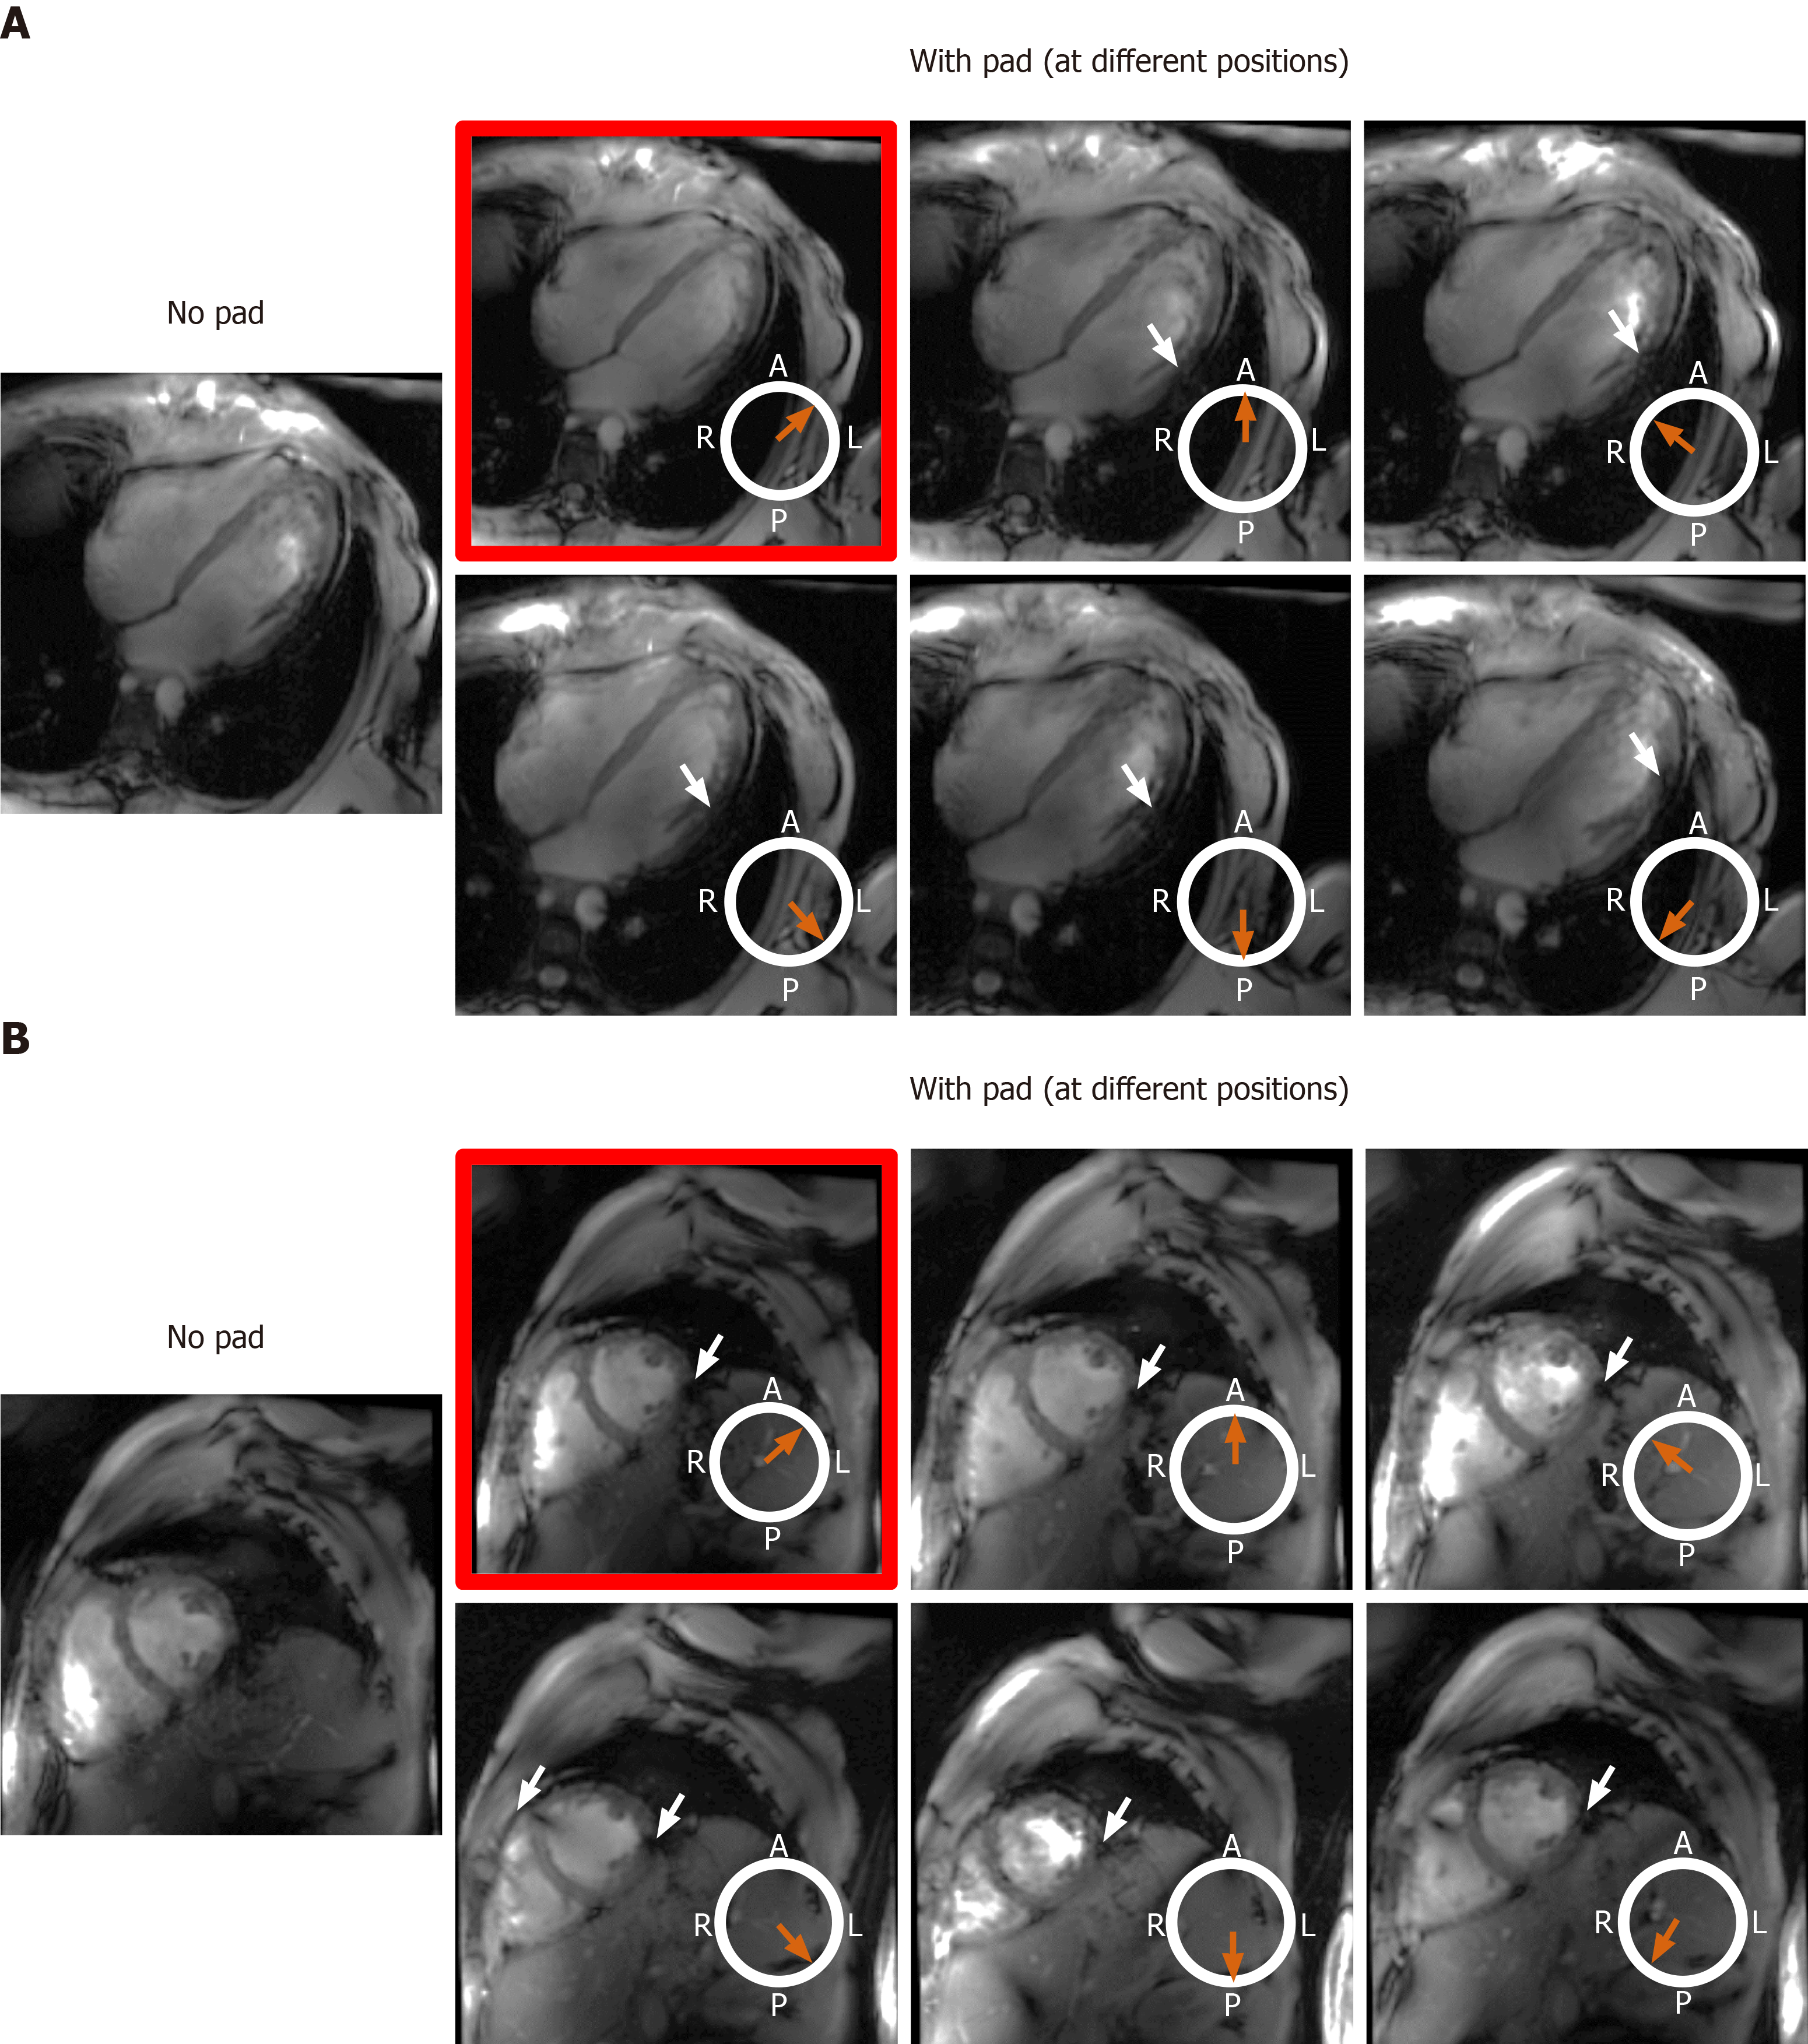
Figure 8 The effect of changing location of the dielectric pad on B1 field homogeneity in volunteers with small body habitus.
The place of the pad is indicated by the orange arrow with respect to an axial cross-section of the subject’s chest region (white circle, where subject was scanned in the supine position; A: Anterior, P: Posterior, L: Left, R: Right). Results from an underweight volunteer [body mass index = 19 kg/m2, chest expansions = 20 cm (AP) and 30 cm (LR)], as shown on long-axis (A) and short-axis (B) slices. Placing the pad at the anterior left position of the chest (image with red frame) resulted in improved B1 uniformity compared to other anterior and posterior positions, which showed regions of signal nulling (white arrows). This behavior was consistent in all scanned subjects with small body habitus.
Figure 9 The effect of changing location of the dielectric pad on B1 field homogeneity in volunteers with large body habitus.
The place of the pad is indicated by the orange arrow with respect to an axial cross-section of the subject’s chest region (white circle, where subject was scanned in the supine position; A: Anterior, P: Posterior, L: Left, R: Right). Results from an overweight volunteer [body mass index = 26.1 kg/m2, chest expansions = 27 cm (AP) and 30 cm (LR)], as shown on long-axis (A) and short-axis (B) slices. B1 uniformity was acceptable without using the pad (image on the left), which was similar to the case when the pad was positioned in the anterior left position of the chest (image with red frame). Changing the pad position resulted in slightly worse B1 uniformity, as shown by regions of signal nulling (white arrows). This behavior was consistent in all scanned subjects with large body habitus.
- Citation: Ibrahim EH, Arpinar VE, Muftuler LT, Stojanovska J, Nencka AS, Koch KM. Cardiac functional magnetic resonance imaging at 7T: Image quality optimization and ultra-high field capabilities. World J Radiol 2020; 12(10): 231-246
- URL: https://www.wjgnet.com/1949-8470/full/v12/i10/231.htm
- DOI: https://dx.doi.org/10.4329/wjr.v12.i10.231


