Copyright
©The Author(s) 2018.
World J Radiol. Apr 28, 2018; 10(4): 30-45
Published online Apr 28, 2018. doi: 10.4329/wjr.v10.i4.30
Published online Apr 28, 2018. doi: 10.4329/wjr.v10.i4.30
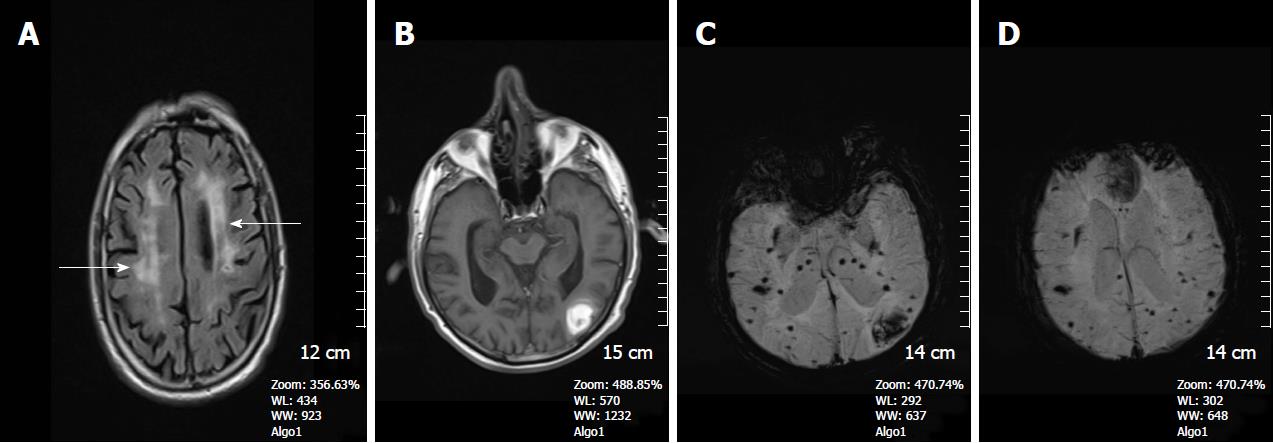
Figure 1 A 68-year-old man with cerebral amyloid angiopathy.
A: Axial FLAIR image demonstrates periventricular confluent hyperintense regions; B: Axial T 1 weighted SE image shows high signal intensity subacute hemorrhage in the left occipital lobe; C and D: On SWI minIP images, hemorrhage is depicted as a hypointense signal intensity lesion and, in addition to the left occipital lobar hemorrhage, one can see multiple microhemorrhagic lesions in the cortical and subcortical white matter from cerebral amyloid angiopathy. SWI: Susceptibility weighted imaging; minIP: Minimum intensity projection algorithm; SE: Spin echo.
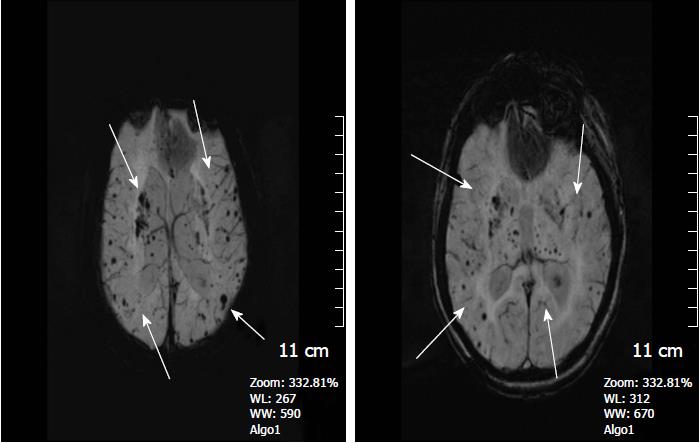
Figure 2 A 45-year-old woman with long standing chronic hypertension.
SWI minIP images depicts numerous microhemorrhages in the deep basal ganglia, thalami, and subcortical white matter regions, typical of hypertensive microangiopathy. SWI: Susceptibility weighted imaging.
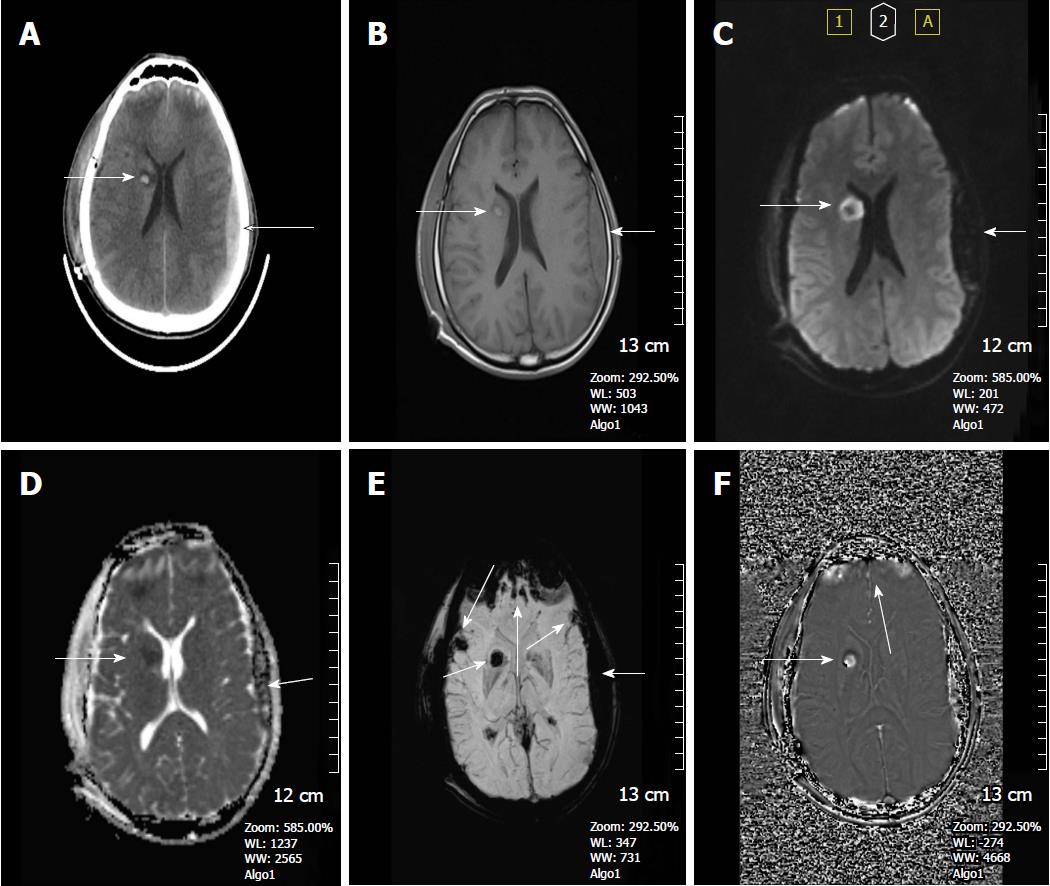
Figure 3 A 37-year-old man who had an accident was in coma after traumatic brain injury.
A: On the non-contrast CT image, bilateral frontal subcortical and right basal ganglia hyperdense hemorrhagic foci with surrounding hypodense edema are seen consistent with diffuse axonal injury. Also left parieto-temporal subdural hemorrhage is present. Post-op changes are present on the right with a tiny frontal subdural hematoma; B: SE T1W image, can only reveal hyperintense right basal ganglia hemorrhagic lesion with surrounding hypointense edema and left subdural hemorrhage, but can not demonstrate the other parenchymal lesions; C: Diffusion weighted image (DWI) reveals hyperintense caudate lesions; D: Apparent diffusion coefficients (ADC) map demonstrates restricted diffusion within the lesions; E: SWI minIP image, clearly depicts multiple frontal cortical and subcortical and also right basal ganglion microhemorrhages better than those of CT and T1W MR image. The bilateral subdural hematomas are nearly as dark as the cortical bone; F: Phase contrast SWI image, hemorrhagic lesions show a bright/positive shift effect on phase image, due to paramagnetic susceptibility effect. SWI: Susceptibility weighted imaging; minIP: Minimum intensity projection algorithm; SE: Spin echo.
Figure 4 A 21-year-old man with left frontal cavernous malformation.
A: On the axial FSE T2W image, a left frontal cavernous malformation is seen with typical pop-corn appearance, surrounded by a thick hemosiderin rim; B: SWI shows prominent blooming artİfact due to paramagnetic effect. Another patient is a 39-year-old man with left cerebellar tonsil cavernous malformation; C: Axial FSE T2W image, clearly depicts the cavernous malformation consisting of a high signal intensity core and a peripheric low signal intensity hemosiderin; D: On SWI, the lesion is more conspicuous. Note how the brighter central areas on the T2WI are obscured by the susceptibility artifact. SWI: Susceptibility weighted imaging; FSE: Fast spin echo.
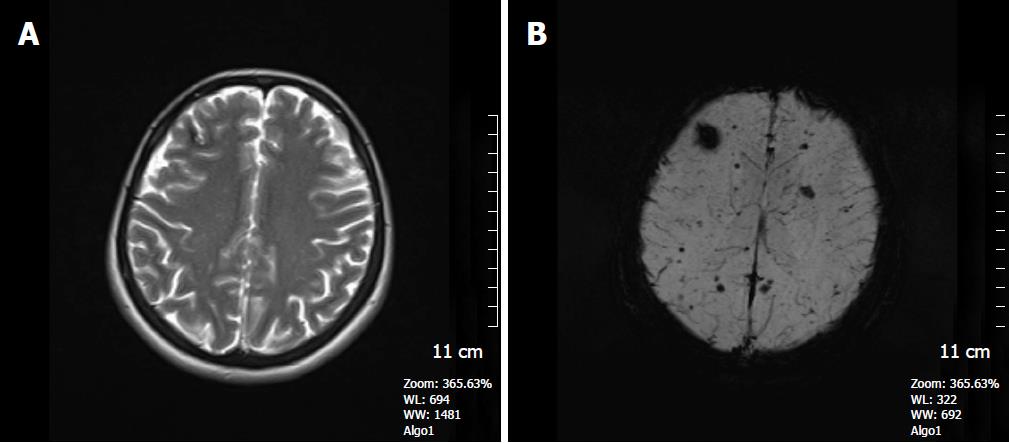
Figure 5 A 41-year-old woman who had a history of familial cavernous malformation underwent magnetic resonance imaging screening.
A: Axial FSE T2W image, a right frontal subcortical small cavernous malformation is seen on this image; B: SWI minIP image, numerous tiny cavernous malformations throughout the brain parenchyma is detected. FSE T2W image is unable to show these lesions. The patient was considered to have familial cerebral cavernous malformation. SWI: Susceptibility weighted imaging; FSE: Fast spin echo.
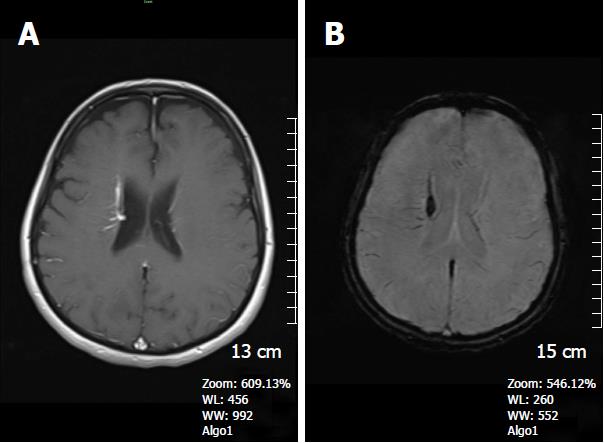
Figure 6 A 62-year-old woman complaining of long-term headache attacks.
A: Axial post-contrast T1W image shows contrast- enhanced dilated medullary veins which seem to converge into a dilated transcortical collector vein in the right periventricular region consistent with developmental venous anomaly; B: Axial SWI minIP image, has an excellent agreement with former image, revealing classical caput medusa appearance. SWI: Susceptibility weighted imaging; minIP: Minimum intensity projection algorithm.
Figure 7 A 65-year-old man with incidentally discovered capillary telangiectasia in the pons.
A: Axial FSE T2W image shows a hyperintense lesion located in the central pons; B: Axial contrast-enhanced T1W image reveals very little contrast enhancement in the lesion; C: SWI image demonstrates a markedly hypointense lesion in the pons indicating a capillary telangiectasia based on its location and size. SWI: Susceptibility weighted imaging; FSE: Fast spin echo.
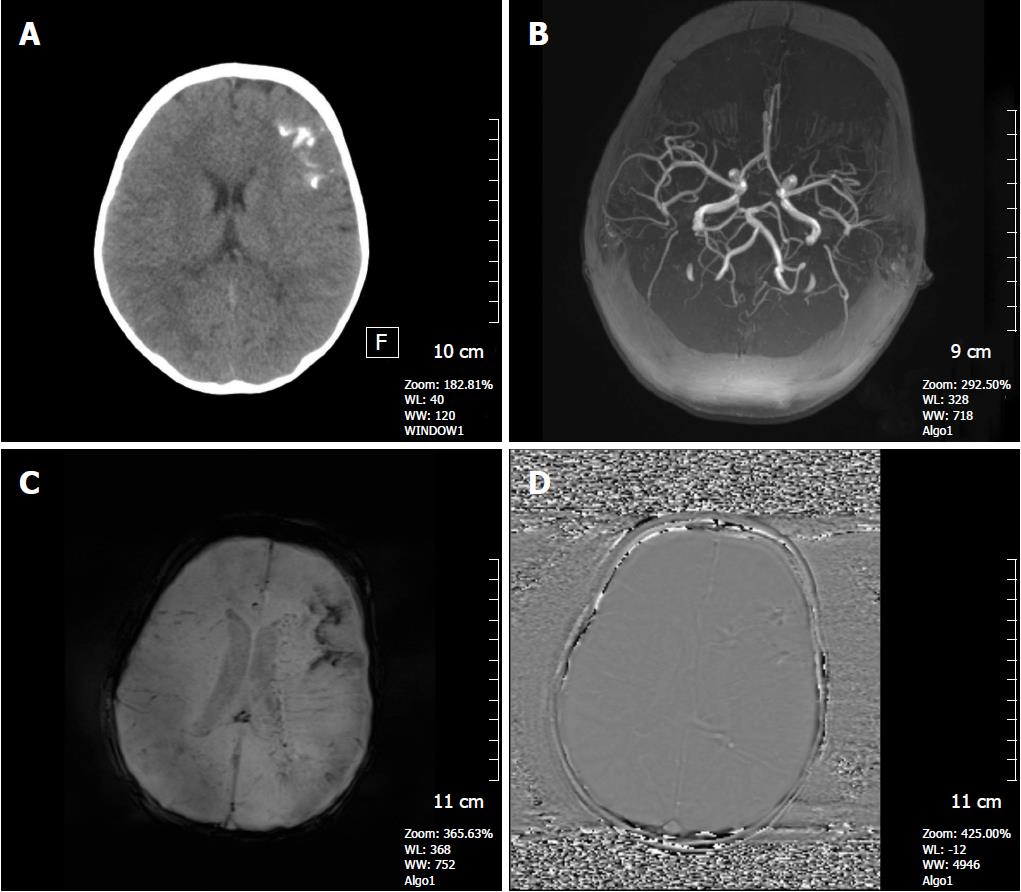
Figure 8 A 3-year-old girl with Sturge-Weber syndrome.
A: Non-contrast CT image shows hyperdense tram-track calcifications along the left frontal gyri; B: Axial MIP TOF MRA shows a normal cranial angiogram; C: Axial SWI minIP image, hypointense gyral calcification is clearly depicted, also deep abnormal transmedullary veins are visible; D: SWI phase image confirms these calcifications as low signal intensitiy areas. SWI: Susceptibility weighted imaging; minIP: Minimum intensity projection algorithm.
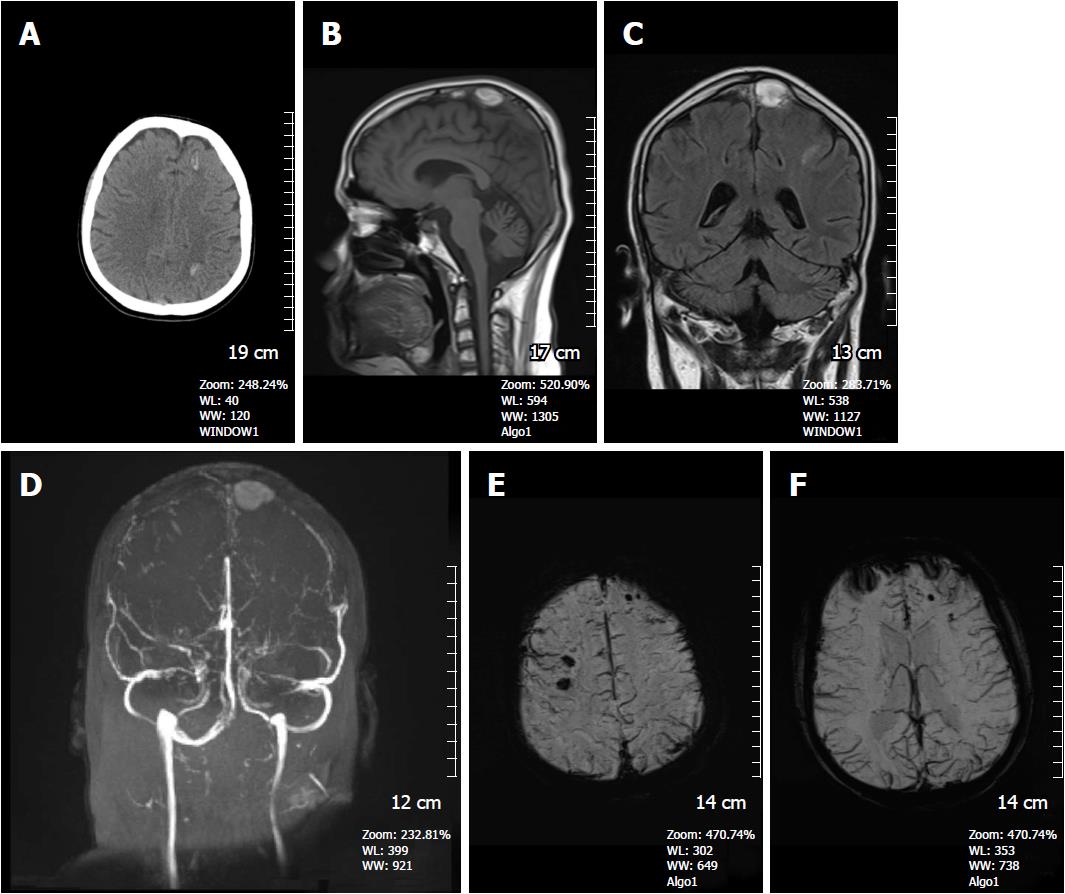
Figure 9 A 16-year-old man presented with superior sagittal sinus thrombosis.
A: Non-contrast CT image shows hyperdense hemorrhagic foci in the left frontal and left parietal lobe at the convexity level (arrows); B: On the sagittal T1W image, a hyperintense thrombus is detected in the superior sagittal sinus; C: Coronal FSE T2W image, thrombus again shows hyperintense signal intensity; D: Time of flight non-contrast MR venography, absence of normal venous flow and accompanying thrombus are clearly depicted; E and F: SWI minIP images demonstrates hypointense microhemorrhages in the brain parenchyma with diffuse dilated venous structures indicating venous engorgement due to venous hypertension. SWI: Susceptibility weighted imaging; minIP: Minimum intensity projection algorithm.
Figure 10 An 18-year-old man presenting with drastic headache and dizziness.
A: Non-contrast CT image reveals a partially calcified hyperdense lesion suspicious for left MCA aneurysm versus cavernoma; B: CT angiography demonstrates a left MCA M 1 distal segment aneurysm; C: FLAIR image, left sylvian fissure seems unremarkable with no hemorrhage seen; D: SWI magnitude image shows hypointense acute subarachnoid hemorrhage along the left sylvian fissure. Subinsular low intensity is at edge of aneurysm (arrow). SWI: Susceptibility weighted imaging.
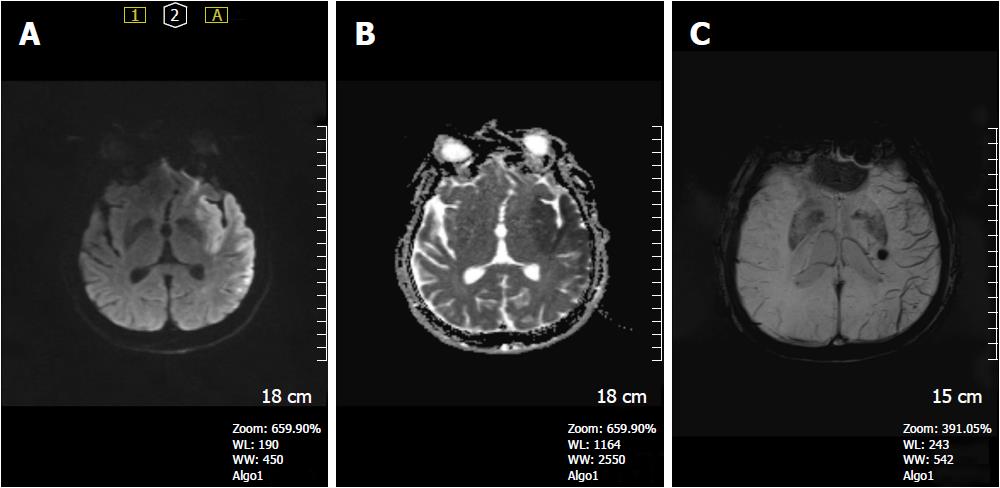
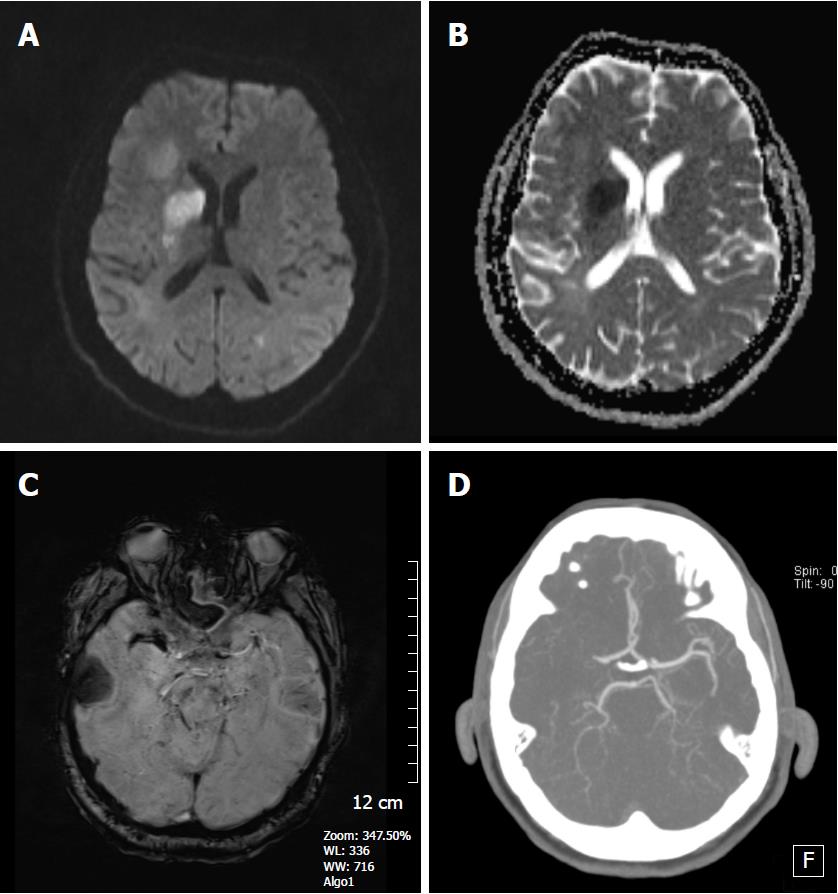
Figure 11 A 38-year-old man complaining of right side weakness.
A: DWI shows hyperintense lesion in the left temporo-insular region; B: ADC map reveals restricted diffusion in the corresponding area indicating a left MCA acute infarct; C: SWI minIP image, prominent cortical veins are seen within the left MCA territory reflecting relatively increased deoxyhemoglobin concentration in the ischemic region. Incidental cavernoma in left thalamus is seen. SWI: Susceptibility weighted imaging; minIP: Minimum intensity projection algorithm; DWI: Diffusion weighted image; ADC: Apparent diffusion coefficients.
Figure 12 A 68-year-old woman with right lenticulostriate acute infarct.
A: DWI reveals high signal intensity lesion in the right caudate nucleus head and lentiform nucleus region; B: ADC map shows restricted diffusion consistent with an acute infarct; C: Non-contrast CT image, hyperdense artery sign is seen along the right MCA artery; D: SWI magnitude image shows susceptibility vessel sign in the same region corresponding to the CT image indicating an acute thrombus. SWI: Susceptibility weighted imaging; DWI: Diffusion weighted image; ADC: Apparent diffusion coefficients; MCA: Middle cerebral artery.
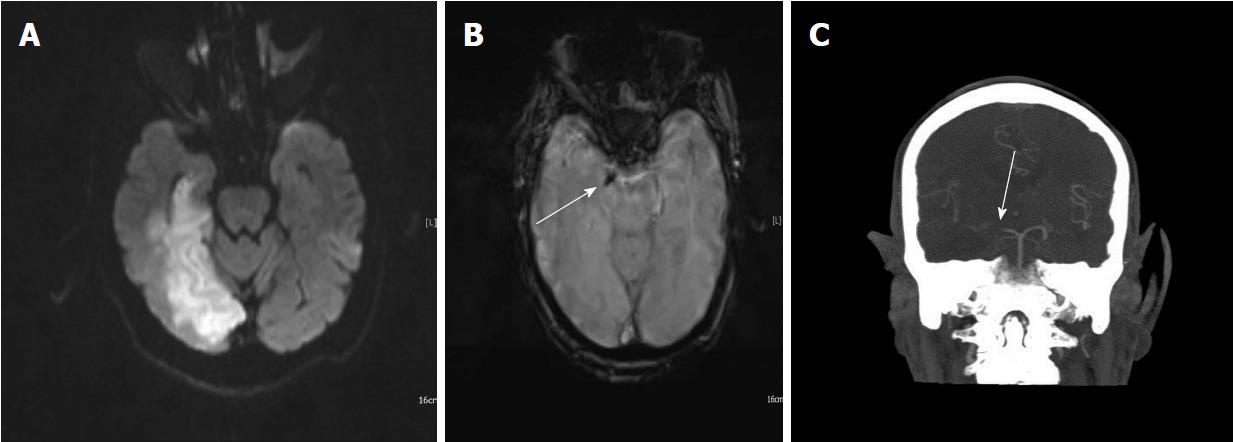
Figure 13 An 87-year-old woman with right posterior cerebral artery infarct.
A: DWI shows right temporo-occipital PCA territory infarct; B: SWI magnitude image shows right PCA P1 segment susceptibility sign; C: Coronal CT MIP angiography image confirms right proximal PCA occlusion. SWI: Susceptibility weighted imaging; PCA: Posterior cerebral artery; DWI: Diffusion weighted image.
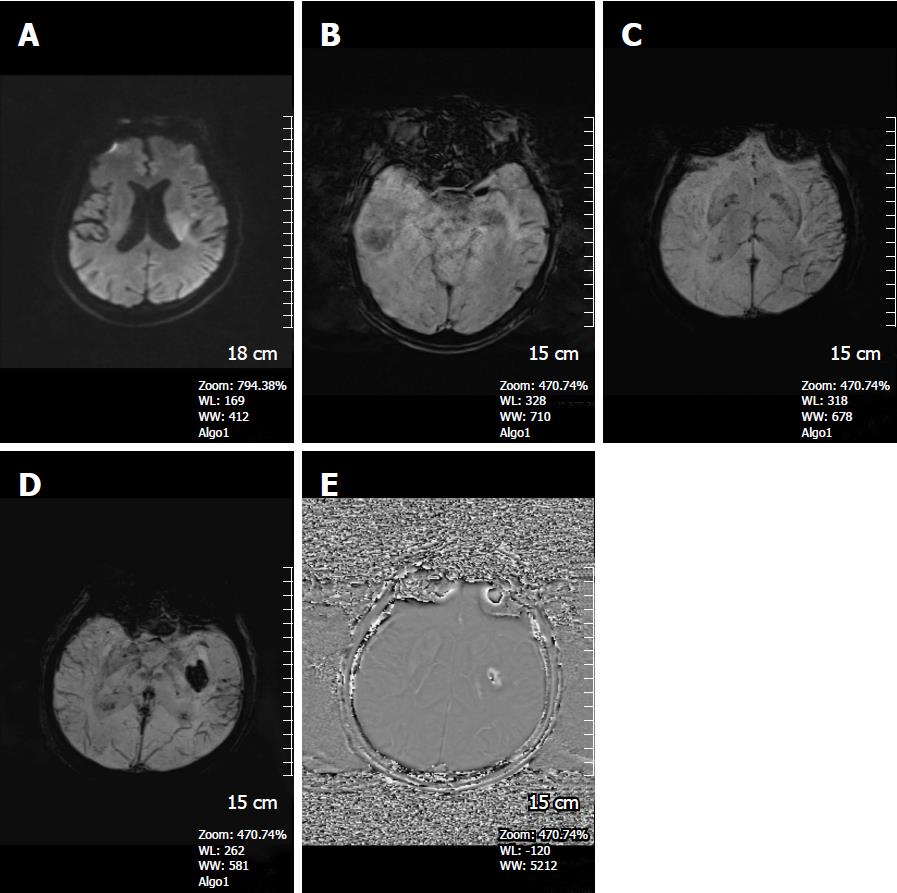
Figure 14 A 50-year-old man patient with acute left middle cerebral artery infarct.
A: DWI, showing a left periventricular hyperintense lesion; B: SWI magnitude image detects left MCA susceptibility vessel sign; C: SWI minIP image reveals prominent hypointense veins in the infarct region; D: Three days later, new SWI minIP image shows hemorrhage in the infarct area indicating development of hemorrhagic transformation. There continues to be perminent venous visualization in the left temporal lobe; E: SWI phase image confirms the hemorrhage leading to a positive shift effect. SWI: Susceptibility weighted imaging; PCA: Posterior cerebral artery; DWI: Diffusion weighted image; minIP: Minimum intensity projection algorithm; MCA: Middle cerebral artery.
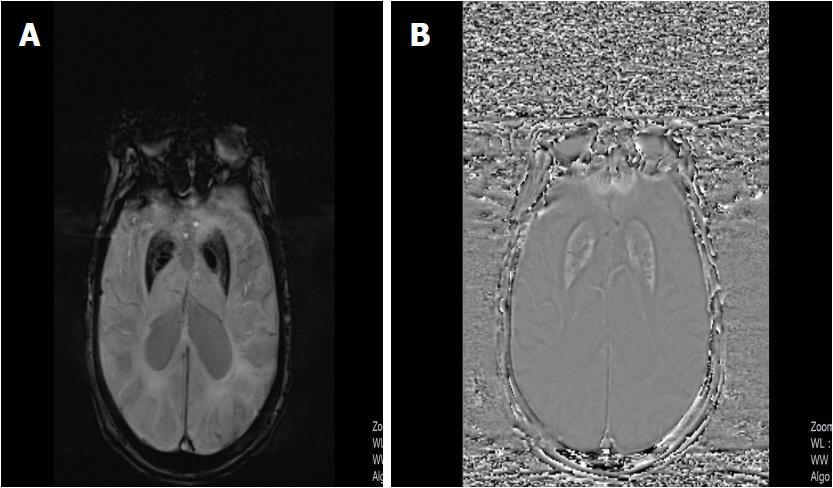
Figure 15 A 79-year-old woman with Alzhemier’s disease.
A: SWI minIP image shows hypointense signal intensity in the globus pallidus and putamen indicating increased iron deposition; B: SWI phase image reveals hyperintense signal in the basal ganglia due to the positive shift effect of paramagnetic iron. SWI: Susceptibility weighted imaging; minIP: Minimum intensity projection algorithm.
Figure 16 A 48-year-old man with a history of glioblastoma multiforme.
A: FSE T2W image, a heterogenous high signal intensity right frontal lobe mass and surrounding hyperintense infiltrative edema is seen. Tumor is compressing the right lateral ventricule and leading to right to left shift; B: Axial SE T1W contrast- enhanced image, tumor shows heterogenous contrast enhancement; C: SWI minIP image reveals microhemorrhages in the periphery of the tumor indicating a high grade neoplasm. SWI: Susceptibility weighted imaging; minIP: Minimum intensity projection algorithm; FSE: Fast spin echo.
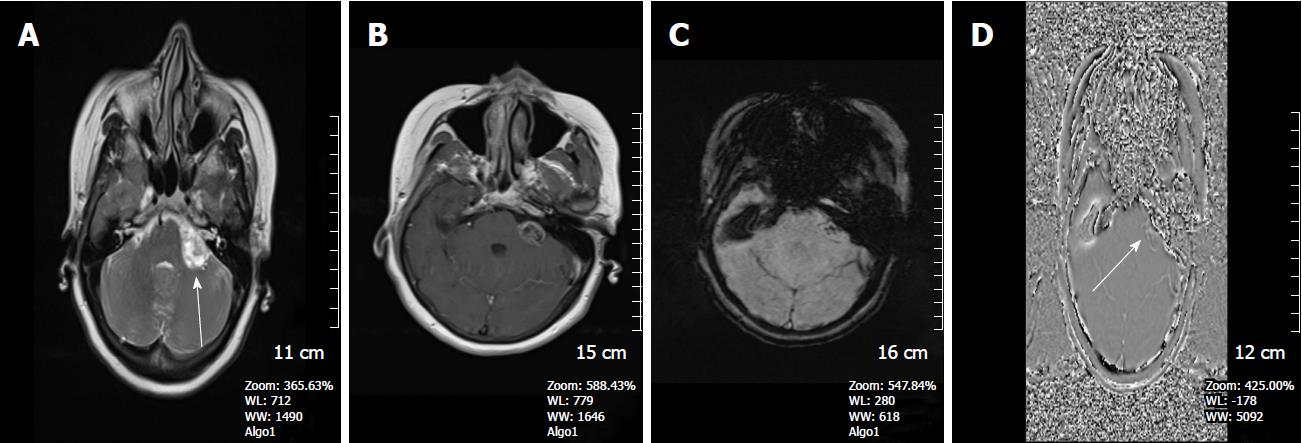
Figure 17 A 55-year-old woman complaining of left-sided tinnitus.
A: Axial FSE T2W image, a heterogenous high signal intensity mass in the left cerebellopontine angle cistern is present; B: On the axial SE T1W contrast- enhanced image, heterogenous contrast enhancement is seen; C: SWI magnitude image reveals punctate hypointense foci within the mass indicating a probable acoustic schwannoma; D: SWI phase image confirms bright microhemorrhages causing a paramagnetic effect. SWI: Susceptibility weighted imaging; FSE: Fast spin echo.
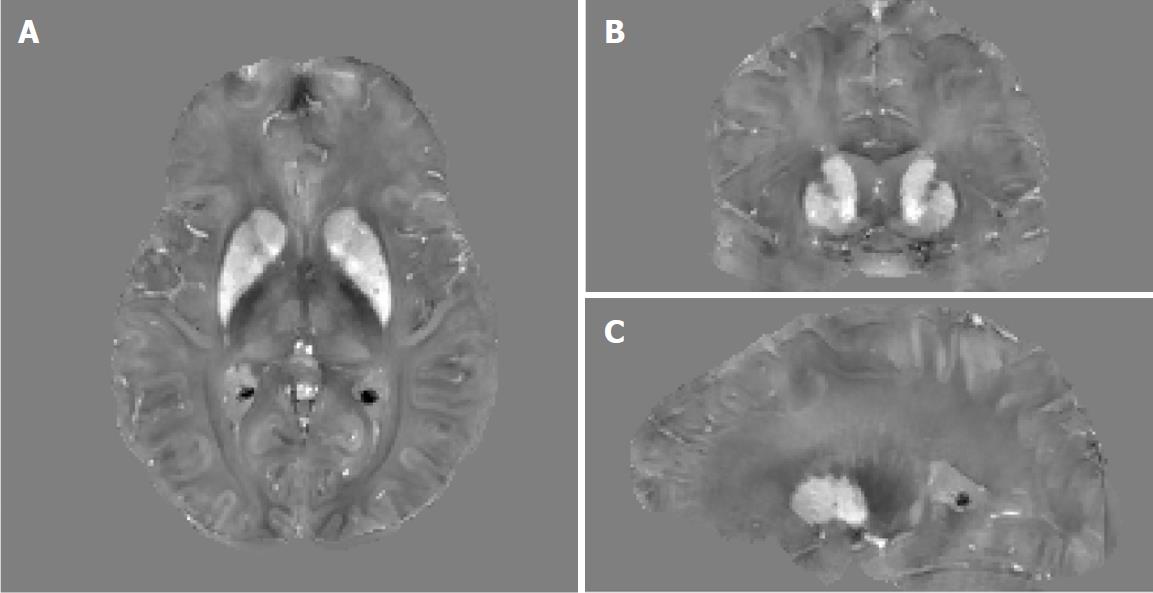
Figure 18 Example orthogonal views of quantitative susceptibility mapping images of a 41-year-old female premanifest HD patient showing the basal ganglia where increased tissue magnetic susceptibility can be observed in iron-rich gray matter structures such as the caudate nuclei and putamen.
Extra iron overload in the striatum in these patients as compared to age-matched controls is believed to be associated with HD pathophysiology. Gray scale is in [-0.2, 0.2] ppm.
Figure 19 Example quantitative susceptibility mapping image of a 55-year-old female relapsing-remitting MS patient, shows hyperintense susceptibility MS lesions, and the corresponding FLAIR, T1 and R2* images.
Multiple contrast analysis using R2* and QSM may be helpful identifying different pathological changes in MS lesions. Gray scale is [-0.12, 0.12] ppm in QSM image and [0, 80] Hz in R2* image. MS data was acquired using similar 7T protocol as the HD study. QSM: Quantitative susceptibility mapping.
Figure 20 Increased iron accumulation of caudate and putamen is noted in patients with Alzheimer’s disease and vascular dementia as compared with normal subjects.
- Citation: Halefoglu AM, Yousem DM. Susceptibility weighted imaging: Clinical applications and future directions. World J Radiol 2018; 10(4): 30-45
- URL: https://www.wjgnet.com/1949-8470/full/v10/i4/30.htm
- DOI: https://dx.doi.org/10.4329/wjr.v10.i4.30


