Copyright
©The Author(s) 2018.
World J Radiol. Mar 28, 2018; 10(3): 24-29
Published online Mar 28, 2018. doi: 10.4329/wjr.v10.i3.24
Published online Mar 28, 2018. doi: 10.4329/wjr.v10.i3.24
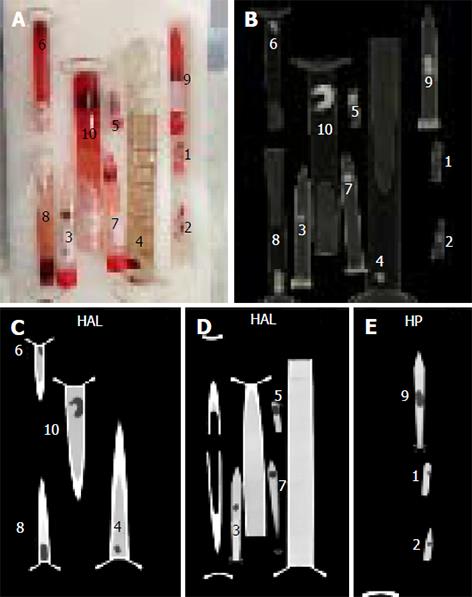
Figure 1 Photograph of 10 blood clot phantom (A); Volume rendered 3D reconstructed CT image of 10 blood clot phantom (B); Coronal CT images of ten blood clot phantom showing in (C) clots numbered 4, 6, 8 and 10, in (D) clots numbered 3, 5, and 7 and in (E) clots numbered 1, 2 and 9.
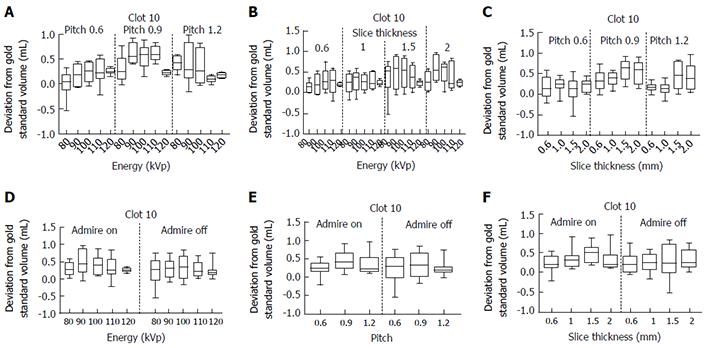
Figure 2 Box plots showing the difference between the segmented volume and the mean measured (gold standard) volume for Clot 10 as it relates to the following acquisition and reconstruction parameters.
A: Energy and pitch; B: Energy and slice thickness; C: Slice thickness and pitch; D: Energy and Siemens Advanced Modeled Iterative Reconstruction (ADMIRE); E: Pitch and ADMIRE; F: Slice thickness and ADMIRE.
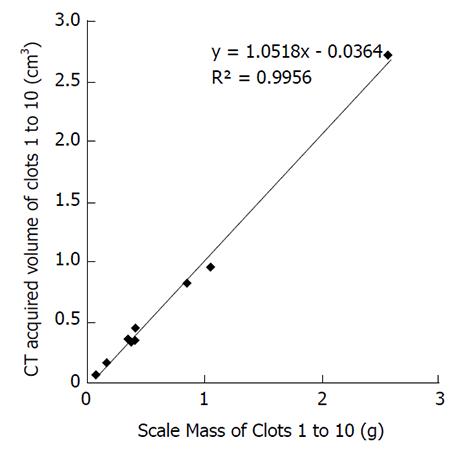
Figure 3 Correlation between scale measured mass vs computed tomography acquired volume of 10 clots with an excellent R2 correlation value of 0.
9956.
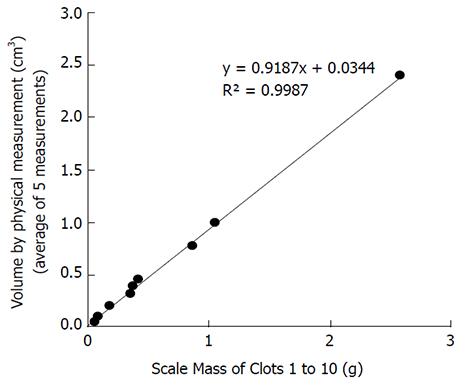
Figure 4 Correlation between scale measured mass vs volume by physical measurement (cm3) (average of 5 measurements) of 10 clots with an excellent R2 correlation value of 0.
9987.
- Citation: Kaufman AE, Pruzan AN, Hsu C, Ramachandran S, Jacobi A, Fayad ZA, Mani V. Effect of varying computed tomography acquisition and reconstruction parameters on semi-automated clot volume quantification. World J Radiol 2018; 10(3): 24-29
- URL: https://www.wjgnet.com/1949-8470/full/v10/i3/24.htm
- DOI: https://dx.doi.org/10.4329/wjr.v10.i3.24


