Published online Oct 26, 2016. doi: 10.4330/wjc.v8.i10.559
Peer-review started: February 22, 2016
First decision: March 25, 2016
Revised: May 25, 2016
Accepted: July 29, 2016
Article in press: August 1, 2016
Published online: October 26, 2016
Processing time: 250 Days and 12.6 Hours
The increase in health care costs is not sustainable and has heightened the need for innovative low cost effective strategies for delivering patient care. Remote monitoring holds great promise for preventing or shortening duration of hospitalization even while improving quality of care. We therefore conducted a proof of concept study to examine the quality of electrocardiograph (ECG) recordings obtained remotely and to test its potential utility in detecting harmful rhythms such as atrial fibrillation. We tested a novel adhesive strip ECG monitor and assessed the ECG quality in ambulatory individuals. 2630 ECG strips were analyzed and classified as: Sinus, atrial fibrillation (AF), indeterminate, or other. Four readers independently rated ECG quality: 0: Noise; 1: QRS complexes seen, but P-wave indeterminate; 2: QRS complexes seen, P-waves seen but poor quality; and 3: Clean QRS complexes and P-waves. The combined average rating was: Noise 12%; R-R, no P-wave 10%; R-R, no PR interval 18%; and R-R with PR interval 60% (if Sinus). If minimum diagnostic quality was a score of 1, 88% of strips were diagnostic. There was moderate to high agreement regarding quality (weighted Kappa statistic values; 0.58 to 0.76) and high level of agreement regarding ECG diagnosis (ICC = 0.93). A highly variable RR interval (HRV ≥ 7) predicted AF (AUC = 0.87). The monitor acquires and transmits diagnostic high quality ECG data and permits characterization of AF.
Core tip: The findings of this pilot study confirm that a remote monitoring system using a novel adhesive strip electrocardiograph (ECG) sensor can acquire and transmit diagnostic high quality ECG data over a period of 3 d when worn by elderly subjects leading active independent lives. Automated determination of heart rate variability permitted reliable characterization of ECG strips with atrial fibrillation. These data have implications for long term continuous monitoring for development of atrial fibrillation in independent elderly patients.
- Citation: Bruce CJ, Ladewig DJ, Somers VK, Bennet KE, Burrichter S, Scott CG, Olson LJ, Friedman PA. Remote electrocardiograph monitoring using a novel adhesive strip sensor: A pilot study. World J Cardiol 2016; 8(10): 559-565
- URL: https://www.wjgnet.com/1949-8462/full/v8/i10/559.htm
- DOI: https://dx.doi.org/10.4330/wjc.v8.i10.559
Due to increased longevity, people are facing an increasing prevalence of chronic disease that threatens their ability to live independently and has led to rapidly escalating healthcare costs. It is imperative that new, effective, economical and efficient methods to prevent and manage chronic disease are developed. Cardiovascular disease accounts for a significant burden of chronic illness, often manifesting as heart failure, and arrhythmias such as atrial fibrillation (AF) are commonly observed[1-4]. These arrhythmias may be difficult to detect, often initially presenting as decompensation of heart failure or stroke. Remote monitoring of physiologic measures such as the ECG and heart rate may provide an important option for early detection of cardiovascular compromise and arrhythmias[5]. Limitations of current monitoring systems include a large body burden and inconvenience in use, latency in transmission of physiologic information, enormous volumes of data for analysis consuming human resources, and significant false alarms generated by artifact, requiring human oversight[6-8].
We have developed a personal monitoring system capable of interfacing with additional low profile, unobtrusive, on-body and off-body sensors to provide real-time and cumulative data to a health care provider at any internet or cellular network enabled location. The system records ECG, respiration (via bio-impedance measurement), and physical activity using a 3-axis accelerometer. The system also has embedded algorithms that provide a self-diagnostic reliability index to qualify the value of the data, permitting reviewers to discard noisy signals, thus facilitating generation of alerts with greater specificity. In this pilot study, we sought to test the monitoring system in healthy volunteers residing in an independent living center, to determine whether the system satisfactorily acquires, stores, and displays ECG information of diagnostic quality in ambulatory, free-living individuals.
We prospectively enrolled 10 healthy volunteers from residents of the Mayo Clinic Charter House, an assisted living center near the Mayo Clinic Rochester downtown campus. To be eligible, participants had to live in apartments with appropriate cellular network coverage. Subjects with implanted cardiac defibrillators or pacemakers were excluded.
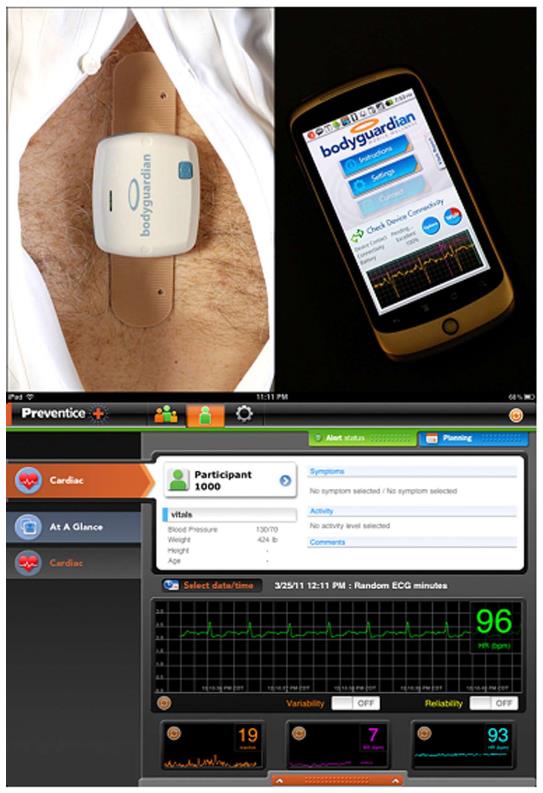
After enrollment, a study coordinator provided each participant with a data hub that consisted of a SmartPhone preloaded with custom monitoring software (Google Nexus, HTC Corporation, Taipei, Taiwan), a charger for the SmartPhone, as well as two fully charged monitoring units and adhesive snap strips (Figure 1, BodyGuardian, Preventice Inc., Minneapolis, MN, described further below). A study coordinator instructed the subject on applying the adhesive strip sensor to the chest, methods for ensuring good signal quality, and how to ask for assistance if required.
Each subject was asked to use the system for 3 consecutive days. Supervised maneuvers, such as lying supine, sitting, standing, and walking were performed once per day, each day for 3 d, at which time the various signals were recorded. At the end of each 24-h period, the Study Coordinator exchanged the unit for a newly charged unit.
The study was approved by the Institutional Review Board. Since the system was not FDA approved at the time of the study, no clinical decisions or management changes were made based on data obtained during the trial.
The remote health management system connects personal health sensors with secure mobile communication devices. The monitor front-end is composed of an electronic unit; an adhesive patch with attached electrodes and snaps for a rechargeable module. The rechargeable module measures 59 mm × 50 mm and houses the sensors, battery and wireless transmitter (Figure 2). It is detachable from the electrode snap strips to permit showering. The module is able to measure heart rate (HR), ECG, respiratory rate, and activity level. The ECG is recorded via the two inner electrodes (the distance between the inner electrodes is 70 mm and the distance between the outer electrodes is 104 mm). The electrode pads measure 10 mm diameter and have a signal sampling rate of 256 Hz with 12 bit resolution. Respirations are measured by injection of a low voltage charge from one pair of electrode contacts and measuring the change in voltage over a fixed distance on the other pair of electrode contacts (current amplitude: 100 μA, current frequency: 50 kHz, sampling frequency: 32 Hz). A three dimensional accelerometer acquires samples at 50 Hz and the signal is algorithmically processed to determine physical activity. Physiologic information is communicated to a remote server using a mobile phone as the communication hub. The mobile phone displays data acquisition, battery level and data transmission to the subject.
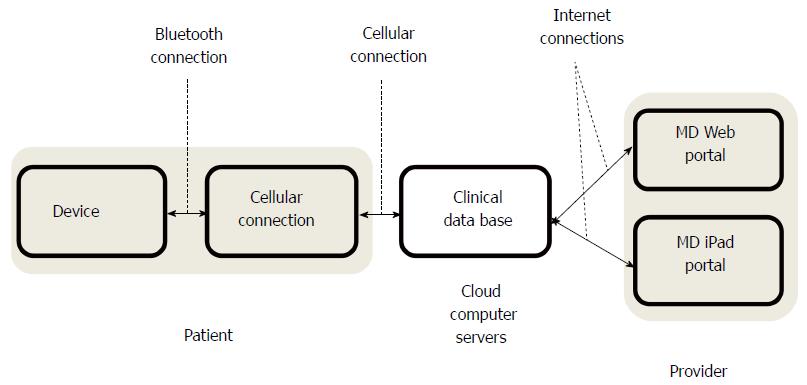
During normal operation, the system collects physiologic data and stores it in its on-board memory. The data are transmitted to the smart phone data hub at programmable intervals (nominally 60 min). In the absence of proximity to the data hub, data are stored on the rechargeable module attached to the adhesive strip until the next communication attempt. Data are automatically transmitted from the smart phone hub to a secure, HIPAA compliant server database.
Utilizing clinical algorithms, the system is capable of automated decision making based upon integration of data and can provide immediate feedback to the subject. The solution is a multi-tiered mobile health platform (Figure 3). The stored data are presented for review via a web-based interface, or using custom software on an iPad (Apple Computer, Cupertino, CA).
Each hour, a randomly selected two-minute ECG strip was automatically recorded and transmitted for the purposes of this study. Users could also manually activate a recording using the smart phone data hub interface.
Each of the ECG strips was read by 4 independent, experienced readers for ECG signal quality and rhythm interpretability. The readers were ECG technicians working in a 24-h continuous telemetry unit, and were blinded to clinical information and other readers’ interpretations. Each reader independently rated the ECG quality using an ordinal scoring system: 0 Noise, cannot reliably determine QRS complexes 1 QRS complexes reliably seen and R-R intervals determined, but atrial activity indeterminate due to baseline noise 2, QRS intervals reliably recorded, and atrial activity seen but of poor quality, and PR interval not reliably seen 3, clean signal, with reliable assessment of QRS intervals, and PR intervals (when present). Quality scores were compared between each pair of readers and a weighted Kappa statistic was calculated assuming an ordinal outcome. In addition, in order to compare quality scores from all 4 readers, an intra-class correlation coefficient was calculated as a measure of agreement across all 4 raters.
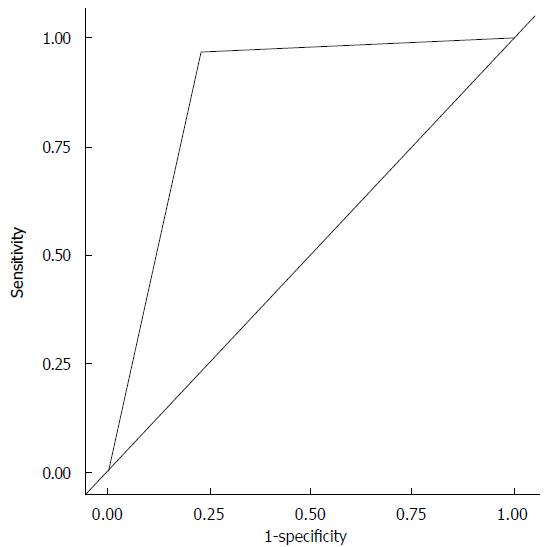
The system reports an average HR. The HR is derived by detecting the R wave component of the QRS complex for both normal and premature ventricular complexes (PVCs). The system calculates the interval between R waves (R-R interval) and processes this information to derive an average HR value every 10 s. The system also calculates heart rate variability (HRV). HRV is a value derived from the variance of the ECG R-to-R intervals based on a 10-s time interval. It is sensitive to both normal beats and PVCs. An event is triggered when the number of heart beats per minute varies by more than the HRV threshold. For example, if the threshold is set to 30-bpm, a HR that varies from the average by more than 5 beats in a 10 s interval triggers an HRV event. Use of the HRV threshold to trigger an event helps to identify ECG tracings that may require physician review as they are more likely to indicate arrhythmia, based on dropped beats or irregular rhythm or increased heart rate. Logistic regression analysis was used to examine the association of HRV with the outcome of AF. A Receiver Operator Characteristic curve and concordance statistic (AUC) was used to illustrate the sensitivity and specificity of HRV.
Ten healthy volunteers were recruited to the study (4 men, average age 79.5 years (range 74 to 92 years). All 10 subjects wore the device for 72 h. Data from all 10 subjects were stored and were available for analysis for the 72-h duration the device was used.
Data for 2630 ECG 2-min strips were available for analysis. Rhythm was classified by each of the 4 readers as sinus, AF, indeterminate or other (Table 1). There was moderate agreement in rhythm classification between pairs of readers (median Kappa = 0.65). In particular, variability was noted in the percentages of strips rated by each reader as sinus (48%-70%) while the percentages of those rated as AF was comparable across readers (11%-15%). Quality scores were compared between each pair of readers. There was a moderate to high level of concordance between readers (weighted Kappa statistic values ranged from 0.58 to 0.76). There was also a very high level of agreement across the 4 readers (ICC = 0.93).
| Rhythm | Reader 1 n (%) | Reader 2 n (%) | Reader 3 n (%) | Reader 4 n (%) |
| Sinus | 1790 (68%) | 1247 (48%) | 1833 (70%) | 1366 (52%) |
| AF | 292 (11%) | 384 (15%) | 294 (11%) | 334 (13%) |
| Indeterminate | 457 (17%) | 974 (37%) | 497 (19%) | 773 (29%) |
| Other | 88 (3%) | 4 (0.1%) | 3 (0.1%) | 154 (6%) |
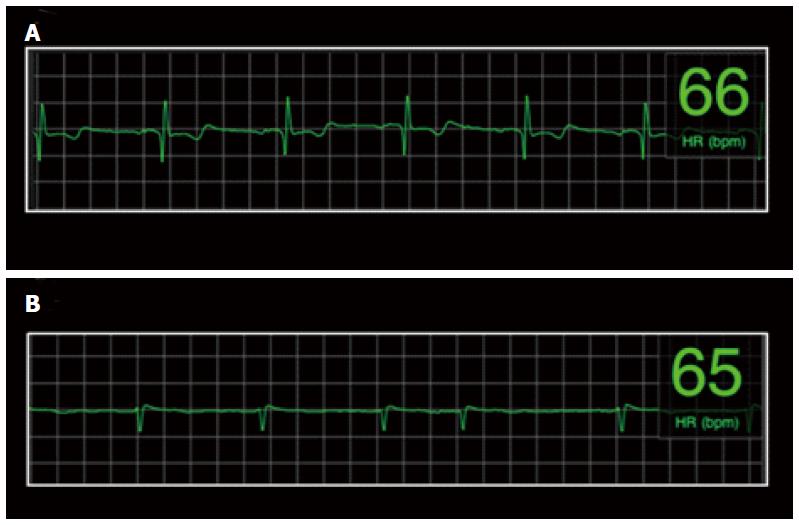
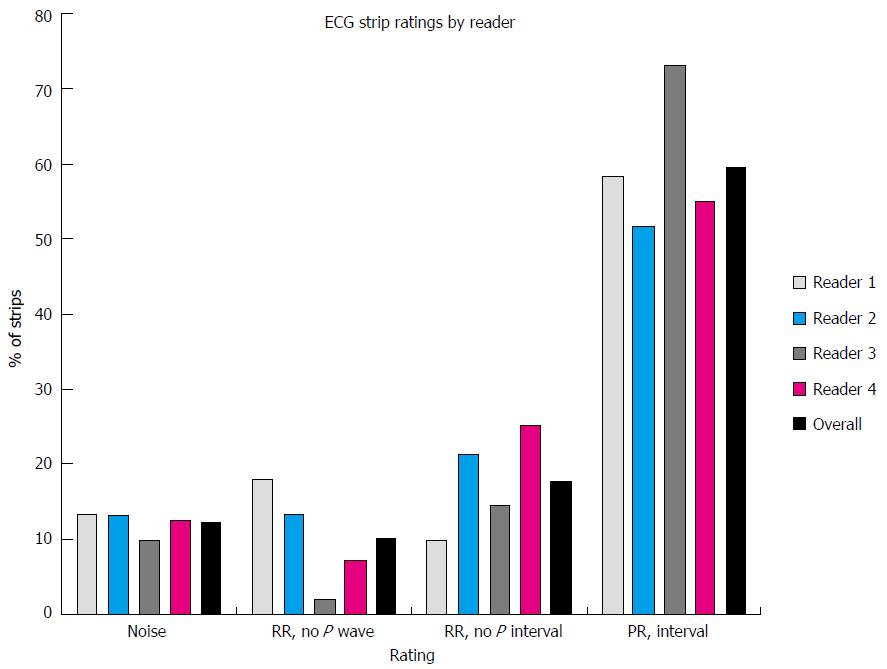
The combined average rating of ECG quality based on the 4 independent raters was: No RR-noise 12%, RR-no P-wave 10%, RR-no PR interval 18%, PR interval 60% (if in sinus rhythm). Thus, if a minimum diagnostic quality was determination of an RR interval, 88% of strips were sufficiently diagnostic to provide a determination of HR, and a minority of strips was considered noise related to artifact (12%). Examples of ECG strips and the combined and individual assessments of ECG quality are presented in Figures 3 and 4.
One of the 10 subjects had persistent AF. In order to preliminarily assess the utility of HRV for identifying AF, and because of the variability in ECG classification variability, analysis was performed on those strips that were found to be in agreement across all 4 readers as either sinus rhythm (n = 889) or AF (n = 252). HRV scores were found to be significantly different between those classified as Sinus Rhythm (mean = 10.0, SD = 2.4) and those classified as AF (mean = 4.7, SD = 5.9), P < 0.001. Based on this finding, we defined images with a variability score of 7 or greater as highly variable. Ninety-seven percent of the strips with HRV ≥ 7 were classified as AF. This variable was also entered into a logistic regression model for predicting AF. The univariate area under the curve (AUC) for a highly variable RR interval (HRV ≥ 7) in predicting AF was 0.87 (Figure 5). Using HRV ≥ 7, sensitivity was calculated to be 97% (95%CI: 94-99) while specificity was 77% (74-80), positive predictive value was 54% (49-59) and negative predictive value was 99% (98-99).
The findings of this pilot study demonstrate for the first time the ability of this low body burden, unobtrusive, wireless remote monitoring system to acquire and transmit high diagnostic quality ECG data when worn by elderly subjects leading active independent lives, outside of a hospital environment. Artifact in ambulatory 24/7 ECG recordings results in erroneous arrhythmia classification that may significantly and adversely affect diagnostic accuracy and hence quality of care. These artifacts result from myopotentials (most commonly from the pectoralis muscles), galvanic skin currents, and less commonly electromagnetic interference. These issues are particularly prevalent in ambulatory settings and Band-Aid style sensors with only two electrodes are particularly at risk. Thus, it is reassuring that most of the ECG recordings using this system provided clinically diagnostic information, free from artifact. Furthermore, although the study was not designed to assess arrhythmia detection, serendipitously, one subject had persistent atrial fibrillation. Analysis of segments using the HRV algorithm permitted differentiation of ECG strips with AF from SR.
Determining reliable high quality ECG recordings is important in ambulatory monitoring systems to ensure appropriate diagnosis. It is also important to be able to characterize poor quality ECG data or noise (artifact) so that these data can be ignored. This is particularly important when large amounts of data are being recorded over prolonged periods, when frequent false alarms generate both user and healthcare provider “alarm” fatigue rendering the system cumbersome, and consequently adversely affecting effectiveness, adherence and prescription. The monitor system is capable of acquiring high quality ECG recordings using an unobtrusive adhesive electrode sensor in an ambulatory setting.
HRV as defined by this system may be useful for detection of arrhythmias such as atrial fibrillation. Indeed, in this study, one subject had AF. When excessive HRV was noted, ECG data strips from the patient could be reliably determined. This observation could be potentially useful in detecting AF, particularly if new AF develops in an individual who was previously in sinus rhythm (when HRV would be low). High HRV may be seen with arrhythmias other than AF, such as frequent PVC’s.
This study has limitations that may constrain broad generalization of our findings. The subjects enrolled in this study were elderly residents of an assisted living facility ranging in age from 72 years to 92 years. They are thus not representative of other population groups who may be younger, more active or less healthy. Furthermore, although there were large amounts of data for analysis, the subject sample size was small. The study design requirement for visual confirmation of rhythm and ECG quality rather than relying on automated algorithms made it necessary to limit the number of subjects studied. In mitigation, more than 2600 rhythm strips from the 10 subjects were visually inspected by study investigators to ascertain cardiac rhythm, which was labor and time-intensive. To prove the clinical utility of this approach in the future will require studies with larger numbers of subjects, which will only be practical with systems capable of automated rhythm identification in order to enable scalability. Additionally, very few patients experienced an arrhythmia (atrial fibrillation), and patients with other arrhythmias were not included. However, this was a pilot study directed toward evaluating the ergonomics, tolerability, and effectiveness of continuous EKG monitoring, and to determine whether the quality of the EKG recording could be preserved over extended periods.
The findings of this pilot study confirm that a remote monitoring system using a novel adhesive strip ECG sensor can acquire and transmit diagnostic high quality ECG data over a period of 3 d when worn by elderly subjects leading active independent lives. Automated determination of heart rate variability permitted reliable characterization of ECG strips with AF.
We would like to thank Bridgette A. Wagner and DeJae Ladewig for assistance in preparing the manuscript.
Manuscript source: Invited manuscript
Specialty type: Cardiac and cardiovascular systems
Country of origin: United States
Peer-review report classification
Grade A (Excellent): A
Grade B (Very good): B
Grade C (Good): C, C
Grade D (Fair): D
Grade E (Poor): 0
P- Reviewer: Ho KM, Kettering K, Letsas K, Nam GB, Sakabe K S- Editor: Qiu S L- Editor: A E- Editor: Wu HL
| 1. | Benjamin EJ, Wolf PA, D’Agostino RB, Silbershatz H, Kannel WB, Levy D. Impact of atrial fibrillation on the risk of death: the Framingham Heart Study. Circulation. 1998;98:946-952. [RCA] [PubMed] [DOI] [Full Text] [Cited by in Crossref: 3186] [Cited by in RCA: 3323] [Article Influence: 123.1] [Reference Citation Analysis (0)] |
| 2. | Cleland JG, Swedberg K, Follath F, Komajda M, Cohen-Solal A, Aguilar JC, Dietz R, Gavazzi A, Hobbs R, Korewicki J. The EuroHeart Failure survey programme-- a survey on the quality of care among patients with heart failure in Europe. Part 1: patient characteristics and diagnosis. Eur Heart J. 2003;24:442-463. [PubMed] |
| 3. | Lloyd-Jones D, Adams R, Carnethon M, De Simone G, Ferguson TB, Flegal K, Ford E, Furie K, Go A, Greenlund K. Heart disease and stroke statistics--2009 update: a report from the American Heart Association Statistics Committee and Stroke Statistics Subcommittee. Circulation. 2009;119:480-486. [RCA] [PubMed] [DOI] [Full Text] [Cited by in Crossref: 1440] [Cited by in RCA: 1440] [Article Influence: 90.0] [Reference Citation Analysis (0)] |
| 4. | McManus DD, Saczynski JS, Lessard D, Kinno M, Pidikiti R, Esa N, Harrington J, Goldberg RJ. Recent trends in the incidence, treatment, and prognosis of patients with heart failure and atrial fibrillation (the Worcester Heart Failure Study). Am J Cardiol. 2013;111:1460-1465. [RCA] [PubMed] [DOI] [Full Text] [Cited by in Crossref: 27] [Cited by in RCA: 30] [Article Influence: 2.5] [Reference Citation Analysis (0)] |
| 5. | Dendale P, De Keulenaer G, Troisfontaines P, Weytjens C, Mullens W, Elegeert I, Ector B, Houbrechts M, Willekens K, Hansen D. Effect of a telemonitoring-facilitated collaboration between general practitioner and heart failure clinic on mortality and rehospitalization rates in severe heart failure: the TEMA-HF 1 (TElemonitoring in the MAnagement of Heart Failure) study. Eur J Heart Fail. 2012;14:333-340. [RCA] [PubMed] [DOI] [Full Text] [Cited by in Crossref: 143] [Cited by in RCA: 161] [Article Influence: 11.5] [Reference Citation Analysis (0)] |
| 6. | Desai AS, Stevenson LW. Connecting the circle from home to heart-failure disease management. N Engl J Med. 2010;363:2364-2367. [RCA] [PubMed] [DOI] [Full Text] [Cited by in Crossref: 81] [Cited by in RCA: 75] [Article Influence: 5.0] [Reference Citation Analysis (0)] |
| 7. | Lawless ST. Crying wolf: false alarms in a pediatric intensive care unit. Crit Care Med. 1994;22:981-985. [RCA] [PubMed] [DOI] [Full Text] [Cited by in Crossref: 284] [Cited by in RCA: 224] [Article Influence: 7.2] [Reference Citation Analysis (0)] |
| 8. | Muhlsteff J, Such O, Schmidt R, Perkuhn M, Reiter H, Lauter J, Thijs J, Musch G, Harris M. Wearable approach for continuous ECG--and activity patient-monitoring. Conf Proc IEEE Eng Med Biol Soc. 2004;3:2184-2187. [RCA] [PubMed] [DOI] [Full Text] [Cited by in Crossref: 36] [Cited by in RCA: 38] [Article Influence: 2.1] [Reference Citation Analysis (0)] |


