Published online Jun 26, 2015. doi: 10.4330/wjc.v7.i6.315
Peer-review started: August 27, 2014
First decision: October 14, 2014
Revised: February 4, 2015
Accepted: April 1, 2015
Article in press: April 7, 2015
Published online: June 26, 2015
Processing time: 303 Days and 9.5 Hours
Assessment of the QT interval on a standard 12 lead electrocardiogram is of value in the recognition of a number of conditions. A critical part of its use is the adjustment for the effect of heart rate on QT interval. A systematic search was conducted to identify studies that proposed formulae to standardize the QT interval by heart rate. A nomenclature was developed for current and subsequent equations based on whether they are corrective (QTc) or predictive (QTp). QTc formulae attempt to separate the dependence of the length of the QT interval from the length of the RR interval. QTp formulae utilize heart rate and the output QTp is compared to the uncorrected QT interval. The nomenclature consists of the first letter of the first author’s name followed by the next two consonance (whenever possible) in capital letters; with subscripts in lower case alphabetical letter if the first author develops more than one equation. The single exception was the Framingham equation, because this cohort has developed its own “name” amongst cardiovascular studies. Equations were further categorized according to whether they were linear, rational, exponential, logarithmic, or power based. Data show that a person’s QT interval adjusted for heart rate can vary dramatically with the different QTc and QTp formulae depending on the person’s heart rate and QT interval. The differences in the QT interval adjustment equations encompasses values that are considered normal or significant prolonged. To further compare the equations, we considered that the slope of QTc versus heart rate should be zero if there was no correlation between QT and heart rate. Reviewing a sample of 107 patient ECGs from a hospital setting, the rank order of the slope - from best (closest to zero) to worst was QTcDMT, QTcRTHa, QTcHDG, QTcGOT, QTcFRM, QTcFRD, QTcBZT and QTcMYD. For two recent formulae based on large data sets specifically QTcDMT and QTcRTHa, there was no significant deviation of the slope from zero. In summary a nomenclature permits easy reference to QT formulae that adjust for heart rate. Twenty different formulae can produce discordant calculations of an adjusted QT interval. While the formulae developed by Bazett and Fridericia (QTcBZT and QTcFRD respectively) may continue to be used clinically, recent formulae from large population studies specifically QTcDMT and QTcRTHa appear to be better to adjust QT for heart rate in clinical practice.
Core tip: We propose a nomenclature for QT-heart rate adjustment formulae consisting of the first letter of the first author’s name followed by the next two consonance with subscripts if the author develops more than one equation. Twenty different QT-heart rate formulae produced discordant calculations of adjusted QT interval. Formulae were categorization into predictive or corrective (QTc) and into linear, rational, exponential, logarithmic, or power based. QTc equations are the most suitable for clinical application. Based on the ability to minimize the slope of a best fit linear relationship between QTc and heart rate, the new formulae QTcDMT and QTcRTHa warrant introduction into clinical practice.
- Citation: Rabkin SW, Cheng XB. Nomenclature, categorization and usage of formulae to adjust QT interval for heart rate. World J Cardiol 2015; 7(6): 315-325
- URL: https://www.wjgnet.com/1949-8462/full/v7/i6/315.htm
- DOI: https://dx.doi.org/10.4330/wjc.v7.i6.315
Assessment of the QT interval on a standard 12 lead electrocardiogram is of value in the recognition of conditions such as electrolyte disturbances, drug-induced cardiac toxicity, genetic abnormalities of cardiac channels (channelopathies) and autonomic nervous system dysregulation[1-6]. Prolonged QT interval has been considered a useful biomarker for electrolyte abnormalities such as hypokalemia or hypomagnesemia[2]. In addition, the duration of the QT interval has been found in epidemiologic studies to identify individuals at high risk of subsequent sudden death[7].
QT interval is highly dependent on heart rate, so that utilization of the QT interval, requires adjustment for the impact of heart rate on the QT interval. Formulae for the adjustment of the QT interval, for heart rate, have been used clinically for almost one hundred years[8,9]. While the original proposals of Bazett[8] and Fridericia[9] remain the most popular methods, there were many other possible choices for heart rate correction proposed in the early years of electrocardiography, as reviewed by Simonson et al[10]. There have been considerable concerns about the precision and the validity of the standard QT interval- heart rate adjustments approaches[11-15] that have led to the recent development of QT adjustment formulae from larger numbers of persons[16,17]. Pharmacovigilance data that identified the association of drug-induced sudden cardiac death with prolonged QT interval, generated recommendations by drug approval and monitoring agencies and has led to recommendations to evaluate the effect of drugs on the QT interval - the “Thorough QT Study” (TQT)[18]. Such studies require the careful assessment of the QT interval. The need for evaluation of the QT interval has generated research into how best to isolate the effect of a drug on the QT interval and minimize other factors such as heart rate which changes over time and might influence the QT interval. That research categorized QT-heart rate correction equations and expanded the development of more rate correction approaches that were based on large population studies[16,17,19-21]. This literature has often not been translated to the clinic. The objective of this study is several fold. The first objective was to assemble and review the different QT-heart rate adjustment formulae so as to construct a reference nomenclature which reflects their nature and aids future discussion. The next objective was to compare the QT-heart rate adjustment formulae. The third objective was to assess how well the clinical impact of current widely used methods, which were based on small samples of apparently healthy individuals, compare with the recently proposed formulae that have been based on large sample sizes, often population based.
Our review began with a specific and comprehensive literature search so that all relevant QT interval formulae would be included for our analysis. Second, we applied eligibility criteria to all formulae to limit formulae to those with broad clinical application. Third, we obtained ECGs from a hospital setting to apply the selected formulae to QT and heart rate values. Finally, we compared the most preferred formulae.
A systematic search was conducted to identify studies that proposed equations to standardize the QT interval by heart rate. We searched the Medline and EMbase databases using the PubMed and OvidSP platforms. The full electronic search strategy used was “QT interva” and “heart rate” and reference value. The reference list of publications was searched for other publications so that additional papers from these reference lists were also used for our review.
Studies that met the following criteria were included: (1) an original study (2) development of the equation in an apparently normal population (3) an adult population (4) clear presentation of the equation, its parameters and conditions (5) equations should be based on ECG measured QT interval. Papers that dealt with cardiac systole rather than QT interval measurements were excluded except for the early clinical papers. Papers were also excluded if the QT interval was measured mainly in cases with electrolyte abnormalities, only children or in persons with electronic pacemakers.
Resting ECGs from a hospital ECG service were evaluated. Only ECGs with sinus rhythm and without bundle branch block, ST elevation myocardial infarction or significant ST-T wave changes were considered. There were 107 ECGs that were anonymously obtained from an acute care hospital. No clinical information is available similar to the usual clinical ECG interpretation setting. ECGs were acquired and digitally analyzed. ECG waveform were sampled at least at 500 samples per second using the Marquette 12SL analysis program (GE Healthcare, Milwaukee, WI, United States). The QT interval is measured “from the earliest detection of depolarization in any lead (QRS onset) to the latest detection of repolarization in any lead (T offset) (The Marquette 12SL analysis program was Marquette™ 12SL™ ECG Analysis Program, GE Healthcare Milwaukee, WI, United States). The QT interval and heart rate measured by the analysis program was used in the heart rate adjustment formulae.
Recognizing that the goal of the of each formula is to produce QTc values that do not correlated with heart rate or RR interval so that the slope of QTc/RR regression should zero, we calculated the linear slope of eight corrective formulae for the 107 persons with various heart rates. The eight corrective formulae were selected based on clinical usage and relevance.
A linear regression model was used to calculate the slope of QTc vs heart rate relationship. The goodness of fit of the data to the linear regression (line) is indicated by the standard deviation of residuals.
Over 25 different equations were identified. After examination of the formulae, a nomenclature was developed. Formulae were categorized into QT correction or prediction formulae. A correction formula is defined as a formula which attempts to separate the dependence of the length of the QT interval from the length of the RR interval (Table 1). The correction formulae are identified by the subscript with a lower case c. The other category includes predictive formulae, which are defined as formulae that predict an “optimal” QT interval length given the heart rate. The prediction equations are identified by the subscript with a lower case p or QTp (Table 2). Our rationale for this division is based on how each type of formulae is used. For a QTc equation, the patient’s heart rate and QT interval are used to calculate a QTc value, which is compared to a standard value. For a QTp equation only the person’s heart rate is required, then, the output QTp will be compared to the patient’s uncorrected QT interval. QTc limits would be anticipated to be different for each equation, and the same applies to the difference between uncorrected QT and QTp.
| Ref. | Sample size | Population characteristics | Nomenclature |
| Linear function | |||
| Sagie et al (1992) (Framingham)[26] | 5018 | Men (2239) and women (2779), aged 28 to 62 yr | QTcFRM |
| Rational functions | |||
| Hodges et al (1983)[31] | 607 | Men (303) and women (304), aged 20 to 89 yr | QTcHDG |
| Rautaharju et al (2014)[17] | 57595 | Men and women, aged 5 to 90 yr | QTcRTHa |
| Power functions | |||
| Bazett (1920)[8] | 39 | Men (20) and women (19), aged 14 to 53 yr | QTcBTZ |
| Fridericia (1920)[9] | 50 | Men and women, aged 30 to 81 yr | QTcFRD |
| Mayeda (1934)[24] | 200 | Men (135) and women (65), aged 18 to 64 yr | QTcMYD |
| Kawataki et al (1984)[32] | 9 | 9 male subjects aged 18 to 71 yr, taken at rest, during exercise, and after drug administration | QTcKWT |
| Dmitrienko et al (2005)[16] | 13039 | Men (6351) and women (6688), aged 4 to 99 yr | QTcDMT |
| Goto et al (2008)[25] | 1276 | Men aged 20 to 35 yr | QTcGOT |
| Rautaharju et al (2014)[17] | 57595 | Men and women, aged 5 to 90 yr | QTcRTHb |
| Ref. | Sample size | Population characteristics | Equation |
| Linear functions | |||
| Adams (1936)[33] | 104 | Men (50) and women (54), mean age 28 yr | QTpADM |
| Schlamowitz (1946)[34] | 650 | Men (650) aged 18 to 44 yr | QTpSCH |
| Karjalainen et al (1981)[27] | 324 ECGs | Men (military personnel) aged 18 to 28 yr | QTpKRJ |
| Simonson et al (1962)[10] | 960 | Men (649) and women (311), aged 20 to 59 yr | QTpSMN |
| Rational functions | |||
| Boudoulas et al (1981)[35] | 200 | Men (100) and women (100), aged 18 to 79 yr | QTpBRL |
| Hodges et al (1983)[31] | 607 | Men (303) and women (304), aged 20 to 89 yr | QTpHDG |
| Wohlfart and Pahlm (1994)[36] | 37 | Men (16) and women (21), aged 38 to 68 yr, taken at rest and during exercise | QTpWHL |
| Klingfield et al (1995)[37] | 94 | Men, mean age 48 yr, taken at rest and during exercise | QTpKLN |
| Power functions | |||
| Bazett (1920)[8] | 39 | Men (20) and women (19), aged 14 to 53 yr | QTpBZT |
| Fridericia (1920)[9] | 50 | Men and women, aged 30 to 81 yr | QTpFRD |
| Mayeda (1934)[24] | 200 | Men (135) and women (65), aged 18 to 64 yrs | QTpMYD |
| Schlomka and Raab (1936)[30] | 336 | Men and women | QTpSCH |
| Shipley and Hallaran (1936)[23] | 200 | Men and women, aged 22 to 35 yr | QTpSHP |
| Hegglin and Holzmann (1937)[38] | 700 | Men and women | QTpHGG |
| Kawataki et al (1984)[32] | 9 | Men aged 18 to 71 yr | QTpKWT |
| Goto et al (2008)[25] | 1276 | Men aged 20 to 35 yr | QTpGOT |
| Logarithmic functions | |||
| Ashman (1942)[39] | 1083 | Men (432), women (425), and children (226) | QTpASH |
| Merri et al (1989)[40] | 364 | Men (191) and women (173) aged 10 to 81 yr | QTpMRR |
| Exponential functions | |||
| Sarma et al (1984)[28] | 16 | Men (10) aged 18 to 30 yr, taken at rest and during exercise | QTpSRM |
| Lecocq et al (1989)[41] | 11 | Men (5) and women (6), aged 22 to 26 yr, taken at rest, during exercise, and after drug administration | QTpLCC |
| Arrowood et al (1993)[42] | 16 | 16 subjects, aged 21 to 62 yr | QTpARR |
Formulae were then divided according to the nature of correction - classified as linear, rational, power, logarithmic, or exponential[20,22] (Table 1). For our naming convention, we identify formulae by the first letter of the first author’s name followed by the next two consonants (whenever possible) in capital letters. If the first author develops more than one equation, the equations are labelled by the lower case alphabetical letter as subscript. The only exception to this rule was the Framingham study which has had many authors over the years and is a population based study that has developed its own name and reputation amongst cardiovascular studies.
The majority of corrective formulae utilize a power function to adjust the heart rate (Table 1). The first and still widely used correction equations were: Bazett’s proposal, based on a very small sample of normal subjects, that the QT interval varied according to the square root of the heart rate or cycle length (RR interval)[8] and Fridericia’s proposal[9] that the cube root of the RR interval was the best adjustment formula. The original Bazett formula which included constants was examined and had the constants eliminated producing the widely used Bazett formula[23]. Dmitrienko et al[16] reported on the ECGs from 13039 individuals (men and women) who had ECGs as part of their baseline assessment in clinical drug trials, conducted in 2000 and 2001, sponsored by Eli Lilly and Company. This correction formula was obtained by fitting a linear model to log-transformed QT and RR data. Mayeda[24] examined the ECGs of 200 apparently healthy Japanese individuals. Goto et al[25] studied the relationship between RR and QT, using the bootstrap method, in resting ECGs of 1276 healthy young Japanese men. The major linear equation was developed by Sagie et al[26] from the Framingham population in the United States. The sample size used to develop or test the equations varied dramatically between studies. The most recent equation, developed by Rautaharju et al[17], was based on pooled data from three different sources-two population studies and one large study of baseline ECGs prior to drug testing for a potential effect on QT, and consisted of 57595 individuals. These authors suggested two equations a rational and a power function formula.
The largest number of predictive equations also utilizes a power function to adjust for heart rate. The next most frequent adjustment formulae are linear or rational equations (Table 2). Some of the authors have both corrective and predictive equations which differ by the presence of relevant constants in the predictive equation. Simonson et al[10] proposed a logarithmic and a linear equation to predict QT interval based on the RR interval. They concluded that “because the logarithmic …and linear ….regression equations gave identical results within the error of measurement, the simpler linear equation … was used for further analysis.”[10]. Some of the predictive equations tried to adjust for the nonlinearity of the QT-RR interval relationship by considering different heart rate ranges. Karjalainen et al[27] measured the QT intervals in 324 electrocardiograms of healthy young men and weighted the sample for low and high heart rates equally. They concluded that the QT-RR relation does not permit the use of one simple adjustment equation and proposed formulae that provided different parameters according to the heart rate[27]. Some predictive equations attempted to evaluate the QT-RR interval relationship using interventions to vary heart rate. Sarma et al[28] studied 10 healthy, normal men who exercised on a stationary bicycle, and 6 patients with rate-programmable VVI pacemakers whose rates were changed by an external programme, and developed an equation with an exponential function.
The sample size used to develop QTp equations varied between studies but overall the sample sizes were smaller than those used to develop the QTc equations. A number of equations were derived as QTp equations and were subsequently modified to QTc equations with Bazett and Fridericia being the most well-known[8,9].
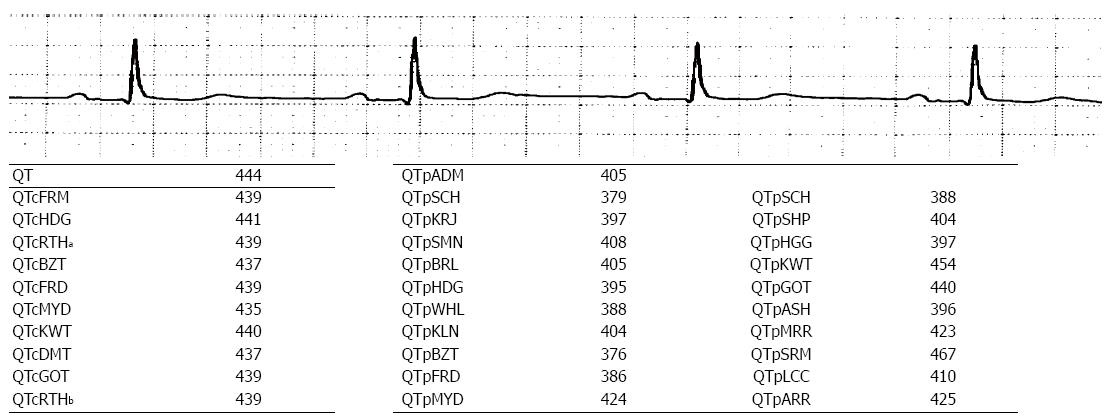
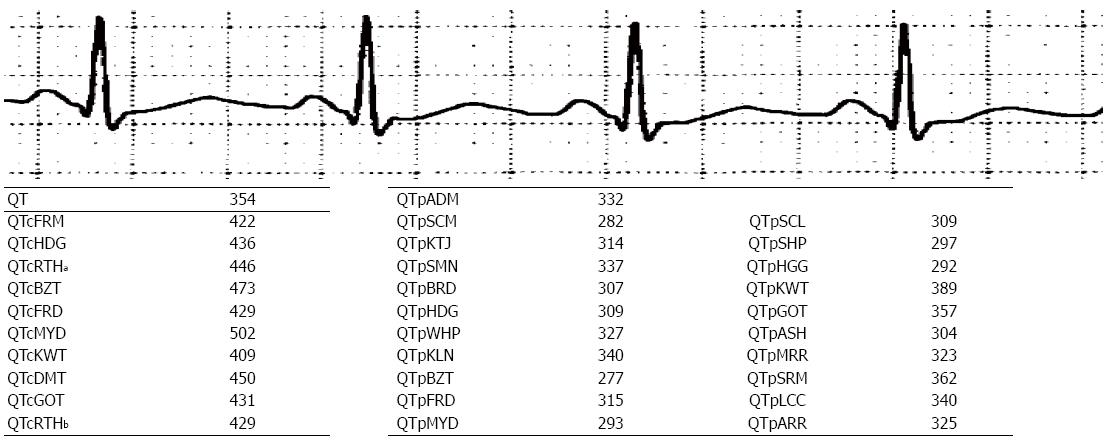
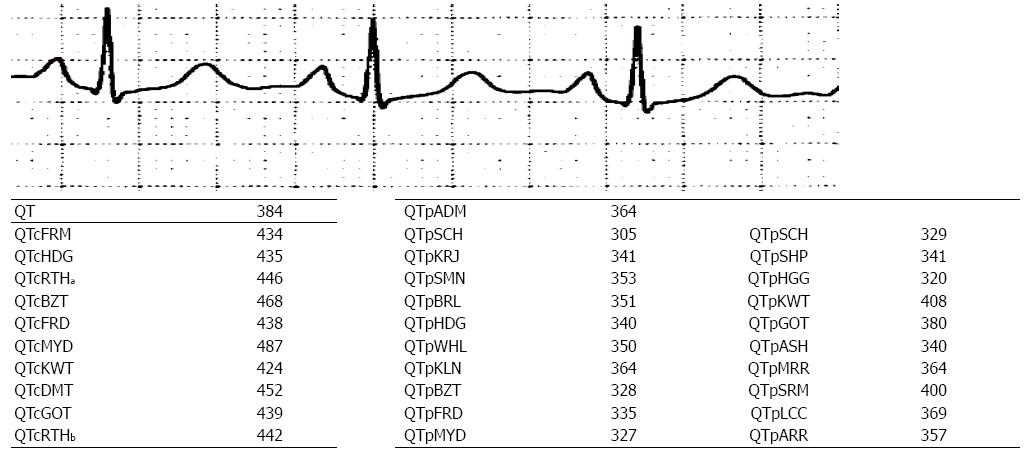
To illustrate the application of the various QT adjustment approaches, each of them was applied to three different ECGs (Figures 1-3). The closest correlation between the equations occurred, as expected, in a 71 years old man with a heart rate of 58 bpm where the difference in QTc was 6 milliseconds (ms) (435 to 441 ms) and for QTp the difference was 91 ms with a range from 376 to 467 ms (Figure 1). This is because QTc formulae are largely based on the assumption that the QT interval is accurate at the heart rate of 60 bpm. However, not all QTp equations are based on “normal heart rate” being at 60 bpm. In contrast, a man aged 53 years with a heart rate of 107 bpm, had a QTc ranging from 409 to 502 ms and QTp from 277 to 389 ms (Figure 2). The discrepancy between QTcBZT and QTcFRD was 44 ms. A 53 years old woman had QTc ranging from 424 to 487 ms and QTp from 305 to 408 ms (Figure 3). The discrepancy between QTcBZT and QTcFRD was 30 ms. The differences in the QT interval adjustment between formulae is readily apparent. Importantly the range encompasses values that are considered significant QT prolongation which raise the possibility of the presence of one of the causes for prolonged QT using one equation but a normal QT when considering another equation. The difference between QTcBZT and QTcFRD is apparent yet the value used to diagnose prolonged QT syndrome maybe considered to be the same by some clinicians.
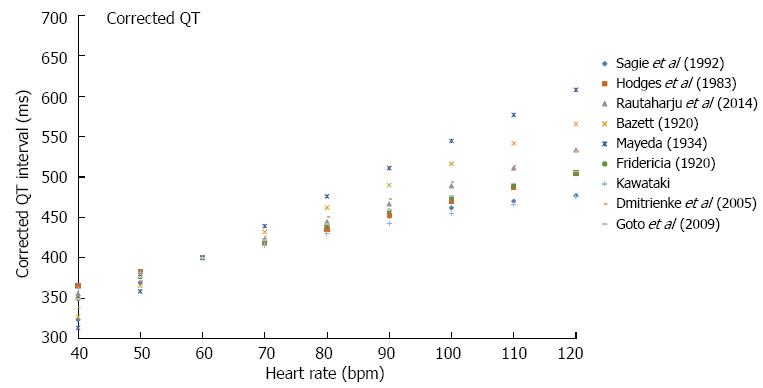
To further illustrate the effect of using each of the correction equations an example is used of of an uncorrected QT interval 400 ms in a 50 years old man (Figure 4). By definition, all QTc equations show equipoise at a heart rate of 60 bpm. The discrepancy in QTc between the different formulae is apparent at slower and faster heart rates with the magnitude of the dispersion increasing at slower and faster heart rates. At a heart rate of 100 bpm, QTc ranges from 462 ms (QTcFRM) to 546 ms (QTcMYD) with QTcBZT at 516 ms and QTcFRD at 474 ms. At a heart rate of 40 bpm, QTc ranges from 313 ms (QTcMYD) to 400 ms (QTcRTHb) with QTcBZT at 327 ms and QTcFRD at 349 ms. The variation among formulae are non-linear, which is again as a result of QTc values being equipoise at 60 bpm.
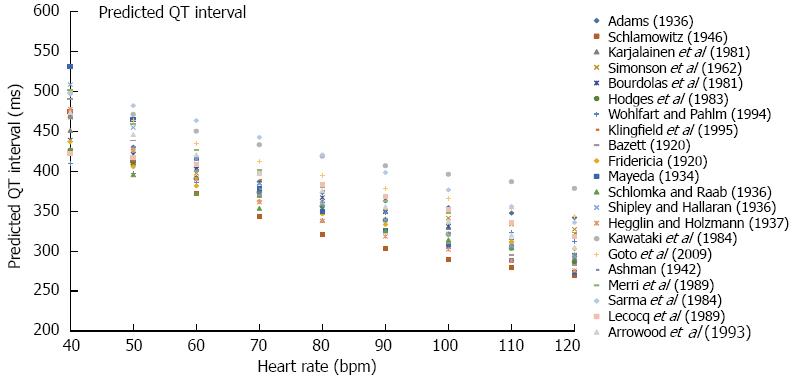
Prediction equations also show a considerable range of reported QTp values. Considering the same 50 years old man with a QT of 400 ms (Figure 5), at a heart rate of 40 bpm, QTp ranges from 313 (QTpWHL) to 530 ms (QTpMYD) with QTpBZT at 453 and QTpFRD at 436 ms. At a heart rate of 100 bpm, QTp ranges from 290 (QTpSCH) to 396 ms (QTpKWT) with QTpBZT at 287 and QTpFRD at 322 ms. A hypothesis worth considering is that if we combine all QTp equations, which are based on different populations, we may construct an interval where QTp is considered to be normal.
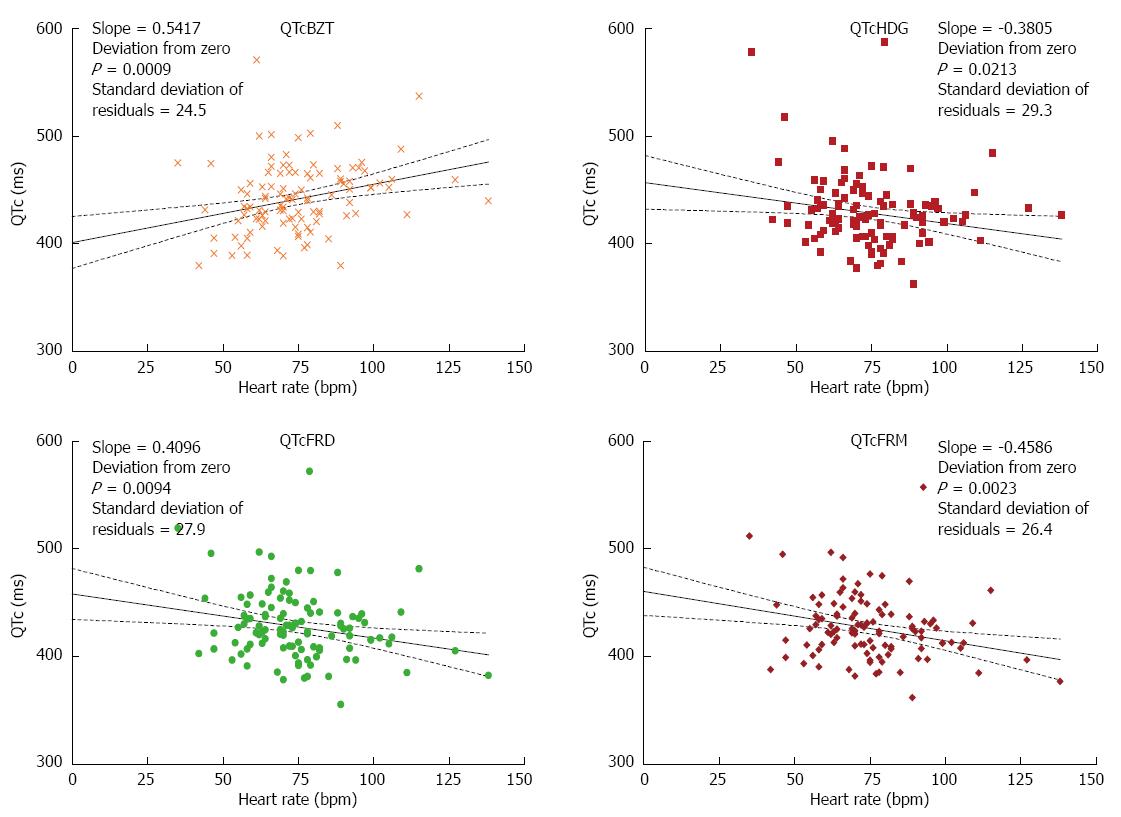
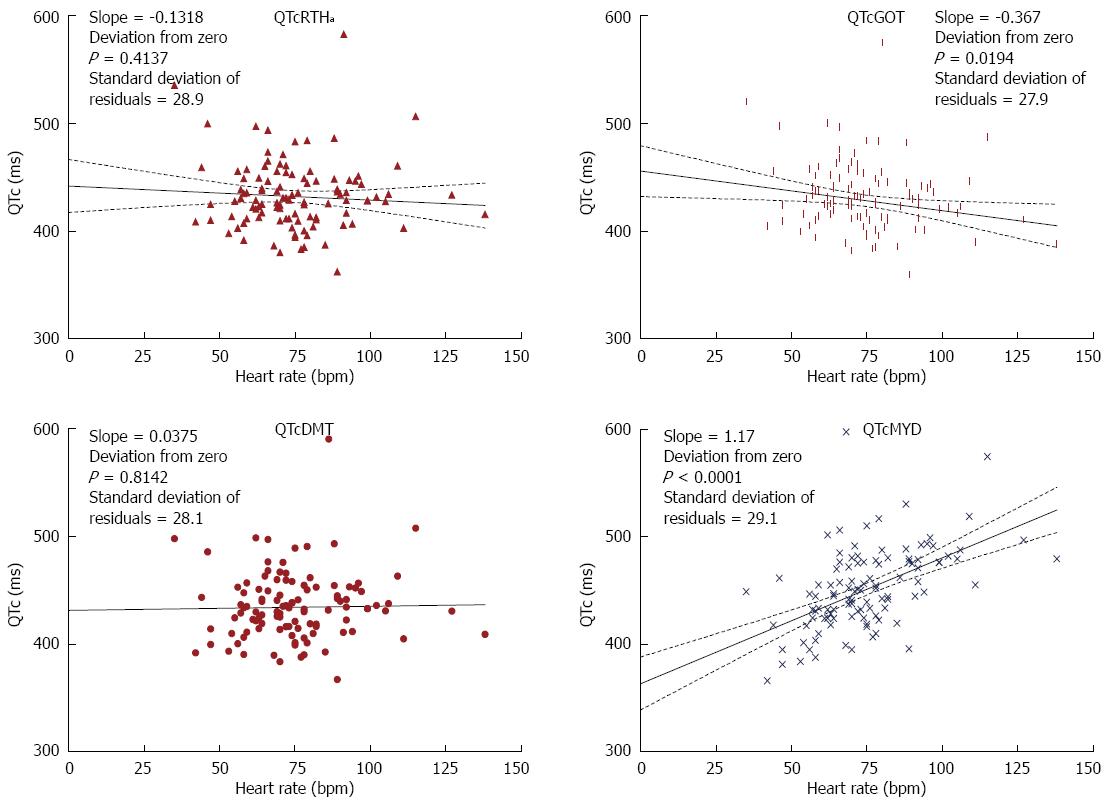
Recognizing that the goal of each formula is to produce QTc values that do not correlated with heart rate, we calculated the linear slope of eight corrective formulae for the 107 persons with various heart rates. The formulae varied in their slope (Figures 6 and 7). Two equations had a slope that was not significantly different from zero namely QTc DMT and QTc RTHa with the former being closest to zero. The other 6 equations had slopes that were significantly different from zero with the largest slope for QTcMYD. Of the equations that showed slopes that deviated from zero QTcBZT was the next largest slope or highest relationship to heart rate. The goodness of fit of the data to the linear regression (line) is shown by the standard deviation of residuals.
QT-heart rate adjustment formulae can generate a range of QT-adjusted values depending on the heart rate. Furthermore a wide range of QT-adjusted values is possible for individuals at any given heart rate. The clinician is confronted with the problem of the correct choice for adjusting the QT interval and assessing the implications of the choice.
The central issue is the absence of a true “gold standard” to identify the duration of cardiac repolarization and then to evaluate all the equations against this standard in order to determine the “best” one. The Bazett correction approach (QTcBZT) is a frequently used formula. It has long been known and criticized because it is purportedly “overcorrects” the measured QT interval at fast heart rates and under corrects it at low heart rates”[26]. The absence of a gold standard for heart rate correction makes it difficult to know what the true correction is and what is “over” and “under”-correction. The absence of a “gold” standard has likely played a role in maintaining the use of QTcBZT despite its critics[13,26,29]. While the Fridericia formula (QTcFRD) is believed to be more accurate than QTcBZT, it has already been criticized because it retains the potential for bias at either extreme of heart rate(s)[16] but other formulae also share this feature at clinically relevant faster heart rates.
There are more QTp than QTc equations perhaps because of the manner in which QT adjustment equations are derived. Most QTp equations utilize regressions of population data to a pre-determined form. The procedure is briefly as follows. First, the uncorrected QT interval raw data are presented in a scatter plot. Then, a pre-determined form of equation is selected. The pre-determined form may be linear, rational, exponential, logarithmic, or power based. Next a statistical procedure to minimize the “error” generates parameters for the model. The regressed equation becomes the QTp equation. The error is usually quantified in the form of square of the residuals, but the method to quantify error is ultimately up to the discretion of each author. Predicted QT equations are dependent on the population from which they are derived. Several equations share the same raw form, but only differ in constants. For example, Fridericia[9] and Schlomka and Raab[30] both contain the RR interval raised to the power of one third and Goto et al[25] raises RR to the power of 0.3409, which approximates the power of one third. The reason behind differing constants for the same power may have several explanations. First, there may be variations between studies in selection criteria, genetic factors of the subjects, or environmental factors. Second, there may be systematic differences in data collection such as defining the end of the T wave which is essential for QT measurement. Third, the sample sizes may not be large enough to ensure accuracy for statistical modeling.
The large number of different QTp equations and the multiple different parameters across the different equations is perhaps the reason that clinicians often opt to use QTc formulae rather than QTp formulae. Generally, QTc formulae are stripped of constants and coefficients contained in the initial formula. A presumed advantage of this approach is that some sources of variation due to subject selection, systematic errors, and sample sizes are minimized or eliminated while the important coefficients are determined from the trends of data sets.
A disadvantage of QTc formulae is that while some constants are removed to be less reflective of the sample size, the same constants played a role in the value of regressed parameters. For example, the power parameters without the accompanying constants in QTcBZT and QTcFRD will not minimize the error in the initial sample. This transformation is essentially changing the form of the initial pre-determined equation, without regressing to minimize the error.
A better approach might be fitting the initial data sets without a multiplicative coefficient.
Another problem with QTc formulae is the lack of specific limits for the definition of “prolonged QT” for each QT correction equation. Assuming that each equation is derived from a sample of normal healthy subjects, it is possible to calculate a confidence interval for the predicted duration of the QT interval. There has not, however, been a standard way to determine the confidence interval of a transformed QTc equation from the original data for each formula.
QTc and QTp equations have been categorized according to whether the equations are linear, hyperbolic, parabolic, logarithmic, shifted logarithmic, exponential or general additive models[20,22]. Our classification and nomenclature simplifies the categorization. From usual clinical data, it appears that most recent power correction equations agree with each other, and all equations may use the same limit for prolonged QT. The agreement among power-based QT correction equations is generally good because most resting heart rates are sufficiently close to 60, and that the RR interval is close to 1. For example, at a heart rate of 70 beats per minute, the RR is 1.17 s. The square root of 1.17 is 1.08 and the cube root of 1.17 is 1.05, where the difference is less than 3%. Hence, it is not a coincidence that most power correction equations agree among commonly encountered heart rates. The nature of the equation demands it near the “normal heart rates”. The reported phenomenon that some equations fail at higher or lower heart rates is intrinsic to the choice of a power-based model in the regression process. Rautaharju and Zhang[15] concluded that pure power functions generate a rate-dependent bias in the upper and lower ranges of the adjusted QT distribution that can be reduced by incorporating an intercept. We found, however, that approach still led to a rate dependency but agree that the approach minimizes such rate dependency.
From our discussion, it is clear that neither corrective nor predictive formulae have an absolute theoretical benefit over the other. In fact, corrective formulae are often incorrectly derived from predictive equations. However, we advocate for the use of corrective formulae on the basis that they are already readily adopted clinically, and upper limits are already determined by clinicians through decades of experience. Clinically, it is more logical and customary to see if a given measured value (QTc in this case) is within a pre-determined range via a QTc formula rather than a QTp formula. With a QTp formula, an absolute value must be calculated, and such operations can lead to errors in certain instances. To use corrective formulae, more work needs to be done to systemically determine the appropriate upper and lower limits for the duration of QTc for each formula.
We constructed scatter plots from ECG data obtained from the patient group (Figures 6 and 7). Each QTc formula was applied according to their stated form. This includes any available considerations given to age and gender. Our evaluation begins with Bazett (QTcBZT) and Fridericia (QTcFRD), both commonly used equations in clinical practice. We observe that QTcFRD is associated with a smaller slope with a linear regression line, and this translates into QTcFRD being superior to QTcBZT in attempting to separate the dependence of QT duration on heart rate. However, it is also clear that newer equations with larger sample sizes can achieve much higher accuracy than either QTcFRD or QTcBZT. The rank order of the slope was from best (closest to zero) was QTcDMT, QTcRTHa, QTcHDG, QTcGOT, QTcFRM, QTcFRD, QTcBZT and QTcMYD. As an example, QTcDMT has a slope of 0.04, which is more accurate than other equations studied. Hence, we conclude that QTcDMT should be used in future practice as it best separates the dependence of QTc from heart rate. QTcRTHa was the next best and warrants similar consideration.
There are many steps to take before QTcDMT or QTcRTHa replaces QTcBZT or QTcFRD. First, our results should be corroborated with a larger sized clinical study, with more subjects with well-defined clinical or physiological states. Second, it is essential to determine the upper and lower limits for a normal “QTcDMT” value. We recommend that the upper and lower bound be set at 95% inclusion of all test subjects, which can be achieved by ranking the results obtained or via resampling methods, such as bootstrap or jackknife methods. Lastly, it is important to validate the upper and lower limits in a clinical setting in comparison to a standard by defining the correlation - sensitivity and specificity of newer QTc formulae - QTcDMT or QTcRTH in the detection of electrolyte disturbances, drug-induced cardiac toxicity, genetic abnormalities of cardiac channels (channelopathies) and autonomic nervous system dysregulation.
In summary, the clinician has a choice of over 20 different equations to adjust the QT interval to minimize the effect of heart rate on the QT interval. These equations should be referred to by a standard nomenclature such as the one proposed here in. The clinician should recognize that at some heart rates, there will be marked discordances between formulae both for QTc and QTp. We believe that QTc equations are preferred over QTp equations because there are more easily adopted in the clinical setting. Some equations have a slope of their QTc to heart rate close to zero but the fit of the equations may not be ideal. While none of the formulae may completely eliminate the effect of heart rate on the QT interval, some of the recent formulae based on large population samples appear to be better that the older heart rate adjustment formulae. In particular, we have found that QTcDMT and to some extent QTcRTHa are significantly more accurate than other formulae studied. Larger clinical studies are required to validate their precision. In addition, the lower and upper limits of the newer equations specifically QTcDMT and QTcRTHa should be tested under a clinical setting to compare them to the current commonly used equations such as QTcBZT and QTcFRD. With these caveats, QTcDMT and QTcRTHa warrant consideration for implementation in clinical practice.
P- Reviewer: Amiya E, Lazzeri C, Nunez-Gil IJ, Toro R S- Editor: Song XX L- Editor: A E- Editor: Zhang DN
| 1. | Burchell HB. The QT interval historically treated. Pediatr Cardiol. 1983;4:139-148. |
| 2. | Whitted AD, Stanifer JW, Dube P, Borkowski BJ, Yusuf J, Komolafe BO, Davis RC, Soberman JE, Weber KT. A dyshomeostasis of electrolytes and trace elements in acute stressor states: impact on the heart. Am J Med Sci. 2010;340:48-53. |
| 3. | Roden DM. Drug-induced prolongation of the QT interval. N Engl J Med. 2004;350:1013-1022. |
| 4. | Bokil NJ, Baisden JM, Radford DJ, Summers KM. Molecular genetics of long QT syndrome. Mol Genet Metab. 2010;101:1-8. |
| 5. | Katsanos AH, Korantzopoulos P, Tsivgoulis G, Kyritsis AP, Kosmidou M, Giannopoulos S. Electrocardiographic abnormalities and cardiac arrhythmias in structural brain lesions. Int J Cardiol. 2013;167:328-334. |
| 6. | Rabkin SW. Aging effects on QT interval: Implications for cardiac safety of antipsychotic drugs. J Geriatr Cardiol. 2014;11:20-25. |
| 7. | Zhang Y, Post WS, Blasco-Colmenares E, Dalal D, Tomaselli GF, Guallar E. Electrocardiographic QT interval and mortality: a meta-analysis. Epidemiology. 2011;22:660-670. |
| 9. | Fridericia L. Die sytolendauer in elektrokardiogramm bei normalen menschen und bei herzkranken. Acta Med Scand. 1920;53:469-486. |
| 10. | Simonson E, Cady LD, Woodbury M. The normal Q-T interval. Am Heart J. 1962;63:747-753. |
| 11. | Batchvarov VN, Ghuran A, Smetana P, Hnatkova K, Harries M, Dilaveris P, Camm AJ, Malik M. QT-RR relationship in healthy subjects exhibits substantial intersubject variability and high intrasubject stability. Am J Physiol Heart Circ Physiol. 2002;282:H2356-H2363. |
| 12. | Malik M. The imprecision in heart rate correction may lead to artificial observations of drug induced QT interval changes. Pacing Clin Electrophysiol. 2002;25:209-216. |
| 13. | Manion CV, Whitsett TL, Wilson MF. Applicability of correcting the QT interval for heart rate. Am Heart J. 1980;99:678. |
| 14. | Indik JH, Pearson EC, Fried K, Woosley RL. Bazett and Fridericia QT correction formulas interfere with measurement of drug-induced changes in QT interval. Heart Rhythm. 2006;3:1003-1007. |
| 15. | Rautaharju PM, Zhang ZM. Linearly scaled, rate-invariant normal limits for QT interval: eight decades of incorrect application of power functions. J Cardiovasc Electrophysiol. 2002;13:1211-1218. |
| 16. | Dmitrienko AA, Sides GD, Winters KJ, Kovacs RJ, Rebhun DM, Bloom JC, Groh W, Eisenberg PR. Electrocardiogram reference ranges derived from a standardized clinical trial population. Drug Inf J. 2005;39:395-405. |
| 17. | Rautaharju PM, Mason JW, Akiyama T. New age- and sex-specific criteria for QT prolongation based on rate correction formulas that minimize bias at the upper normal limits. Int J Cardiol. 2014;174:535-540. |
| 18. | Stockbridge N, Zhang J, Garnett C, Malik M. Practice and challenges of thorough QT studies. J Electrocardiol. 2012;45:582-587. |
| 19. | Chen J, Zhao X. A Bayesian measurement error approach to QT interval correction and prolongation. J Biopharm Stat. 2010;20:523-542. |
| 20. | Wang D, Cheung YB, Arezina R, Taubel J, Camm AJ. A nonparametric approach to QT interval correction for heart rate. J Biopharm Stat. 2010;20:508-522. |
| 21. | Hnatkova K, Malik M. “Optimum” formulae for heart rate correction of the QT interval. Pacing Clin Electrophysiol. 1999;22:1683-1687. |
| 22. | Malik M. Problems of heart rate correction in assessment of drug-induced QT interval prolongation. J Cardiovasc Electrophysiol. 2001;12:411-420. |
| 23. | Shipley RA, Hallaran W. The four-lead electrocardiogram in two hundred normal men and women. Am Heart J. 1936;11:325-345. |
| 24. | Mayeda I. On time relation between systolic duration of heart and pulse rate. Acta Sch Med Univ Imp. 1934;17:53-55. |
| 25. | Goto H, Mamorita N, Ikeda N, Miyahara H. Estimation of the upper limit of the reference value of the QT interval in rest electrocardiograms in healthy young Japanese men using the bootstrap method. J Electrocardiol. 2008;41:703.e1-703.10. |
| 26. | Sagie A, Larson MG, Goldberg RJ, Bengtson JR, Levy D. An improved method for adjusting the QT interval for heart rate (the Framingham Heart Study). Am J Cardiol. 1992;70:797-801. |
| 27. | Karjalainen J, Viitasalo M, Mänttäri M, Manninen V. Relation between QT intervals and heart rates from 40 to 120 beats/min in rest electrocardiograms of men and a simple method to adjust QT interval values. J Am Coll Cardiol. 1994;23:1547-1553. |
| 28. | Sarma JS, Sarma RJ, Bilitch M, Katz D, Song SL. An exponential formula for heart rate dependence of QT interval during exercise and cardiac pacing in humans: reevaluation of Bazett’s formula. Am J Cardiol. 1984;54:103-108. |
| 29. | Ahnve S. Correction of the QT interval for heart rate: review of different formulas and the use of Bazett’s formula in myocardial infarction. Am Heart J. 1985;109:568-574. |
| 30. | Schlomka VG, Raab W. Zur Bewertung der relativen systolendauer. Z Kreislaufforsch. 1936;18:673-700. |
| 31. | Hodges M, Salerno D, Erlien D. Bazett’s QT correction reviewed: Evidence that a linear QT correction for heart rate is better. J Am Coll Cardiol. 1983;1:1983. |
| 32. | Kawataki M, Kashima T, Toda H, Tanaka H. Relation between QT interval and heart rate. applications and limitations of Bazett’s formula. J Electrocardiol. 1984;17:371-375. |
| 33. | Adams W. The normal duration of the electrocardiographic ventricular complex. J Clin Invest. 1936;15:335-342. |
| 34. | Schlamowitz I. An analysis of the time relationships within the cardiac cycle in electrocardiograms of normal men. The duration of the Q-T interval and its relationship to the cycle length (R-R interval). Am Heart J. 1946;31:329-342. |
| 35. | Boudoulas H, Geleris P, Lewis RP, Rittgers SE. Linear relationship between electrical systole, mechanical systole, and heart rate. Chest. 1981;80:613-617. |
| 36. | Wohlfart B, Pahlm O. Normal values for QT intervals in ECG during ramp exercise on bicycle. Clin Physiol. 1994;14:371-377. |
| 37. | Kligfield P, Lax KG, Okin PM. QTc behavior during treadmill exercise as a function of the underlying QT-heart rate relationship. J Electrocardiol. 1995;28 Suppl:206-210. |
| 38. | Hegglin R, Holzmann M. Die klinische Bedeutung der verlangerten QT-Distanz (Systolendauer) im Electrokardiogramm. Ztschr Klin Med. 1937;132:1. |
| 39. | Ashman R. The normal duration of the Q-T interval. Am Heart J. 1942;23:522-534. |
| 40. | Merri M, Benhorin J, Alberti M, Locati E, Moss AJ. Electrocardiographic quantitation of ventricular repolarization. Circulation. 1989;80:1301-1308. |
| 41. | Lecocq B, Lecocq V, Jaillon P. Physiologic relation between cardiac cycle and QT duration in healthy volunteers. Am J Cardiol. 1989;64:481-486. |
| 42. | Arrowood JA, Kline J, Simpson PM, Quigg RJ, Pippin JJ, Nixon JV, Mohanty PK. Modulation of the QT interval: effects of graded exercise and reflex cardiovascular stimulation. J Appl Physiol (1985). 1993;75:2217-2223. |


