Published online Oct 26, 2021. doi: 10.4330/wjc.v13.i10.533
Peer-review started: May 1, 2021
First decision: June 7, 2021
Revised: June 25, 2021
Accepted: September 26, 2021
Article in press: September 26, 2021
Published online: October 26, 2021
Processing time: 172 Days and 15.8 Hours
Chronic obstructive lung disease (COPD), predominantly emphysema, causes several thoracic anatomical and hemodynamic changes which may cause changes in various electrocardiographic parameters. A 12-lead electrocardiogram (ECG), which is often a part of routine evaluation in most clinical settings, may serve as a useful screening modality for diagnosis of COPD or emphysema. Our current article aims to provide a comprehensive review of the electrocardiographic changes encountered in COPD/emphysema utilizing published PubMed and Medline literature database. Several important ECG changes are present in COPD/emphysema and may serve as a good diagnostic tool. Verticalization of P-vector, changes in QRS duration, pattern recognition of precordial R-wave progression and axial shifts can be considered some of the most valuable markers among other changes. In conclusion, 12-lead surface electrocardiogram can serve as a valuable tool for the diagnosis of COPD and/or emphysema. An appropriate knowledge of these ECG changes can not only help in the diagnosis but can also immensely help in an appropriate clinical management of these patients.
Core Tip: Chronic obstructive pulmonary disease (COPD) remains a major cause of morbidity and mortality in the United States. With COPD, a timely diagnosis and treatment are crucial to prevent increasing severity. COPD can cause electrocardiographic changes due to factors including lung hyperinflation. These changes can be present on the electrocardiograms of patients without COPD; however, specific parameters not seen in those with COPD will be indicative of other diseases such as congenital heart disease. The present review focuses on the use of 12-lead electrocardiogram with an emphasis on vertical frontal plane P-wave axis, combined with other minor abnormalities, which can aid in the diagnosis of COPD.
- Citation: Gupta P, Jain H, Gill M, Bharaj G, Khalid N, Chaudhry W, Chhabra L. Electrocardiographic changes in Emphysema. World J Cardiol 2021; 13(10): 533-545
- URL: https://www.wjgnet.com/1949-8462/full/v13/i10/533.htm
- DOI: https://dx.doi.org/10.4330/wjc.v13.i10.533
Chronic obstructive pulmonary disease (COPD) is a common respiratory condition and is ranked among the top five causes of death in the United States[1]. It causes significant obstructive airflow limitation and is associated with chronic oxygen dependence, functional limitation, recurrent hospitalizations as well as increased morbidity. Prompt diagnosis and treatment can prevent worsening of the disease and offer morbidity and mortality benefit. As such, it is important for clinicians to promptly recognize this condition even if the patient is getting evaluated for other reasons.
COPD causes several thoracic anatomical and hemodynamic changes which may produce changes in the different electrocardiographic parameters. Increased airway obstruction, right ventricular afterload, diaphragmatic displacement due to hyperinflation, clockwise rotation of the right heart, and body mass index changes correlated with clockwise rotation of the frontal QRS-vector are some of the underlying factors which play a major role in the electrocardiographic changes observed in patients with COPD[2]. A 12-lead electrocardiogram (ECG), which is often a part of routine evaluation in many clinical settings, can yield useful diagnostic clues and may serve as an initial screening modality as well as aid in further evaluation and management of COPD or emphysema. However, some of the ECG changes observed in patients with known COPD/emphysema may carry an independent prognostic value.
This comprehensive review aims at discussing characteristic electrocardiographic findings in COPD, some of which may offer a high sensitivity and specificity as stand-alone criteria in the diagnosis of COPD.
We searched PubMed and Medline for published articles focusing on COPD, emphysema, and electrocardiography. The search terms used in different combinations, were “chronic obstructive lung disease and ECG changes”, “emphysema and ECG changes”, “COPD and ECG changes”, “COPD and ECG”, “COPD and electrocardiogram”, “emphysema and electrocardiogram”, “emphysema and ECG”, “COPD and electrocardiographic changes”, and “ emphysema and electrocardiographic changes”, yielding us 177, 70, 175, 1154, 1098, 535, 549, 50 and 31 articles respectively indexed in PubMed and Medline at the time of writing this publication. These articles were further screened for subject relevancy and used if they were English-language full-text papers. Both review articles and original papers were included. Finally, the data from these articles used for writing of this review paper were those that were most relevant and pertinent to our current subject of discussion.
Emphysema produces a variety of electrocardiographic changes which are discussed in details below. A summary of these changes is enclosed at the end of the manuscript in a tabular format (Table 1).
| Vertical P-wave | P-wave axis > 60° |
| P-pulmonale | P-amplitude in II, III or aVF ≥ 2.5 mm |
| P-amplitude in V1 ≥ 1.5 mm | |
| Right ventricular hypertrophy | R in V1 ≥ 7 mm |
| R/S in V1 > 1 | |
| VAT in V1 > 35 ms | |
| Sokolow-Lyon: Right ventricular hypertrophy | R in V1 + S in V5 or V6 > 10.5 mm |
| Clockwise rotation | R/S ratio in V5 ≤ 1 |
| Low voltage limb leads | QRS (R+S) < 5 mm in I, II, aVF, III (all) |
| Low voltage precordial leads | QRS < 10 mV in V1–V6 (all) |
| S1S2S3 pattern | Dominant S in I, II, III (all)1 |
| QS complex | Lead III |
| Rightward QRS-axis deviation: | > 90° |
| Short QRS duration | < 75 ms |
| Elevated resting heart rate (especially during exacerbation) | HR > 80 beats/min |
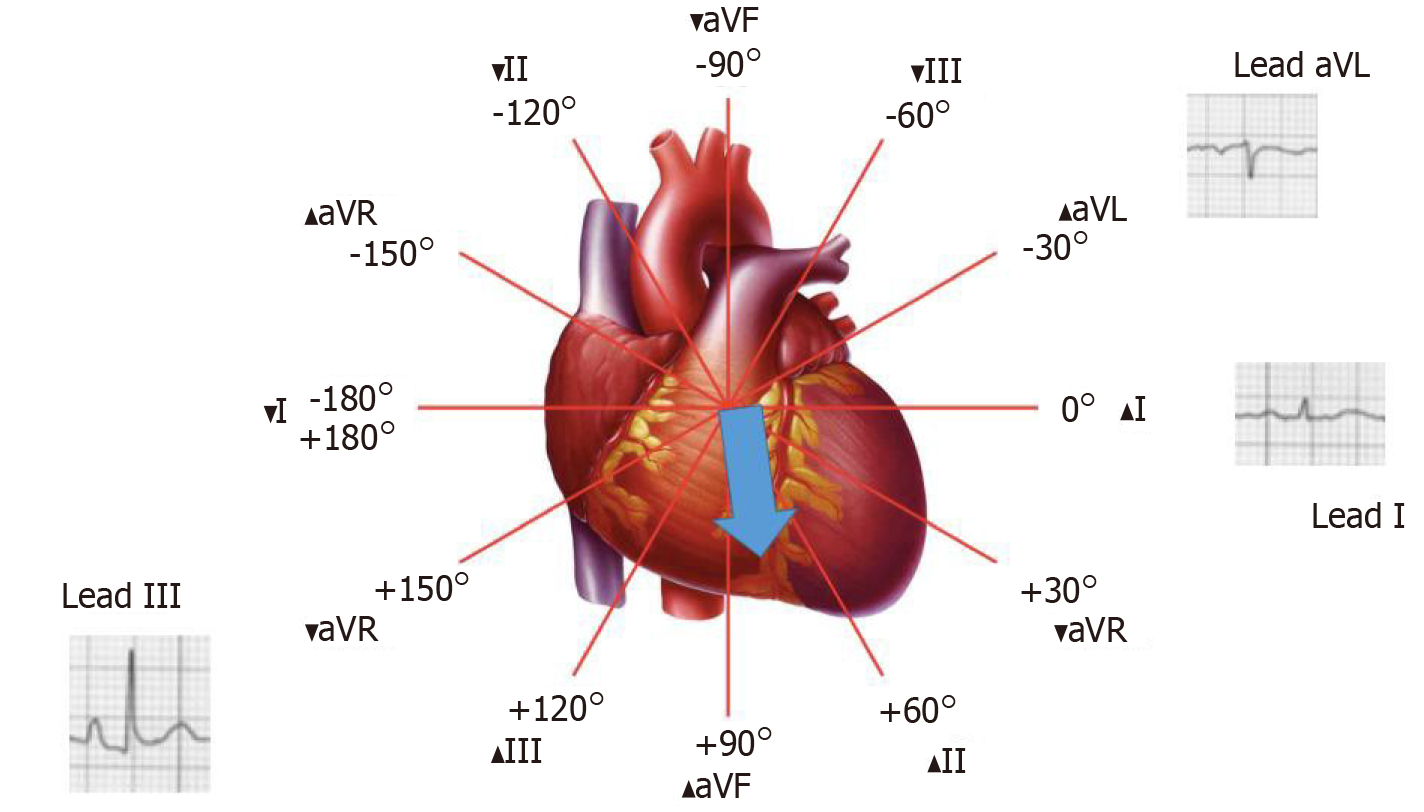
The changes in the frontal plane P wave axis are among one of the most important changes produced in the standard 12-lead ECG by emphysema. In most normal adults, the frontal P axis is considered to be within a very narrow range, +45° to +65°[2,3]. Studies from the 1940s and 1950s suggested that in patients with chronic lung disease, the mean frontal P vector was shifted rightward or vertically[2,4]. A study of 50 cases of chronic cor pulmonale found that all but 8 cases had a mean manifest frontal P axis of 60° or more[4]. Spodick and colleagues[2] analyzed ECGs of 79 consecutive hospital admissions for diffuse lung disease (predominantly emphysema) and found that the mean manifest P axis was to the right of +70° in 83% of these cases. A vertical P wave axis (> 60°) in the frontal plane especially in individuals over age 45 years has been considered highly suggestive of emphysema by many studies since then[5-12].
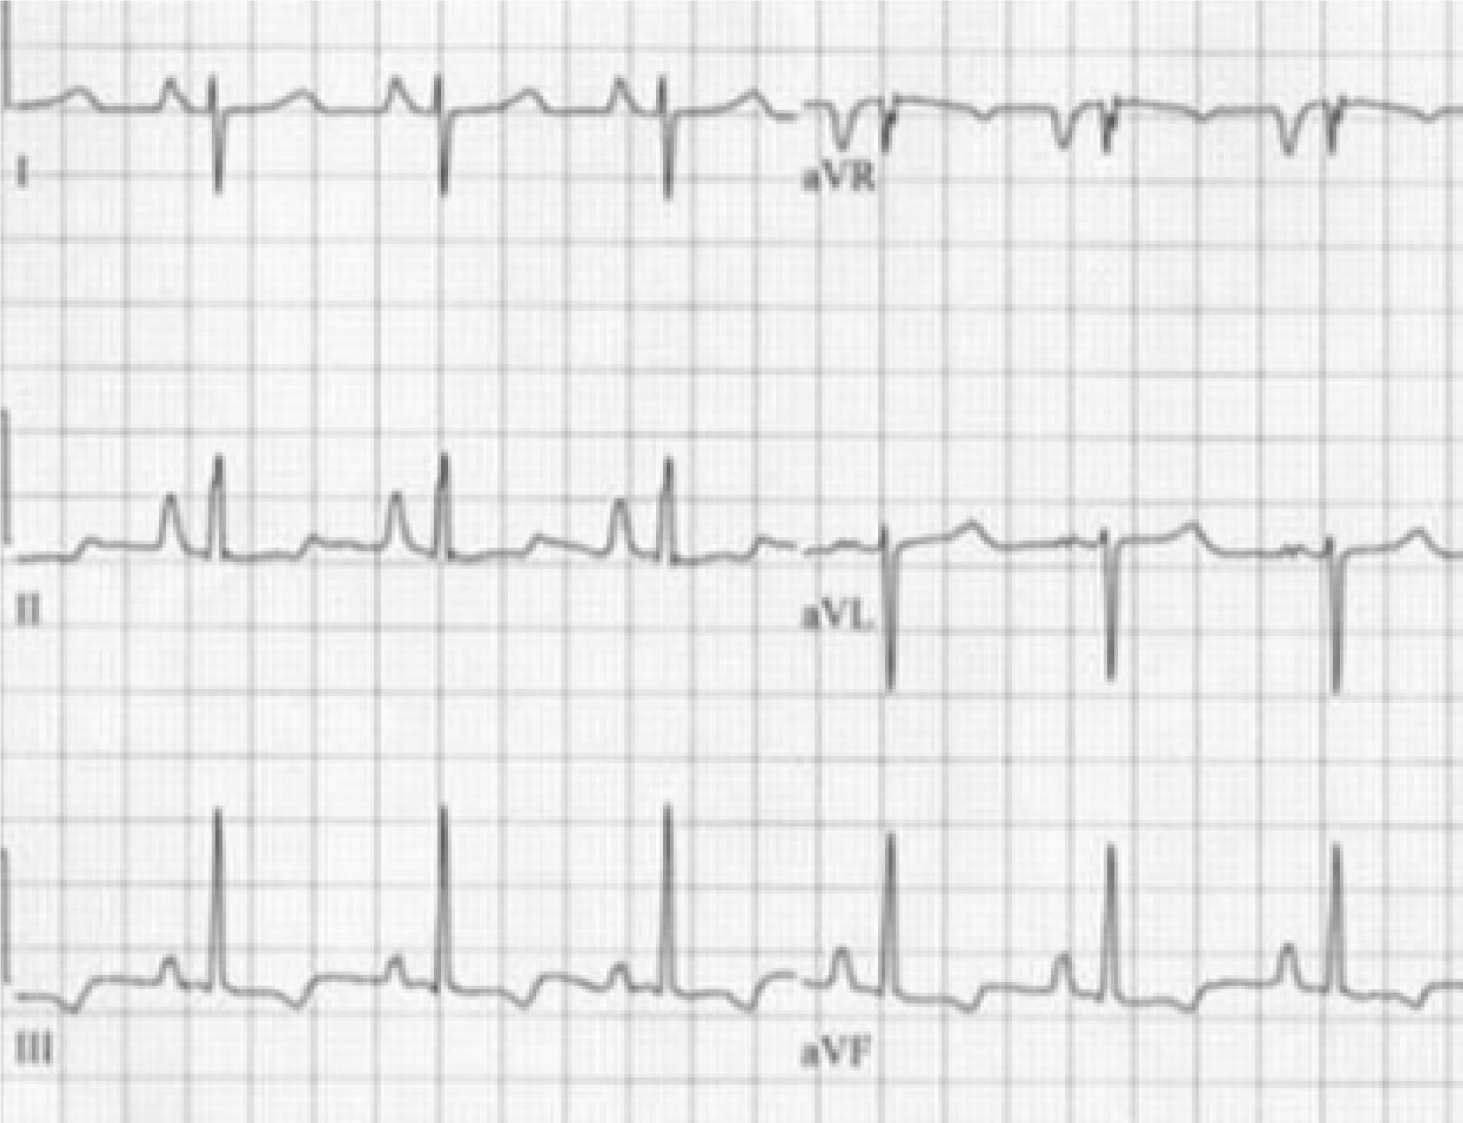
As depicted in Figure 1 and Figure 2, a vertical P vector can be primarily determined by two methods on a standard 12-lead electrocardiogram—P wave amplitude in lead III greater than in lead I (bipolar lead set) and/or a predominantly negative P wave in lead aVL (unipolar lead set)[2,13,14]. Out of these two criteria, the bipolar lead set appears to be more sensitive. A recent study from our group reviewed 100 consecutive ECGs of patients with a known diagnosis of emphysema found the bipolar lead set to be a more sensitive marker of vertical P-wave axis in emphysema than the unipolar lead set (sensitivity 88% vs 66% respectively)[13]. This study excluded patients younger than 45 years because a vertical P vector may be a normal finding in these patients[13].
Several studies have investigated the sensitivity and specificity of P vector verticalization as a criterion in screening for emphysema. A large study evaluated ECGs of 600 patients with vertical P avector and compared with age and sex matched control cohort with P-vector of < 60° which demonstrated that the sensitivity and specificity of vertical P-vector in diagnosing emphysema to be 94% and 87% respectively[5]. Other studies have shown comparable results[12,14]. Another study showed that frontal P axis > 80° was the single best criterion (among many other P and QRS criteria) for the separation of patients with and without COPD[15]. When the vertical P axis (> 60°) was combined with a QRS duration of < 75 ms, the specificity increased to 100% at the cost of significant decrease in sensitivity[7]. Similar findings of increased specificity and decreased sensitivity have been noted when vertical P axis was used in conjunction with one of the QRS criteria such as vertical QRS axis, low voltage in Leads V6 and/or Vs, as well as R/S ratio in Leads V5 and/or V6 < 1[15].
In addition to carrying a high sensitivity for screening of emphysema, the degree of P axis verticalization has also been found to strongly correlate with the severity of emphysema[5,8,10]. In a study of 154 patients with chronic bronchitis, and with or without emphysema, P axes > +75° correlated negatively with severity of lung disease measured by forced expiratory volume/vital capacity (FEV1/VC%, r = -0.724, P < 0.05)[8]. Calatayud et al[10] showed that the frontal P axis negatively correlated (r = -0.35, P < 0.01) with maximum voluntary ventilation (MVV) in a group of 173 patients with COPD referred for pulmonary function testing. In some recent studies, a significant positive correlation has been observed between the radiographic quantification of severity of emphysema and electrocardiographic P-vector verticalization in patients with established clinical diagnosis of emphysema[5]. In a small retrospective study of 26 patients with emphysema who underwent high resolution computed tomography (CT) scans, the computed tomographic visual score of emphysema and orientation of the P vector had a significant overall positive correlation (r = +0.68, P = 0.0001)[5]. This was particularly strong in patients with predominantly lower lobe emphysema (r = +0.88, P = 0.000, FEV1, and orientation of P vector had almost linear negative correlation in this subgroup (r = -0.92, P < 0.0001). Another study showed significant positive correlations with radiographic percent emphysematous area estimated by high-resolution CT and degree of P vector (r = +0.77, P < 0.0001), a stronger correlation was again found in patients with predominantly lower lobe emphysema.
The mechanisms responsible for verticalization of P vector in emphysema have long been debated. P axis in restrictive lung disease tends to be more horizontal than in obstructive lung disease[6,9]. A series of consecutive patients with pure restrictive and pure obstructive lung disease demonstrated that diaphragmatic levels were significantly higher in patients with restrictive disease compared with obstructive disease (in the same series, P axes in obstructive disease were predominantly vertical and those in restrictive disease were predominantly horizontal or intermediate)[16]. It was hypothesized that opposite effects on diaphragm level by obstructive disease (low diaphragm) and by restrictive disease (high diaphragm) could explain the axis differences, because the right atrium is attached via the inferior vena cava and adjacent pericardium to the right leaf of the diaphragm. Other hypotheses attribute P vector verticalization to the presence of right atrial and right ventricular hypertrophy (RVH) from cor pulmonale.
Hypertension and left ventricular hypertrophy (LVH) represent some clinical scenarios in which a vertical P vector may be observed without the presence of emphysema[2,12]. Conversely, some patients with hypertension and LVH may have leftward P axes in the setting of emphysema[2,12]. Although it could be inferred that LVH may reduce the sensitivity of vertical P axis when used for detection of emphysema, this was refuted in a recent retrospective study[17]. It did not find any statistically significant difference in the mean P vector between emphysema patients with and without echocardiographic evidence of LVH, and concluded that the presence of LVH may not significantly alter the sensitivity of P wave verticalization when used as a sole criterion for the diagnosis of emphysema.
It has been noted that many patients with congenital heart disease (CHD) that causes right atrial enlargement, right ventricular enlargement, and right bundle branch block, a vertical P axis may be commonly noted in the absence of emphysema[11]. While most patients with emphysema tend to have posteriorly and superiorly displaced QRS vectors, those with CHD and RVH have anteriorly, rightward, and slightly inferiorly displaced late QRS vectors[11]. The presence of low voltage of QRS (< 0.7 mV in limb leads and V6) and posterior and superior displacement of the mean QRS axis can help differentiate cases of emphysema and CHD with vertical P axis.
In addition to changes in the P wave axis, a more vertical position of the heart from diaphragmatic depression in obstructive lung disease can be associated with increased amplitude of P waves in inferior leads (II, III, aVF)[9]. This mechanism has been substantiated by scientific data. “P-pulmonale” is much more common in obstructive lung disease and in fact, it has not been noted at all in cases of restrictive lung disease in some studies[17]. A study of patients with chronic lung disease[18] and P-pulmonale on ECGs who underwent right heart catheterization showed no significant increase in right atrial or pulmonary artery pressures among these patients. In contrast, none of the patients with atrial septal defect or pulmonary hypertension had P-pulmonale on ECG. Given that all the patients with P-pulmonale had low cardiothoracic ratio on chest radiograph and a considerably depressed diaphragm, the authors concluded that a more vertical position of the heart (particularly right atrium) was the major factor responsible for generation of P-pulmonale in patients with chronic lung disease[18]. Although P-pulmonale is an important finding in the chronic lung disease, it should be noted that there are some important differential diagnoses which should be entertained in cases of P-pulmonale. P-pulmonale may be observed in congenital heart disorders such as tricuspid atresia, rarely some electrolyte derangements and even in left sided cardiac dysfunction probably due to concomitant right atrial strain produced by underlying type-2 or mixed form of pulmonary hypertension[19,20]. It is also plausible that many of these patients in prior studies who had reported P-pulmonale in left heart failure may have previously undocumented co-existing chronic lung disease. It is also to be remembered that P-pulmonale is not necessarily a sign of right atrial enlargement in emphysema, but may be even likely the result of underlying pulmonary hyperinflation, right atrial hypoxia, and transient atrial strain or mechanical load directly resulting from the bronchospasm.
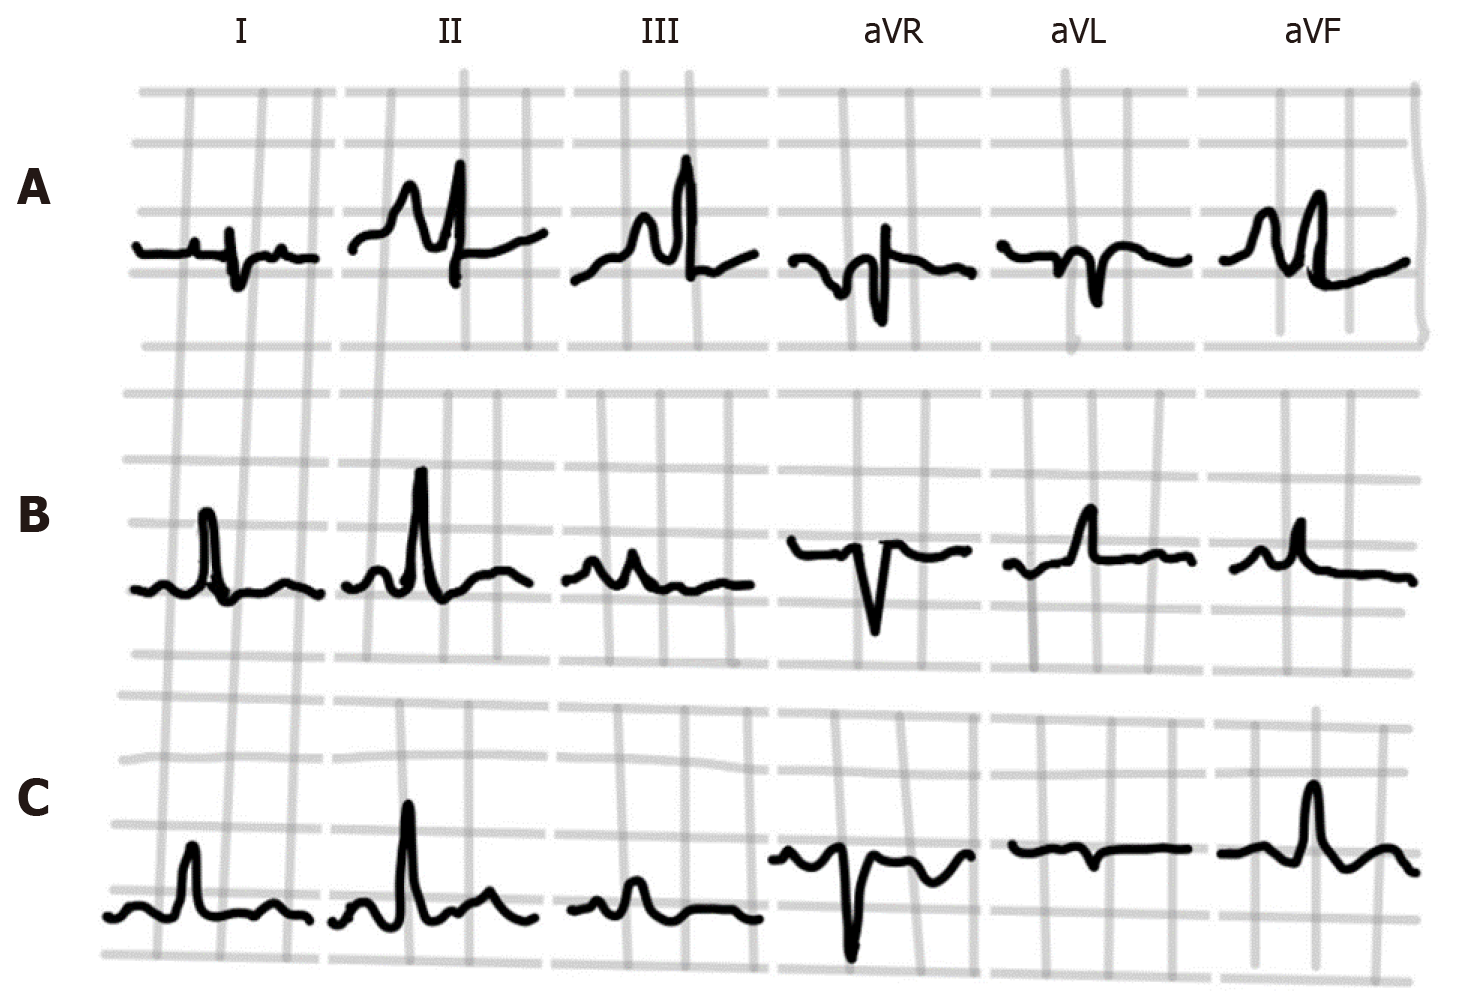
Spodick in his pioneer series of 79 consecutive hospital admissions for diffuse lung disease (almost all had emphysema) noted that classical P-pulmonale and “Gothic” P wave occurred only in cases with frontal P axis of +70° or greater[2]. A classic P-pulmonale refers to P wave amplitude > 2.5 mm in the inferior leads (II, III, aVF), while a “Gothic” P wave[2,4] refers to definite single peaking of P wave of normal amplitude in leads II, III and aVF. A schematic illustration is demonstrated in Figure 3. Although the presence of P-pulmonale and “Gothic” P waves is characteristic of obstructive disease, this finding is much less sensitive as compared to vertical P axis and is found in a little over half of the cases[2,10].
In some studies[9,10], increasing P amplitudes in inferior leads have been associated with decreasing FEV1%[9] and with MVV[11]. Thus, higher P amplitudes in inferior leads may be a marker of decreasing lung function in emphysema, although these inverse correlations were weaker than those with increasing P wave axes.
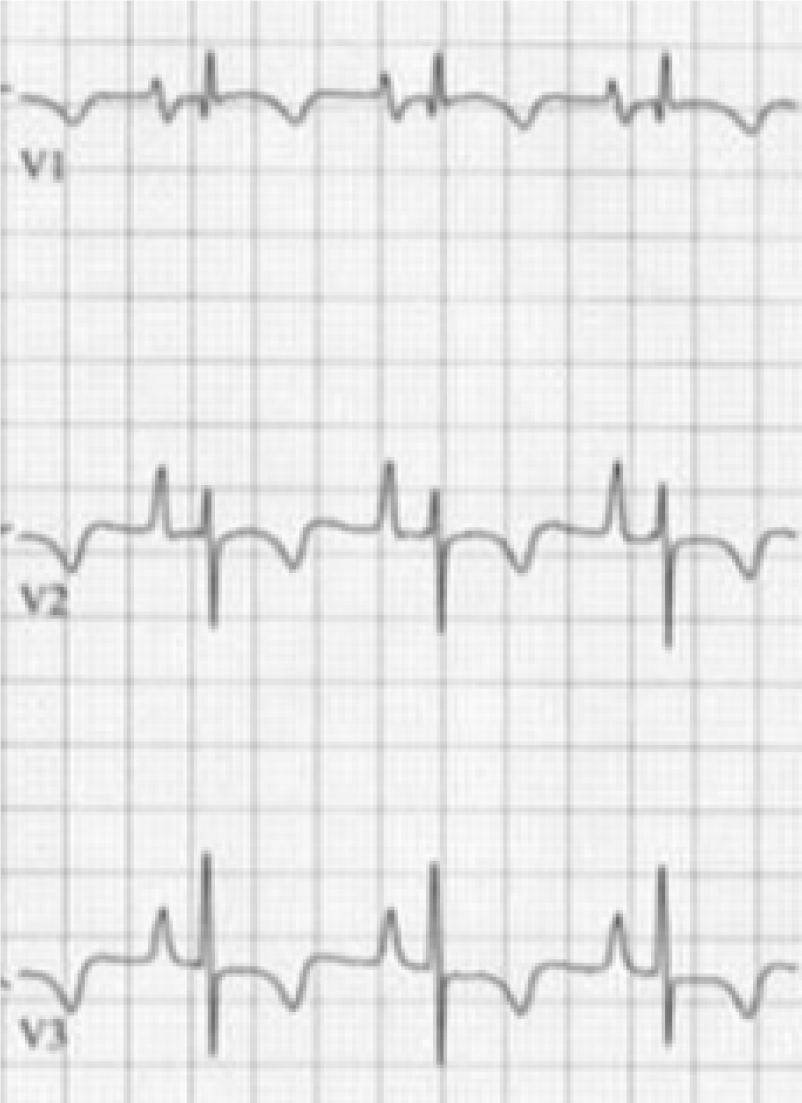
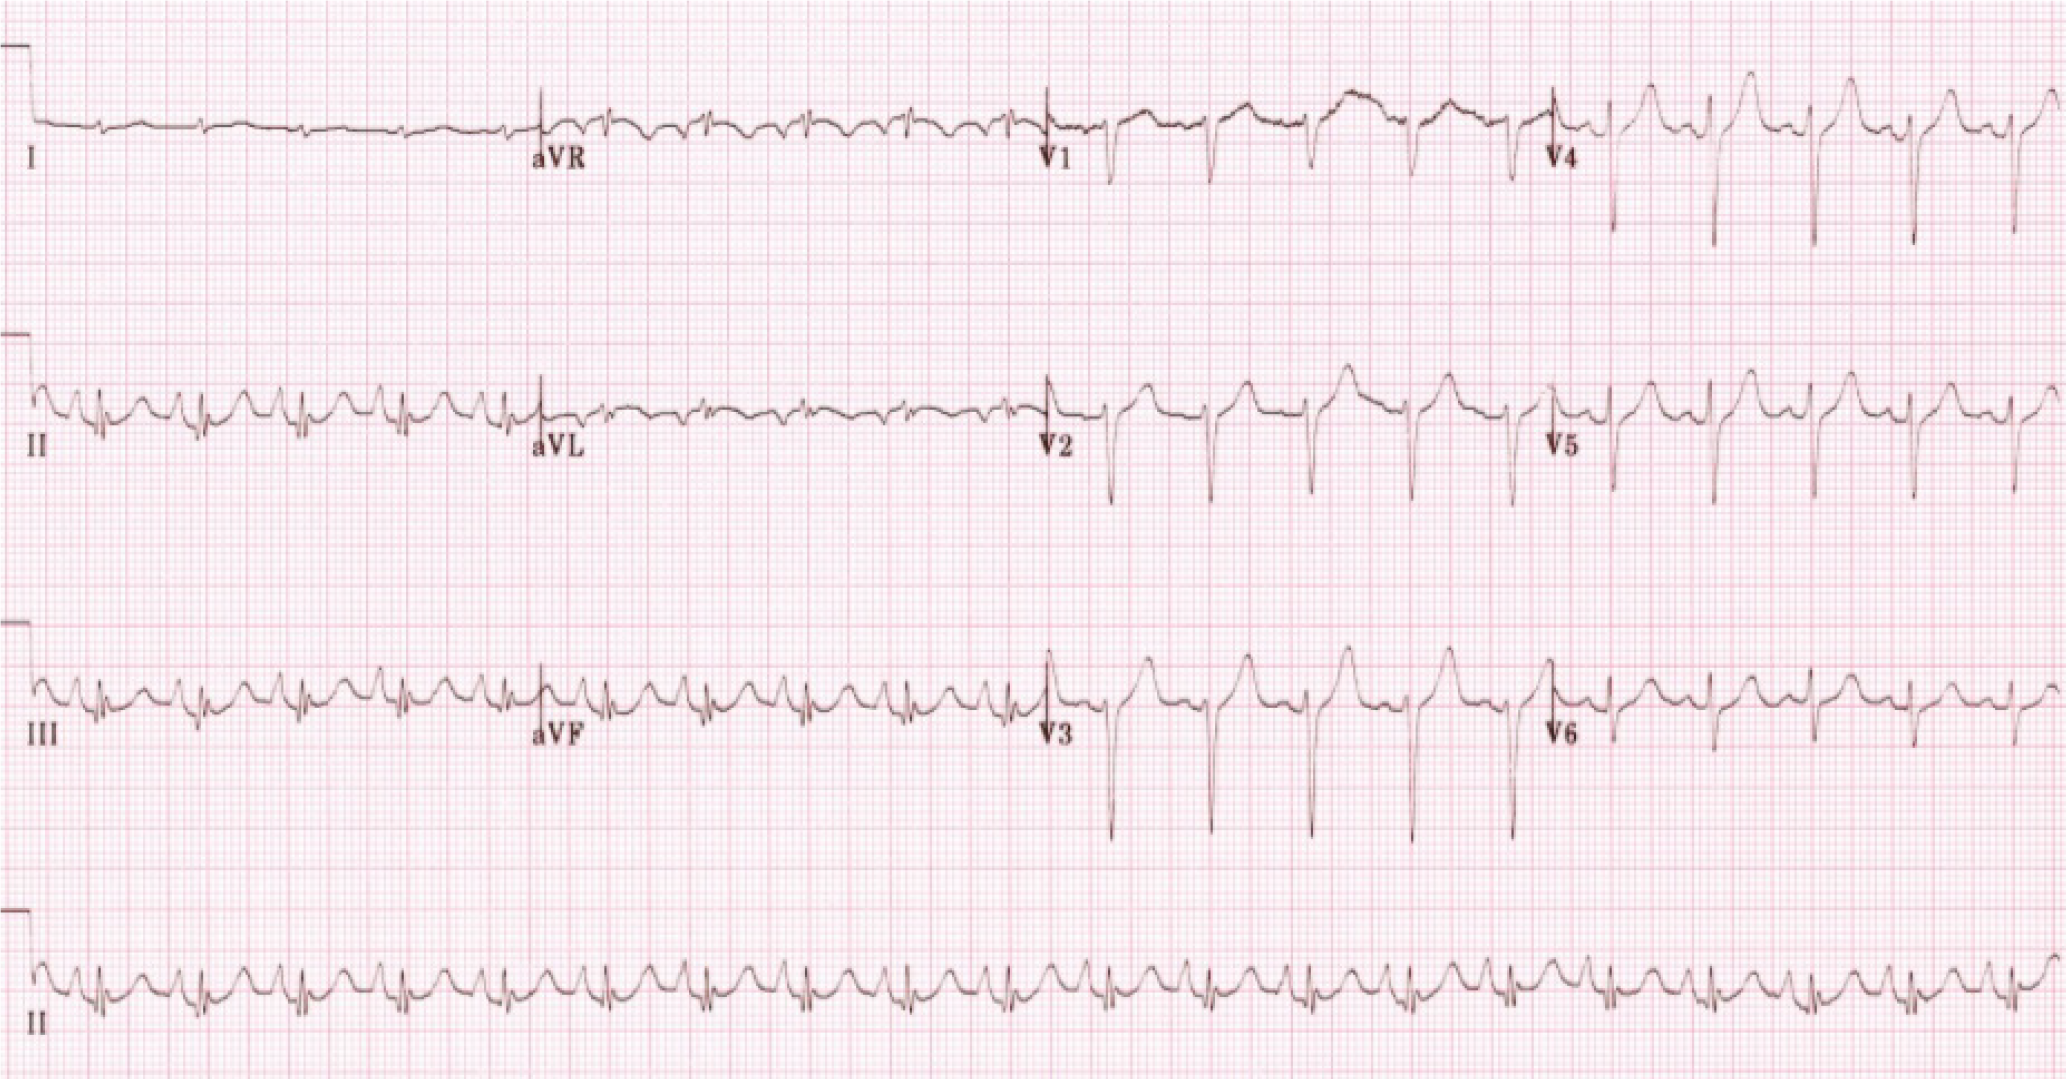
Initial increased P-wave amplitude in lead V1 may be a sign of right atrial abnormality associated with emphysema. An increased P-terminal force in V1 (V1PTF) is usually a sign of left atrial enlargement[21-23], however an increased V1PTF was also frequently found in patients with cor pulmonale (Figure 4)[24]. Thus, increased V1PTF should be interpreted with caution in patients with known emphysema. A former retrospective study showed that V1PTF correlated with vertical P vectors in patients with emphysema and may be a function of downward right atrial displacement in this population rather than left atrial enlargement[25].
Spodick et al[2] noted that 51% cases of diffuse lung disease had biphasic (+/-) P waves in at least V1 and V2 and in some cases as far as V4, 78% of these were associated with vertical P axis of +70° or more. In another series of patients with fibrosing lung disease and COPD, P wave changes in lead V1 were not significantly different between the two groups[9].
Although P-wave indices constitute an important diagnostic criterion in patients with emphysema, the application of such criteria is limited in those patients with emphysema who have atrial arrhythmias including atrial fibrillation. In those patients, other criteria such as QRS voltage, QRS axis and QRS duration changes may be used to supplement the diagnosis of chronic lung disease.
When compared to normal individuals, increased PR depression in leads II and III has been noted in patients with cor pulmonale in some older studies[4]. It was attributed to abnormal atrial repolarization because these tracings were similar to experimental tracings when atrial muscle was injured. Most such cases also exhibited P waves of high voltage, presumably due to atrial hypertrophy. One study reported strong negative correlation of PR depression of 0.5 mm or more (referred to as Ta waves) with FEV1/VC% in a series comprising of 154 patients with chronic bronchitis[8]. PR interval has been reported to be normal in patients with COPD[4,10].
However, in severe cases where COPD is coupled with pulmonary hypertension, the PR interval may be prolonged. A study examined ECG differences of 142 patients with COPD with or without pulmonary hypertension[26]. Of these, 63% of the patients that had pulmonary hypertension exhibited a longer PR interval than those without pulmonary hypertension. The prolonged PR interval in those patients was also linked to patients having an abnormal mean Papanicolaou (PAP) ≥ 40 mmHg. The combination of a mean PAP ≥ 40 mmHg and a lengthened PR interval has been shown to be a predictor of adverse outcomes for COPD patients with pulmonary hyper
The ECGs of patients with COPD tend to demonstrate shorter duration of QRS complexes[7,28]. One study in 1970s showed the QRS duration to be shorter in all 12 standard leads in COPD patients when compared to controls (mean 0.061 ± 0.005 s vs 0.074 ± 0.003 s, P < 0.001)[28]. In another recent study, QRS duration with emphysema was found to be shorter than controls (78 ± 8 vs 89 ± 6 ms, P < 0.01)[7]. The combination of QRS duration < 75 ms in conjunction with a P axis of > 60° achieved a specificity of 100% for the diagnosis of emphysema, although the sensitivity decreased to 33%[7].
The exact mechanism by which QRS duration becomes shorter in emphysema patients remains elusive, but several hypotheses have been advocated by various authors. Low voltage QRS in emphysema may result in partial loss of the initial and terminal QRS forces which become indistinguishable from baseline, resulting in shorter QRS duration[7,28]. Postmortem investigations in emphysematous patients have suggested diminished left ventricular coronal area and left ventricular cavity, consistent with “left ventricular disuse atrophy”[29]. Some authors have hypothesized that in the absence of significant RVH, a tendency might exist for rapid completion of depolarization in these patients because of “less” left ventricular mass and size[7,25].
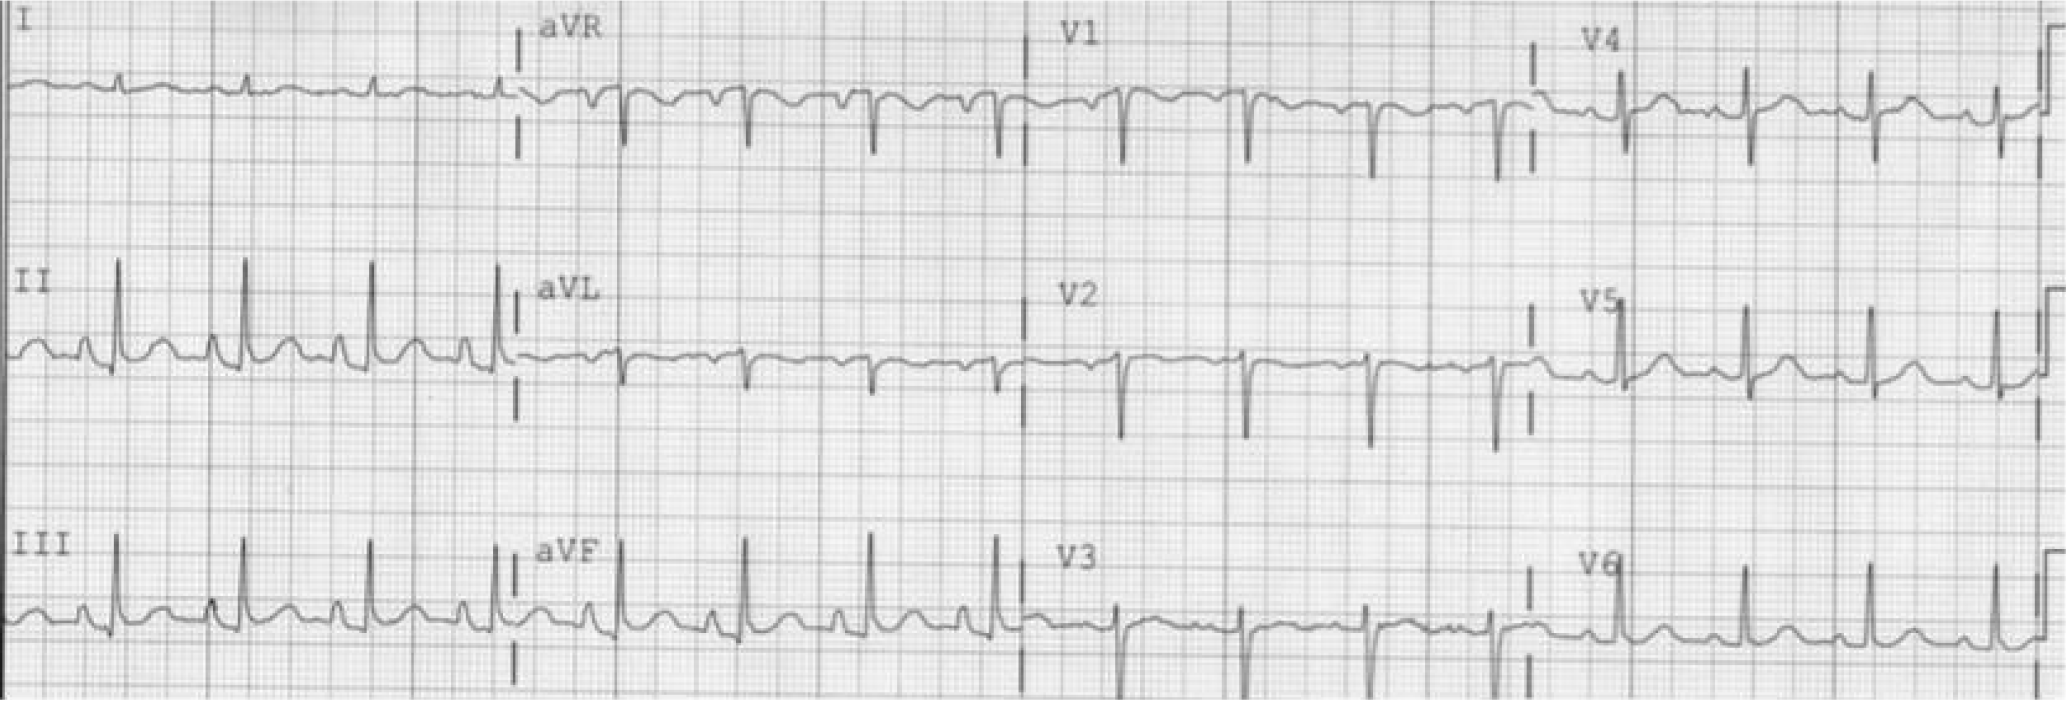
In emphysema, various changes occur in the anatomic position of the heart. It descends downward due to depression of the diaphragm from hyperinflation of the lungs, assumes a vertical position, rotates clockwise along its longitudinal axis and its apex gets displaced posteriorly[4]. These anatomic changes produce significant changes in the QRS axis in the frontal and horizontal planes. In general, the frontal plane QRS axis tends to be more rightward and the horizontal plane QRS axis tends to be directed more posteriorly (Figure 5 and 6).
Spodick et al[2] in his series of 79 consecutive patients with diffuse lung disease noticed that the mean frontal QRS axis was to the right of +70° or indeterminate in almost 50% of the cases, which was quite uncommon for their age group. Among those with relatively leftward QRS axis, many patients had evidence of concomitant left heart disease or congenital chest deformity. In the same study, posterior orientation of the QRS axis in the horizontal plane was evidenced by an S wave of ≥ 2 mm in leads V5 or V6 in 65% of the patients. Moreover, high correlation between posteriorly oriented QRS axis and vertical frontal plane QRS axis as well as vertical frontal plane P axis (> 70°) was noted, indicating that these changes were likely related to emphysema and related anatomic changes in heart position.
Another series of patients with cor pulmonale made several observations regarding QRS changes in such patients[4]. When compared to the normal population, the average voltage of R wave in leads V2-V6 was lower while the average voltage of S wave was higher in leads V3-V6. These changes were attributed to the clockwise rotation of the heart (found to be much more common than in normal hearts in this study and because of frequent finding of left shifting of transitional complexes to leads V5-6). A study from Japan investigated the relationship between shift of transitional zone on precordial leads of electrocardiogram with anatomic rotation of the heart along its long axis by cardiac CT[30]. They measured the left sided angle between interventricular septum and the horizontal axis of the body based on CT and found that the mechanism of clockwise and counterclockwise rotation of the transitional zone could be attributed to the septal angle in about two-thirds of the cases. Relatively higher position of the precordial electrocardiography leads due to vertical heart position was thought to be responsible for clockwise rotation (which typically happens in emphysema) in the remaining cases. This supports the notion that these findings in precordial leads are related to anatomic changes in heart position.
Poor R wave progression in precordial leads can be found in a variety of clinical conditions other than emphysema. One important differential is an old antero-septal myocardial infarction. One interesting study calculated R/S ratio in all precordial leads in a series of patients with emphysema and previous anteroseptal MI[31]. While the R/S ratio was significantly higher in emphysema from leads V1-V4, the pattern was reversed in leads V5-V6 where it was significantly higher in patients with MI. An R/S ratio > 3.5 in lead V5 was found to be most sensitive (87%), specific (83%) and accurate (85%) in differentiating poor R wave progression because of old anteroseptal myocardial infarction from that due to emphysema. A similar ECG pattern may sometimes be observed in patients with large right sided or tension pneumothorax which should be considered in differential diagnosis as clinically considered relevant[32].
Some other precordial QRS criteria have been studied in relation to emphysema (Figure 6). One study of COPD patients with electrocardiograms and lung function tests determined which QRS complex criteria were most useful in diagnosing COPD[33]. The best QRS criteria were R V6 amplitude of ≤ 0.5 mV and R/S ratio in V6 ≤ 1, which were present five times more in patients in quartile IV (most impaired with COPD) than quartile I. QRS axis greater than 75° or greater than 90° was present twice as often in quartile IV. Although R V6 amplitude of ≤ 0.5 mv and R/S ratio in V6 ≤ 1 were found to have a better discriminatory ratio between quartile IV and I than P axis ≥ 75°, these criteria were not applicable to almost half of the cases due to absence of S wave in V6. Another study found significant negative correlations between S wave ≥ 5 mm in V5-V6 and QRS axis over +75° with FEV1/VC%[8].
Some authors have also tried to establish QRS amplitude criteria for diagnosis of emphysema[15]. They studied the reliability of QRS amplitude ≤ 5 mm in limb leads, QRS amplitude ≤ 5 mm in leads V5 and/or V6 and R wave ≤ 7 mm in V5 and ≤ 5 mm in V6. Approximately one-half of the patients were categorized as false positive by these criteria, mostly due to atherosclerotic cardiovascular disease. Other studies did not find QRS amplitude criteria in limb leads to be useful in discriminating between different quartiles of lung function[33]. The average voltage of R+S in precordial leads was normal in cor pulmonale patients in one study[4].
Older studies found that the average amplitude of R waves was lower while the amplitude of S waves was higher in leads I, II and III among patients with cor pulmonale when compared with normal population[4]. This is in keeping with the higher frequency of right axis deviation of QRS in the frontal plane in patients with emphysema. Some patients may demonstrate the S1-S2-S3 pattern (Figure 7) in leads I, II and III, where the S is of near to or greater magnitude than the R in each of these leads. This is often a normal finding in young individuals and frequently seen in patients with RVH due to other congenital and acquired lesions[34], although appears to have a relatively lower incidence in patients with emphysema (9-22%)[4,15,34,35]. When present, it is usually indicative of severe lung disease[15].
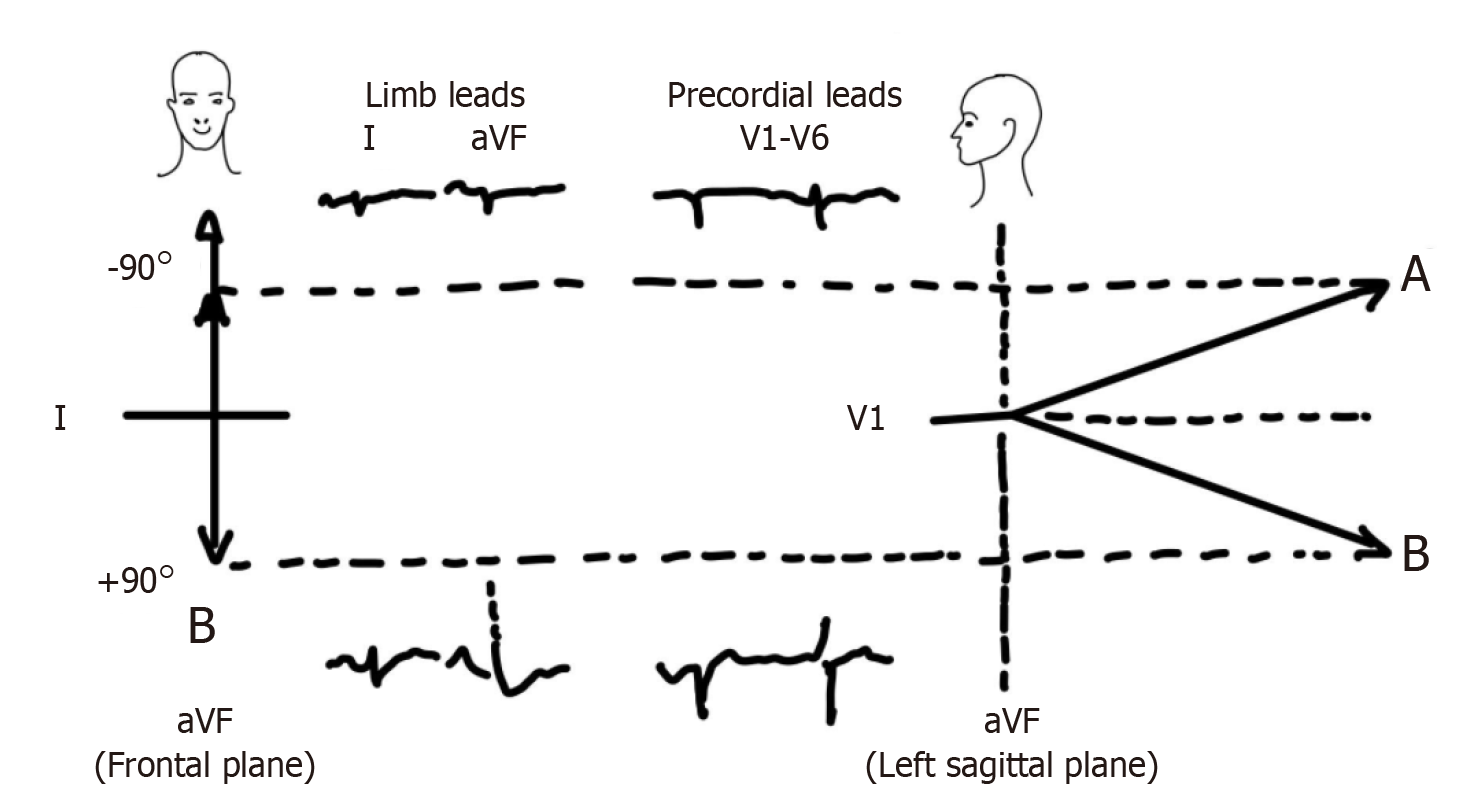
Although the majority of patients with chronic lung disease have rightward deviation of frontal QRS axis, some patients may exhibit significant left axis deviation (-80° to -90°) or “indeterminate” axis in the absence of significant left ventricular disease or old myocardial infarction[2,34]. When viewed in the horizontal plane, it becomes apparent that this is due to the posteriorly directed ventricular activation and these axes are in fact not very different from an axis of +80° or +90°, as illustrated in the Figure 8[2]. This has been referred to as “pseudo left axis deviation” because left anterior fascicular block and coronary disease are usually not present[35,36].
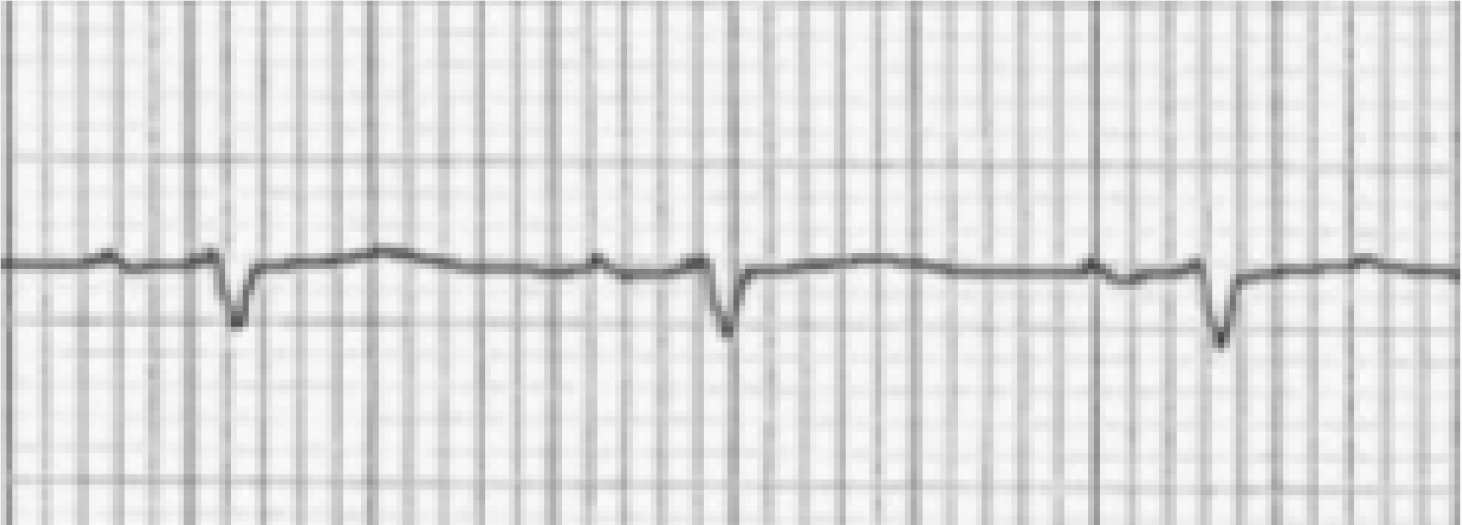
The presence of an isoelectric P wave, QRS amplitude < 1.5 mm, and T wave amplitude < 0.5 mm in lead I is usually referred to as “nearly isoelectric lead I” sign, which when present is highly indicative of underlying COPD[15,35,36]. A schematic illustration is provided in Figure 9.
T wave changes in emphysema have not been extensively studied. One study conducted in the 1940s pointed out some T wave changes in a series of patients with cor pulmonale[4]. A negative T wave was found in 59% of cases in lead V1 and in 46% in leads V1 and V2, while it was usually positive in leads V3-V6. These negative T waves (Figure 4) were thought to be related to the position of the heart and not entirely to RVH because of the low incidence of delayed intrinsic deflection accompanying such negative T waves[4]. In the inferior limb leads, the RS-T segment frequently (66.6%) showed a negative displacement and was rarely positive. In leads III and aVF, diphasic T wave was more often seen (48%) than negative T waves (which can also be seen in normal hearts, 16%), the significance of which was not clear, but could have been related to heart position as well.
In advanced COPD, the presence of tall right precordial R waves on the ECG are indicators of progression of RVH and pulmonary hypertension[34]. This is especially true if they are accompanied by T wave inversions in the same leads (Figure 4). Also, progression of RVH is typically associated with accentuation of right deviation of frontal plane P and QRS axes, an increased voltage of P wave in the inferior leads (P-pulmonale), small R waves and increased depth of S waves in leads V5 and V6 as well as negativity of T waves in leads V1 and V2[4].
A recent study showed that heart rate was significantly higher in patients with COPD compared with the healthy age-matched controls[35]. The frequency of arrhythmias in stable patients with COPD has been studied in some patients enrolled in nocturnal oxygen therapy trial group using 24-h ambulatory ECG monitoring[37]. The results suggested that both ventricular and supraventricular premature beats (including bigeminy, multiform premature ventricular contractions, runs of ventricular tachycardia) were frequent in patients with COPD. In addition, sinus tachycardia and supraventricular tachycardia including multifocal atrial tachycardia were noted in 38% and 69% of patients respectively[38]. Interestingly, history of coronary artery disease, increased sinus heart rate and decreased maximum workload were found to be predictors of death, rather than the presence of arrhythmias[38-40]. Multifocal atrial tachycardia may be noted in cases with significant underlying lung disease, particularly during COPD exacerbation[34].
The 12-lead ECG can be extremely valuable to the clinician in pointing towards undiagnosed COPD. A vertical frontal plane P wave axis is an extremely helpful electrocardiographic finding of COPD and appears to be highly sensitive and specific when used as a lone criterion for diagnosis. It has also been shown to correlate strongly with the severity of COPD as measured by spirometric and the CT criteria. Other noted abnormalities include increased P wave amplitude in inferior leads (P-pulmonale and Gothic P waves), increased P terminal force in V1, depression of PR segment, short QRS duration, rightward and posterior QRS axis, S1S2S3 sign, lead I sign and signs of RVH. These findings are less sensitive and specific but substantiate the diagnosis when present in conjunction with vertical P wave axis in frontal plane. All these changes appear to result from more vertical orientation of the heart due to depression of the diaphragm as well as clockwise and posterior rotation along its horizontal axis.
Manuscript source: Unsolicited manuscript
Specialty type: Cardiac and Cardiovascular Systems
Country/Territory of origin: United States
Peer-review report’s scientific quality classification
Grade A (Excellent): 0
Grade B (Very good): 0
Grade C (Good): C
Grade D (Fair): 0
Grade E (Poor): 0
P-Reviewer: Yamamoto H S-Editor: Chang KL L-Editor: A P-Editor: Wang LYT
| 1. | Miniño AM, Murphy SL, Xu J, Kochanek KD. Deaths: final data for 2008. Natl Vital Stat Rep. 2011;59:1-126. [PubMed] |
| 2. | SPODICK DH. Electrocardiographic studies in pulmonary disease. I. Electrocardiographic abnormalities in diffuse lung disease. Circulation. 1959;20:1067-1072. [RCA] [PubMed] [DOI] [Full Text] [Cited by in Crossref: 53] [Cited by in RCA: 56] [Article Influence: 0.8] [Reference Citation Analysis (0)] |
| 3. | Sodi-Pallares D. New Bases of Electrocardiography. Philadelphia: CV Mosby, 1956. |
| 4. | Zuckermann R, Cabrera CE. Electrocardiogram in chronic cor pulmonale. Am Heart J. 1948;35:421-437. [RCA] [PubMed] [DOI] [Full Text] [Cited by in Crossref: 74] [Cited by in RCA: 75] [Article Influence: 1.0] [Reference Citation Analysis (0)] |
| 5. | Chhabra L, Sareen P, Gandagule A, Spodick DH. Visual computed tomographic scoring of emphysema and its correlation with its diagnostic electrocardiographic sign: the frontal P vector. J Electrocardiol. 2012;45:136-140. [RCA] [PubMed] [DOI] [Full Text] [Cited by in Crossref: 4] [Cited by in RCA: 5] [Article Influence: 0.4] [Reference Citation Analysis (0)] |
| 6. | Shah NS, Velury S, Mascarenhas D, Spodick DH. Electrocardiographic features of restrictive pulmonary disease, and comparison with those of obstructive pulmonary disease. Am J Cardiol. 1992;70:394-395. [RCA] [PubMed] [DOI] [Full Text] [Cited by in Crossref: 7] [Cited by in RCA: 7] [Article Influence: 0.2] [Reference Citation Analysis (0)] |
| 7. | Thomas AJ, Apiyasawat S, Spodick DH. Electrocardiographic detection of emphysema. Am J Cardiol. 2011;107:1090-1092. [RCA] [PubMed] [DOI] [Full Text] [Cited by in Crossref: 24] [Cited by in RCA: 26] [Article Influence: 1.9] [Reference Citation Analysis (0)] |
| 8. | Tandon MK. Correlations of electrocardiographic features with airway obstruction in chronic bronchitis. Chest. 1973;63:146-148. [RCA] [PubMed] [DOI] [Full Text] [Cited by in Crossref: 8] [Cited by in RCA: 8] [Article Influence: 0.2] [Reference Citation Analysis (0)] |
| 9. | Ikeda K, Kubota I, Takahashi K, Yasui S. P-wave changes in obstructive and restrictive lung diseases. J Electrocardiol. 1985;18:233-238. [RCA] [PubMed] [DOI] [Full Text] [Cited by in Crossref: 8] [Cited by in RCA: 8] [Article Influence: 0.2] [Reference Citation Analysis (0)] |
| 10. | Calatayud JB, Abad JM, Khoi NB, Stanbro WW, Silver HM. P-wave changes in chronic obstructive pulmonary disease. Am Heart J. 1970;79:444-453. [RCA] [PubMed] [DOI] [Full Text] [Cited by in Crossref: 29] [Cited by in RCA: 29] [Article Influence: 0.5] [Reference Citation Analysis (0)] |
| 11. | Selvester RH, Rubin HB. New criteria for the electrocardiographic diagnosis of emphysema and cor pulmonale. Am Heart J. 1965;69:437-447. [RCA] [PubMed] [DOI] [Full Text] [Cited by in Crossref: 60] [Cited by in RCA: 60] [Article Influence: 1.0] [Reference Citation Analysis (0)] |
| 12. | SPODICK DH. Electrocardiographic studies in pulmonary disease. II. Establishment of criteria for the electrocardiographic inference of diffuse lung diseases. Circulation. 1959;20:1073-1074. [RCA] [PubMed] [DOI] [Full Text] [Cited by in Crossref: 33] [Cited by in RCA: 36] [Article Influence: 0.5] [Reference Citation Analysis (0)] |
| 13. | Bajaj R, Chhabra L, Basheer Z, Spodick DH. Optimal electrocardiographic limb lead set for rapid emphysema screening. Int J Chron Obstruct Pulmon Dis. 2013;8:41-44. [RCA] [PubMed] [DOI] [Full Text] [Full Text (PDF)] [Cited by in Crossref: 1] [Cited by in RCA: 2] [Article Influence: 0.2] [Reference Citation Analysis (0)] |
| 14. | Baljepally R, Spodick DH. Electrocardiographic screening for emphysema: the frontal plane P axis. Clin Cardiol. 1999;22:226-228. [RCA] [PubMed] [DOI] [Full Text] [Cited by in Crossref: 22] [Cited by in RCA: 21] [Article Influence: 0.8] [Reference Citation Analysis (0)] |
| 15. | Kamper D, Chou TC, Fowler NO, Witt RL, Bloomfield S. The reliability of electrocardiographic criteria of chronic obstructive lung disease. Am Heart J. 1970;80:445-452. [RCA] [PubMed] [DOI] [Full Text] [Cited by in Crossref: 15] [Cited by in RCA: 16] [Article Influence: 0.3] [Reference Citation Analysis (0)] |
| 16. | Shah NS, Koller SM, Janower ML, Spodick DH. Diaphragm levels as determinants of P axis in restrictive vs obstructive pulmonary disease. Chest. 1995;107:697-700. [RCA] [PubMed] [DOI] [Full Text] [Cited by in Crossref: 20] [Cited by in RCA: 22] [Article Influence: 0.7] [Reference Citation Analysis (0)] |
| 17. | Lanjewar SS, Chhabra L, Chaubey VK, Joshi S, Kulkarni G, Kothagundla C, Kaul S, Spodick DH. Diagnostic electrocardiographic dyad criteria of emphysema in left ventricular hypertrophy. Int J Chron Obstruct Pulmon Dis. 2013;8:591-594. [RCA] [PubMed] [DOI] [Full Text] [Full Text (PDF)] [Cited by in Crossref: 1] [Cited by in RCA: 1] [Article Influence: 0.1] [Reference Citation Analysis (0)] |
| 18. | Maeda S, Katsura H, Chida K, Imai T, Kuboki K, Watanabe C, Kida K, Ohkawa S, Matsushita S, Ueda K. Lack of correlation between P pulmonale and right atrial overload in chronic obstructive airways disease. Br Heart J. 1991;65:132-136. [RCA] [PubMed] [DOI] [Full Text] [Cited by in Crossref: 12] [Cited by in RCA: 13] [Article Influence: 0.4] [Reference Citation Analysis (0)] |
| 19. | Chhabra L, Spodick DH. Transient Super-Himalayan P-waves in severe pulmonary emphysema. J Electrocardiol. 2012;45:26-27. [RCA] [PubMed] [DOI] [Full Text] [Cited by in Crossref: 5] [Cited by in RCA: 7] [Article Influence: 0.5] [Reference Citation Analysis (0)] |
| 20. | Hayashi H, Miyamoto A, Kawaguchi T, Naiki N, Xue JQ, Matsumoto T, Murakami Y, Horie M. P-pulmonale and the development of atrial fibrillation. Circ J. 2014;78:329-337. [RCA] [PubMed] [DOI] [Full Text] [Cited by in Crossref: 10] [Cited by in RCA: 12] [Article Influence: 1.0] [Reference Citation Analysis (0)] |
| 21. | Kishimoto C, Tamaru K, Kuwahara H. Tall P waves associated with severe hypokalemia and combined electrolyte depletion. J Electrocardiol. 2014;47:93-94. [RCA] [PubMed] [DOI] [Full Text] [Cited by in Crossref: 8] [Cited by in RCA: 7] [Article Influence: 0.6] [Reference Citation Analysis (0)] |
| 22. | Conde D, Seoane L, Gysel M, Mitrione S, Bayés de Luna A, Baranchuk A. Bayés' syndrome: the association between interatrial block and supraventricular arrhythmias. Expert Rev Cardiovasc Ther. 2015;13:541-550. [RCA] [PubMed] [DOI] [Full Text] [Cited by in Crossref: 29] [Cited by in RCA: 31] [Article Influence: 3.1] [Reference Citation Analysis (0)] |
| 23. | Surawicz B, Knilans T. Atrial abnormalities. In: Chou’s Electrocardiography in Clinical Practice: Adult and Pediatric. 6th ed. Philadelphia: Saunders Elsevier, 2008: 33-36. |
| 24. | Bayés de Luna A, Platonov P, Cosio FG, Cygankiewicz I, Pastore C, Baranowski R, Bayés-Genis A, Guindo J, Viñolas X, Garcia-Niebla J, Barbosa R, Stern S, Spodick D. Interatrial blocks. A separate entity from left atrial enlargement: a consensus report. J Electrocardiol. 2012;45:445-451. [RCA] [PubMed] [DOI] [Full Text] [Cited by in Crossref: 224] [Cited by in RCA: 265] [Article Influence: 22.1] [Reference Citation Analysis (0)] |
| 25. | Lynch P, Webb-Peploe MM. The P terminal vector in lead V1 of the electrocardiogram in cor pulmonale. J Electrocardiol. 1982;15:205-208. [RCA] [PubMed] [DOI] [Full Text] [Cited by in Crossref: 3] [Cited by in RCA: 3] [Article Influence: 0.1] [Reference Citation Analysis (0)] |
| 26. | Chhabra L, Chaubey VK, Kothagundla C, Bajaj R, Kaul S, Spodick DH. P-wave indices in patients with pulmonary emphysema: do P-terminal force and interatrial block have confounding effects? Int J Chron Obstruct Pulmon Dis. 2013;8:245-250. [RCA] [PubMed] [DOI] [Full Text] [Full Text (PDF)] [Cited by in Crossref: 11] [Cited by in RCA: 14] [Article Influence: 1.2] [Reference Citation Analysis (0)] |
| 27. | Alkukhun L, Baumgartner M, Budev M, Dweik RA, Tonelli AR. Electrocardiographic differences between COPD patients evaluated for lung transplantation with and without pulmonary hypertension. COPD. 2014;11:670-680. [RCA] [PubMed] [DOI] [Full Text] [Cited by in Crossref: 7] [Cited by in RCA: 7] [Article Influence: 0.6] [Reference Citation Analysis (0)] |
| 28. | Tonelli AR, Baumgartner M, Alkukhun L, Minai OA, Dweik RA. Electrocardiography at diagnosis and close to the time of death in pulmonary arterial hypertension. Ann Noninvasive Electrocardiol. 2014;19:258-265. [RCA] [PubMed] [DOI] [Full Text] [Cited by in Crossref: 24] [Cited by in RCA: 32] [Article Influence: 2.7] [Reference Citation Analysis (0)] |
| 29. | Zambrano SS, Moussavi MS, Spodick DH. QRS duration in chronic obstructive lung disease. J Electrocardiol. 1974;7:35-36. [RCA] [PubMed] [DOI] [Full Text] [Cited by in Crossref: 12] [Cited by in RCA: 12] [Article Influence: 0.2] [Reference Citation Analysis (0)] |
| 30. | Foraker AG, Bedrossian CW, Anderson AE Jr. Myocardial dimensions and proportions in pulmonary emphysema. Arch Pathol. 1970;90:344-347. [PubMed] |
| 31. | Tahara Y, Mizuno H, Ono A, Ishikawa K. Evaluation of the electrocardiographic transitional zone by cardiac computed tomography. J Electrocardiol. 1991;24:239-245. [RCA] [PubMed] [DOI] [Full Text] [Cited by in Crossref: 22] [Cited by in RCA: 28] [Article Influence: 0.8] [Reference Citation Analysis (0)] |
| 32. | Mittal SR, Srivastava P. Differentiation of poor R wave progression of old anteroseptal myocardial infarction from that due to emphysema. Int J Cardiol. 1986;13:92-94. [RCA] [PubMed] [DOI] [Full Text] [Cited by in Crossref: 6] [Cited by in RCA: 6] [Article Influence: 0.2] [Reference Citation Analysis (0)] |
| 33. | Yamamoto H, Satomi K, Aizawa Y. Electrocardiographic manifestations in a large right-sided pneumothorax. BMC Pulm Med. 2021;21:101. [RCA] [PubMed] [DOI] [Full Text] [Full Text (PDF)] [Cited by in Crossref: 3] [Cited by in RCA: 3] [Article Influence: 0.8] [Reference Citation Analysis (0)] |
| 34. | Silver HM, Calatayud JB. Evaluation of QRS criteria in patients with chronic obstructive pulmonary disease. Chest. 1971;59:153-159. [RCA] [PubMed] [DOI] [Full Text] [Cited by in Crossref: 17] [Cited by in RCA: 18] [Article Influence: 0.3] [Reference Citation Analysis (0)] |
| 35. | Rodman DM, Lowenstein SR, Rodman T. The electrocardiogram in chronic obstructive pulmonary disease. J Emerg Med. 1990;8:607-615. [RCA] [PubMed] [DOI] [Full Text] [Cited by in Crossref: 20] [Cited by in RCA: 22] [Article Influence: 0.6] [Reference Citation Analysis (0)] |
| 36. | Larssen MS, Steine K, Hilde JM, Skjørten I, Hodnesdal C, Liestøl K, Gjesdal K. Mechanisms of ECG signs in chronic obstructive pulmonary disease. Open Heart. 2017;4:e000552. [RCA] [PubMed] [DOI] [Full Text] [Full Text (PDF)] [Cited by in Crossref: 10] [Cited by in RCA: 10] [Article Influence: 1.3] [Reference Citation Analysis (0)] |
| 37. | Schaeffer JW, Pryor R. Pseudo left axis deviation and the S1S2S3 syndrome in chronic airway obstruction. Chest. 1977;71:453-455. [RCA] [PubMed] [DOI] [Full Text] [Cited by in Crossref: 5] [Cited by in RCA: 6] [Article Influence: 0.1] [Reference Citation Analysis (0)] |
| 38. | Shih HT, Webb CR, Conway WA, Peterson E, Tilley B, Goldstein S. Frequency and significance of cardiac arrhythmias in chronic obstructive lung disease. Chest. 1988;94:44-48. [RCA] [PubMed] [DOI] [Full Text] [Cited by in Crossref: 93] [Cited by in RCA: 81] [Article Influence: 2.2] [Reference Citation Analysis (0)] |
| 39. | Yanowitz FG. Introduction to ECG interpretation. 10th ed. Salt Lake City: Spenser S. Eccles Health Sciences Library, 2017. |
| 40. | Burns E. ECG in Chronic Obstructive Pulmonary Disease [cited Sep 6, 2020]. Available from: https://litfl.com/ecg-in-chronic-obstructive-pulmonary-disease/. |


