Copyright
©The Author(s) 2017.
World J Cardiol. Apr 26, 2017; 9(4): 363-370
Published online Apr 26, 2017. doi: 10.4330/wjc.v9.i4.363
Published online Apr 26, 2017. doi: 10.4330/wjc.v9.i4.363
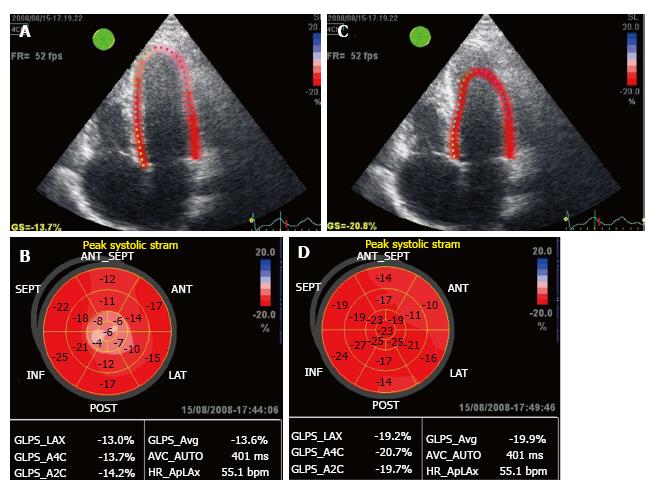
Figure 1 Apical 4-chamber view of a patient with apical hypertrophic cardiomyopathy.
A: Midwall parametric image; B: Midwall bull’s eye with a mean global longitudinal peak systolic strain (GLPS_Avg) of -13.6%; C: Endocardial parametric image; D: Endocardial bull’s eye with a GLPS_Avg of -19.9%. Red: Normal strain; Pink: Reduced strain; Light pink: Severely reduced strain.
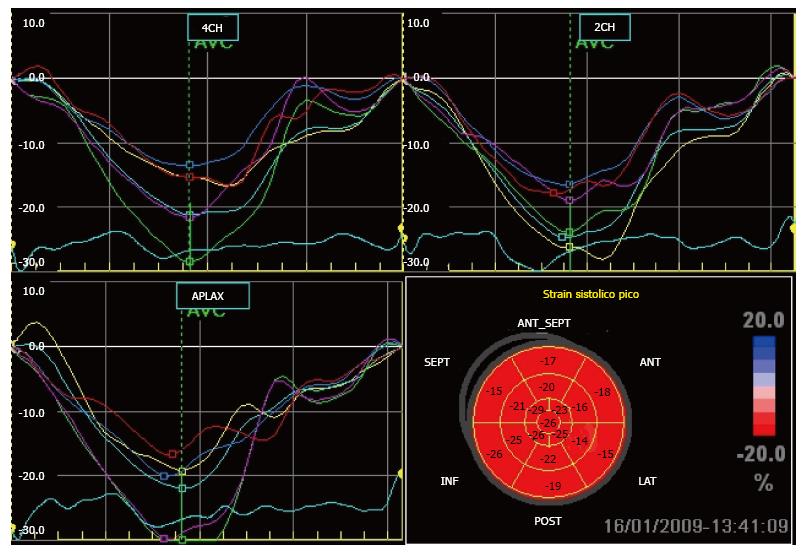
Figure 2 Curves of global longitudinal peak systolic strain from each apical view in a normal subject.
Note that in most segments, peak strain occurs during aortic closure. 4CH: Apical 4-chamber; 2CH: Apical 2-chamber; APLAX: Apical long-axis (apical 3-chamber).
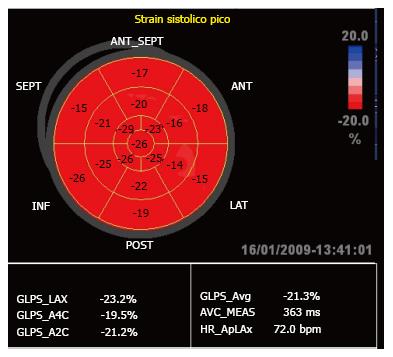
Figure 3 Bull’s eye image of the same normal subject shown in Figure 2, showing percent strain value in the 17 segments analyzed.
Mean value of the peak overall systolic strain is also reported (GLPS_Avg: -21.8%) as well as that of each of the 3 apical views (GLPS_LAX: -20.1%, GLPS_A4C: -23.3% and GLPS_A2C: -22%).
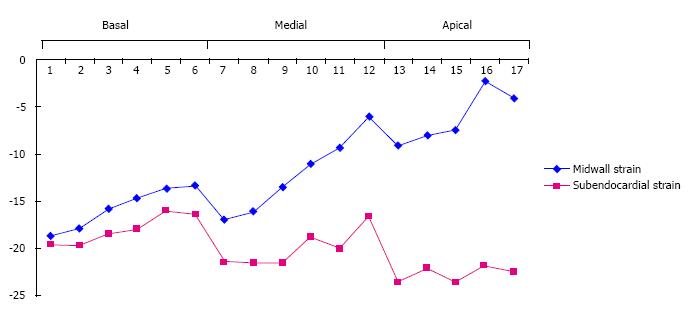
Figure 4 The dotted line shows the mean global longitudinal peak systolic strain in the 20 patients.
Midwall strain is shown in blue and endocardial strain is shown in red. In both lines, each point illustrates the strain value in each of the 17 segments (Basal segments: segments 1-6; Medial segments: segments 7-12; Apical segments: segments 13-17).
- Citation: Saccheri MC, Cianciulli TF, Morita LA, Méndez RJ, Beck MA, Guerra JE, Cozzarin A, Puente LJ, Balletti LR, Lax JA. Speckle tracking echocardiography to assess regional ventricular function in patients with apical hypertrophic cardiomyopathy. World J Cardiol 2017; 9(4): 363-370
- URL: https://www.wjgnet.com/1949-8462/full/v9/i4/363.htm
- DOI: https://dx.doi.org/10.4330/wjc.v9.i4.363


