Copyright
©The Author(s) 2017.
World J Cardiol. Dec 26, 2017; 9(12): 822-829
Published online Dec 26, 2017. doi: 10.4330/wjc.v9.i12.822
Published online Dec 26, 2017. doi: 10.4330/wjc.v9.i12.822
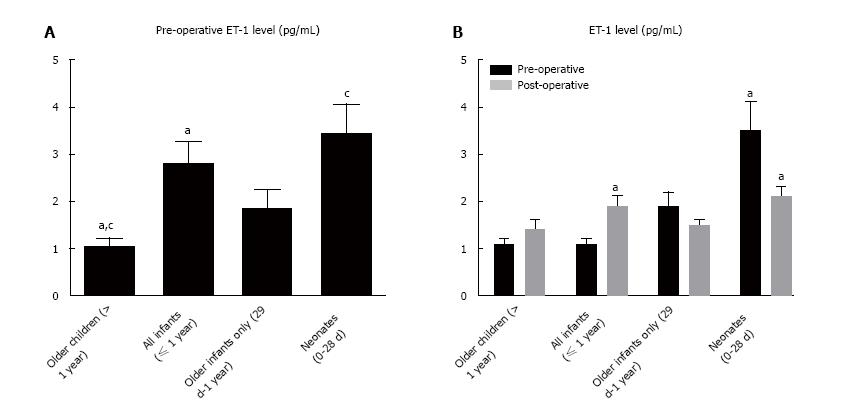
Figure 1 Serum endothelin-1 concentration.
A: Pre-operative ET-1 concentration by age group; B: Comparison between pre-operative and post-operative levels for each age group. a,cP < 0.05. Scale bars represent standard deviation. ET-1: Endothelin-1.
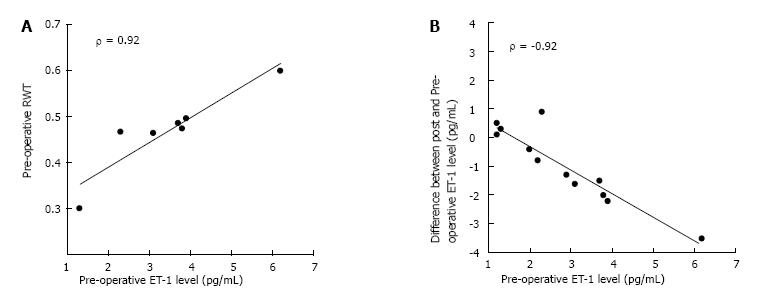
Figure 2 Pre-Operative Endothelin-1 as a predictor.
A: Correlation between pre-operative ET-1 concentration and post-operative RWT in the subset cohort of neonatal patients; B: Correlation between pre-operative ET-1 concentration and change in level from pre-operative to post-operative sample in the full cohort of patients. Points represent individual patients. ET-1: Endothelin-1; RWT: Relative wall thickness.
- Citation: Frank BS, Urban TT, Tong S, Cassidy C, Mitchell MB, Nichols CS, Davidson JA. Endothelin-1 activation in pediatric patients undergoing surgical coarctation of the aorta repair. World J Cardiol 2017; 9(12): 822-829
- URL: https://www.wjgnet.com/1949-8462/full/v9/i12/822.htm
- DOI: https://dx.doi.org/10.4330/wjc.v9.i12.822


