Copyright
©The Author(s) 2017.
World J Cardiol. Dec 26, 2017; 9(12): 813-821
Published online Dec 26, 2017. doi: 10.4330/wjc.v9.i12.813
Published online Dec 26, 2017. doi: 10.4330/wjc.v9.i12.813
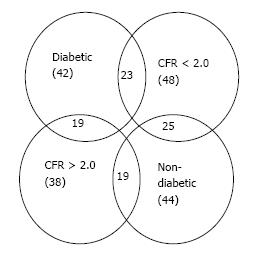
Figure 1 Overlap of the various patient subgroups.
The graphic highlights the intersection of the diabetic and CFR < 2.0 patient subgroups as well as the overlap between other subgroups. CFR: Coronary flow reserve.
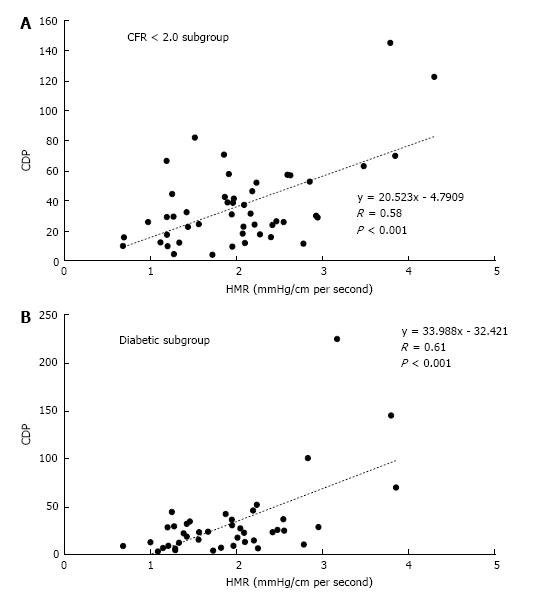
Figure 2 Correlation of pressure drop coefficient with hyperemic microvascular resistance.
A: The linear regression performed between CDP and HMR for the CFR < 2.0 subgroup. The equation, R-value and the P-value are provided for the comparison; B: Similar regression performed for the diabetic subgroup. CFR: Coronary flow reserve; CDP: Pressure drop coefficient; HMR: Hyperemic microvascular resistance.
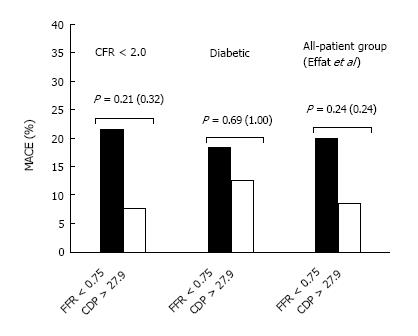
Figure 3 Comparison of %MACE between fractional flow reserve < 0.
75 and pressure drop coefficient > 27.9 groups for the coronary flow reserve < 2.0 subgroup and diabetic subgroup. These patient subgroups are obtained from the complete patient group analyzed in Effat et al[22]. The P-values are provided for the χ2 test, and the P-values for the Fischer’s exact test are provided in parentheses. CDP: Pressure drop coefficient; FFR: Fractional flow reserve.
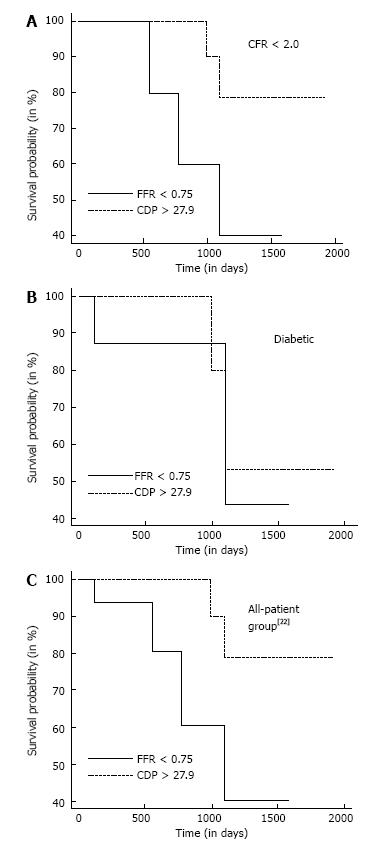
Figure 4 Comparison of Kaplan - Meier survival curves between fractional flow reserve < 0.
75 and pressure drop coefficient > 27.9 groups. A: CFR < 2.0 subgroup; B: Diabetic subgroup; C: Complete patient group in Effat et al[22]. CFR: Coronary flow reserve; CDP: Pressure drop coefficient; FFR: Fractional flow reserve.
- Citation: Hebbar UU, Effat MA, Peelukhana SV, Arif I, Banerjee RK. Delineation of epicardial stenosis in patients with microvascular disease using pressure drop coefficient: A pilot outcome study. World J Cardiol 2017; 9(12): 813-821
- URL: https://www.wjgnet.com/1949-8462/full/v9/i12/813.htm
- DOI: https://dx.doi.org/10.4330/wjc.v9.i12.813


