Copyright
©The Author(s) 2016.
World J Cardiol. Sep 26, 2016; 8(9): 520-533
Published online Sep 26, 2016. doi: 10.4330/wjc.v8.i9.520
Published online Sep 26, 2016. doi: 10.4330/wjc.v8.i9.520
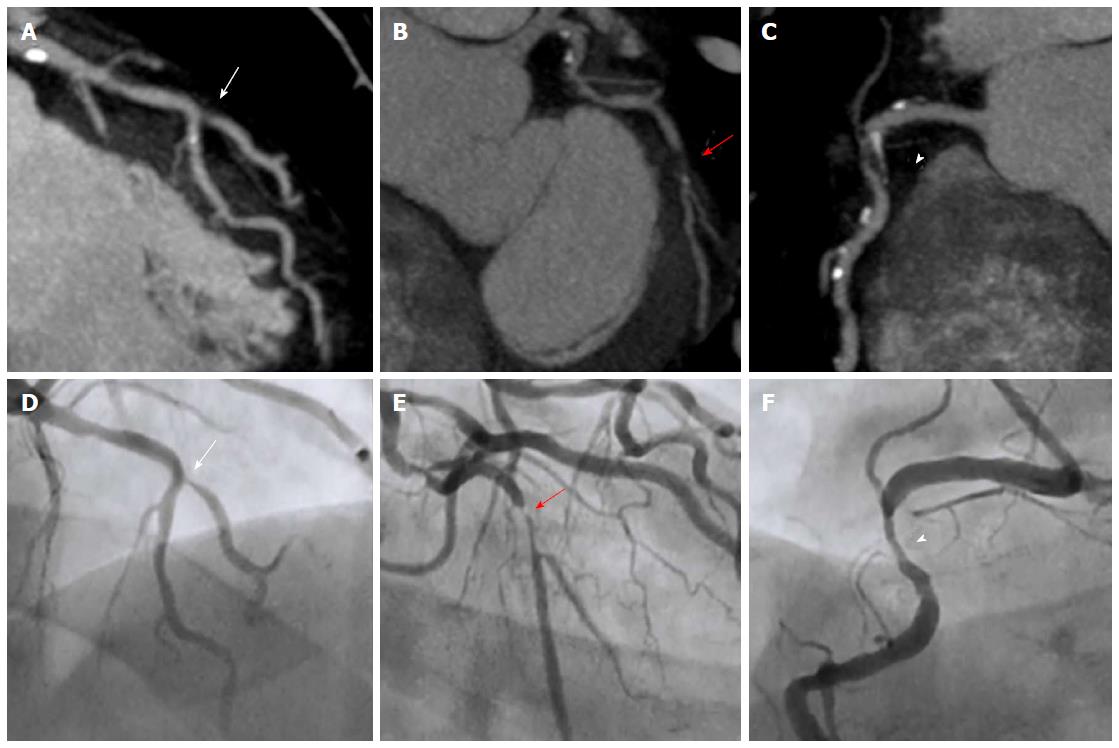
Figure 1 Coronary computed tomography stenosis evaluation compared with invasive coronary angiography.
Case of a patient with 3-vessel disease. Maximum intensity projection CCT findings are shown in the upper row with the corresponding ICA projections in the lower row. (A) demonstrates a significant stenosis in the ostium of the diagonal branch (arrow) at the level of its take-off from the mid-LAD in both CCT and ICA (D); In (B) CCT shows a subtotal occlusion in the proximal LCx (red arrow) that corresponds to a critical lesion at the same level in ICA (E); In CCT image from (C) a mixed plaque is detected in proximal RCA causing a significant stenosis (arrowhead), as corroborated by ICA (F). CCT: Coronary computed tomography; ICA: Invasive coronary angiography; LAD: Left anterior descending coronary artery; LCx: Left circumflex coronary artery; RCA: Right coronary artery.
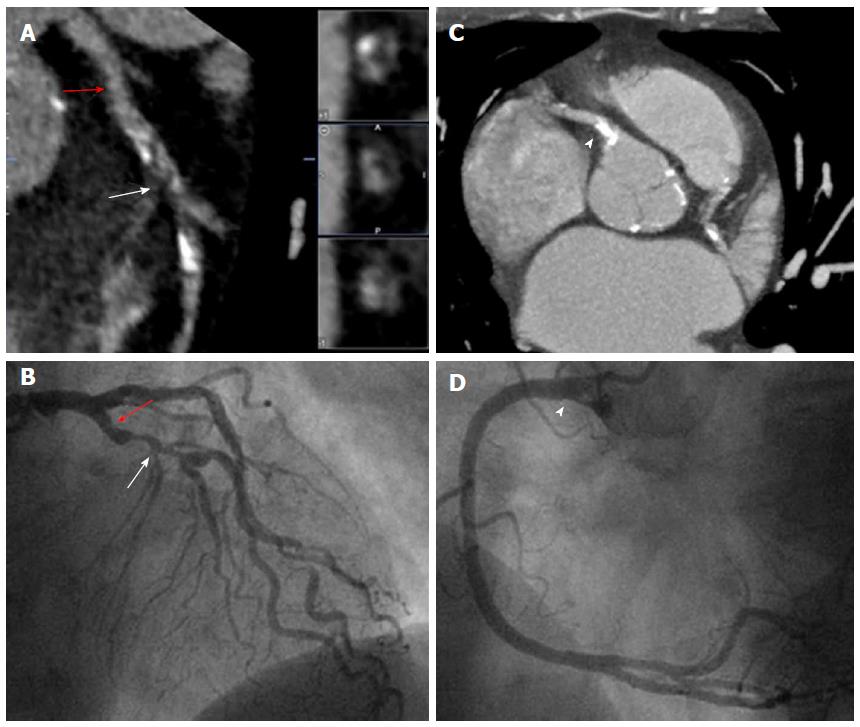
Figure 2 Coronary plaque categories by coronary computed tomography.
Patient with chest pain referred for CCT. A: LAD in multiplanar reconstruction with a mixed plaque in the mid segment (arrow) that causes significant stenosis confirmed in the ICA (B, arrow). Note that there is also a nonsignificant noncalcified plaque in the proximal segment (red arrow) that is barely seen in coronariography (B, red arrow); C: A maximum intensity projection that demonstrates a severely calcified plaque in the ostial RCA (arrowhead), which does not allow luminal stenosis evaluation. However, ICA (D) confirms the absence of significant stenosis at the same level (arrowhead). CCT: Coronary computed tomography; LAD: Left anterior descending coronary artery; ICA: Invasive coronary angiography; RCA: Right coronary artery.
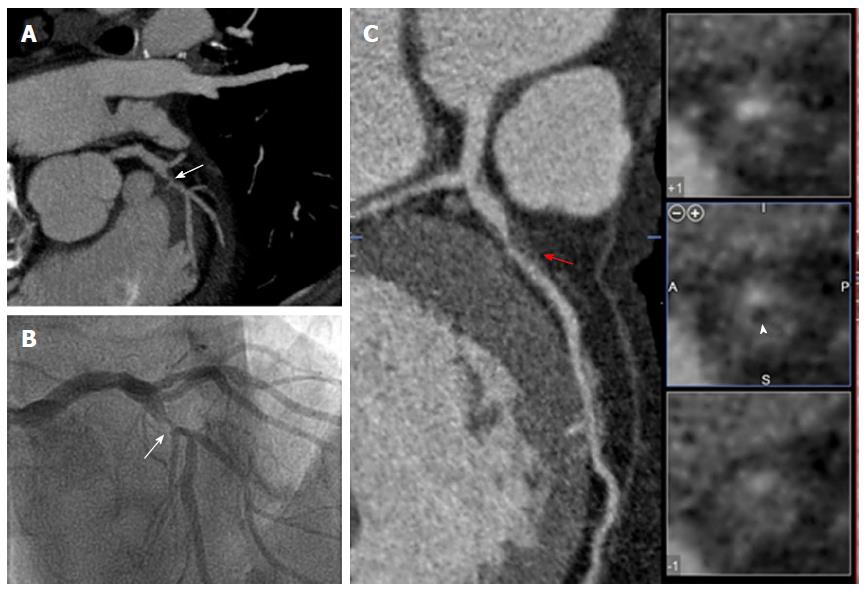
Figure 3 Vulnerable coronary plaque features by coronary computed tomography.
Patient with unstable angina who underwent CCT followed by ICA. A severe stenosis (arrows) in mid-LAD just before the origin of the second diagonal was detected in CCT (A) and subsequently confirmed by ICA (B); A detailed analysis of multiplanar reconstruction of CCT (C) revealed the presence of positive remodeling (red arrow) and low attenuation (arrow head) at the level of the culprit lesion, both signs associated with vulnerable coronary plaque. CCT: Coronary computed tomography; ICA: Invasive coronary angiography; LAD: Left anterior descending coronary artery.
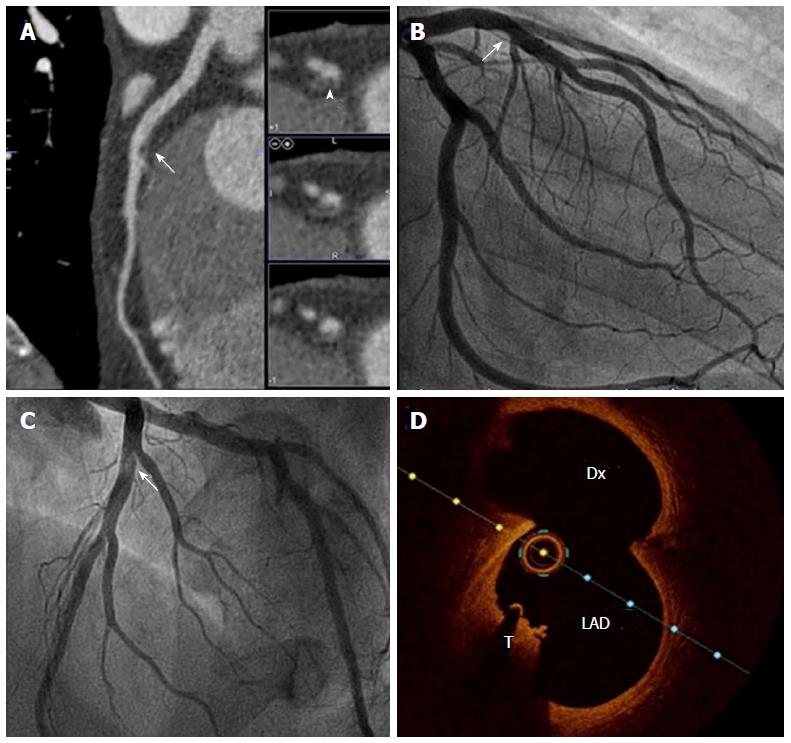
Figure 4 Coronary computed tomography characterization of plaque components.
Multimodal evaluation of a mid-LAD lesion in bifurcation with a Dx branch. A: CCT multiplanar reconstruction demonstrates a nonsignificant luminal narrowing in the mid LAD (arrow), and when short axis was evaluated the lesion fulfills noncalcified plaque features (arrowhead); B and C: ICA: The same nonobstructive lesion is observed in mid-LAD (arrow), which seems hyperlucent on LAO cranial projection (C); D: OCT confirms the presence of a red intracoronary thrombus (T) in the same location. CCT: Coronary computed tomography; LAD: Left anterior descending artery; Dx: Diagonal branch; ICA: Invasive coronary angiography; OCT: Optical coherence tomography.
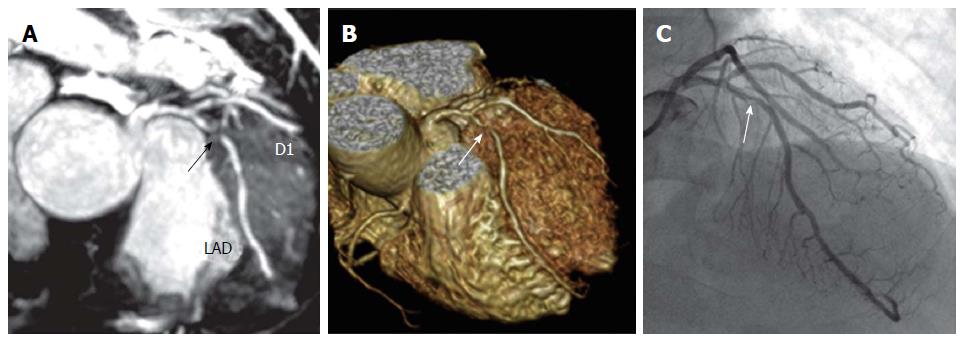
Figure 5 Unenhanced Whole-Heart coronary cardiac magnetic resonance angiography.
Correlation of unenhanced whole-heart coronary CMR angiography (A, maximum intensity projection image, and B, volume-rendered image) with invasive coronary angiography (C) in a in a 50-year-old male patient with chest pain on effort. Note the presence of significant stenosis in proximal LAD (arrows). Adapted with permisssion from Nagata et al[75]. LAD: Left anterior descending coronary artery; D1: First diagonal branch; CMR: Cardiac magnetic resonance.
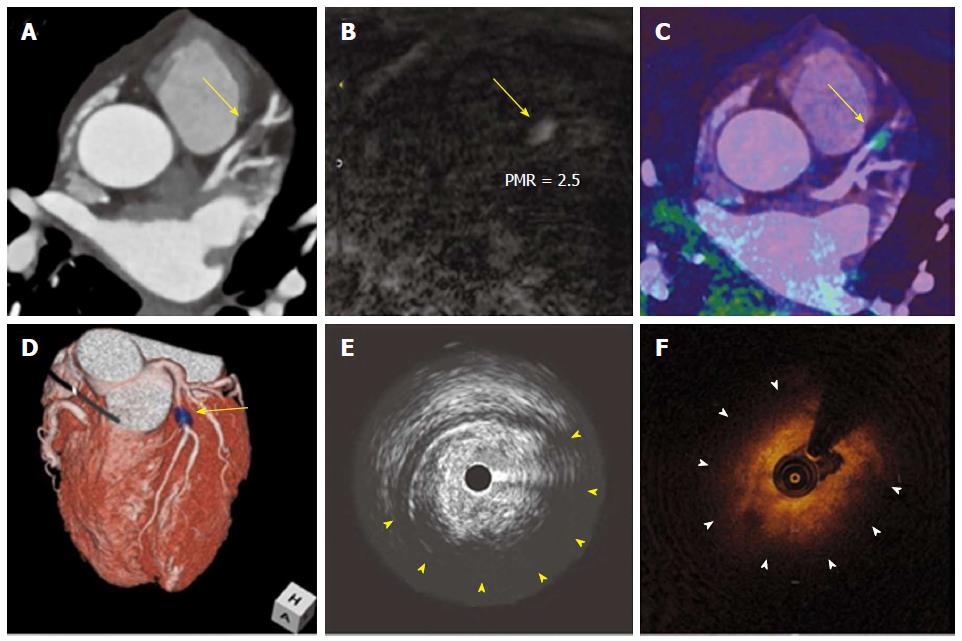
Figure 6 T1 hyperintense coronary plaques in cardiac magnetic resonance.
Noninvasive and invasive coronary imaging of a significant plaque in proximal LAD. CCTA (A) showed a noncalcified plaque in LAD causing significant stenosis. When noncontrast T1-weighted CMR imaging was performed (B) a hyperintense lesion was detected. Afterwards, CMR images were fused with CCTA (C and D) and this lesion was found to correspond with the previously described coronary stenosis. Interestingly, during the subsequent coronary angiography it showed a large lipid component in IVUS (E) as well as OCT (F). Adapted with permission from Asaumi et al[106]. LAD: Left anterior descending coronary artery; CCTA: Coronary computed tomography; CMR: Cardiac magnetic resonance; IVUS: Intravascular ultrasound; OCT: Optical coherence tomography; PMR: Plaque to myocardium signal intensity ratio.
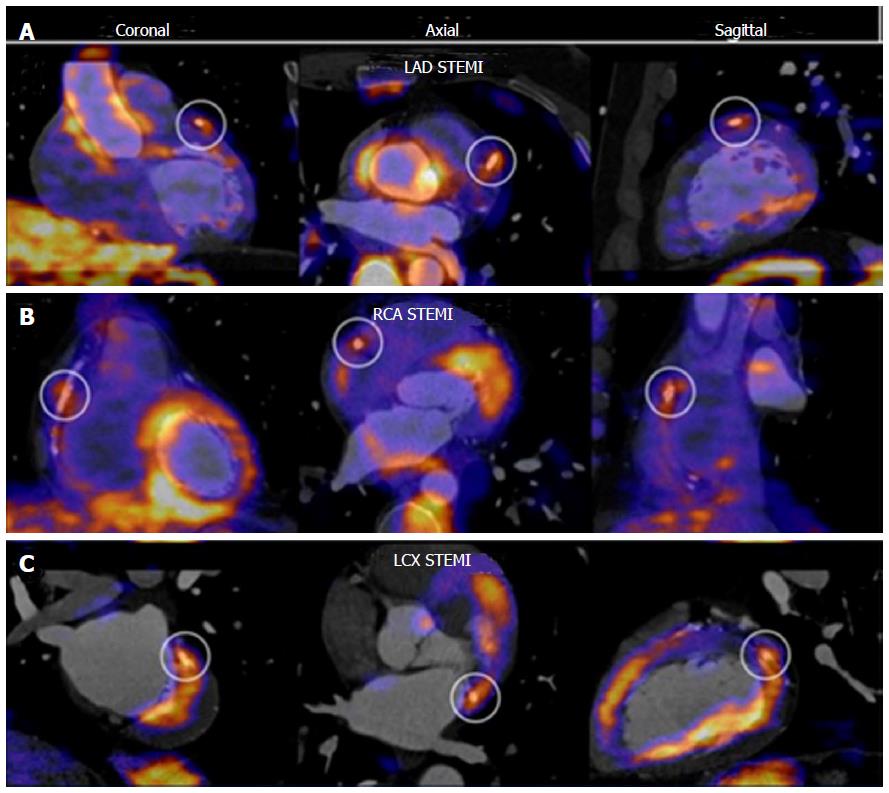
Figure 7 Fluorodeoxyglucose positron emission tomography of the coronary arteries.
PET CT fusion imaging in three cases of patients with STEMI. An increased 18F-FDG uptake at stent site is shown in different culprit vessels, from A to C: LAD, RCA and LCX. Adapted with permission from Cheng et al[107]. This research was originally published in JNM. ©by the Society of Nuclear Medicine and Molecular Imaging, Inc. FDG: Fluorodeoxyglucose; PET: Positron emission tomography; STEMI: ST elevation myocardial infarction; LAD: Left anterior descending coronary artery; RCA: Right coronary artery; LCX: Left circumflex coronary artery.
- Citation: Pozo E, Agudo-Quilez P, Rojas-González A, Alvarado T, Olivera MJ, Jiménez-Borreguero LJ, Alfonso F. Noninvasive diagnosis of vulnerable coronary plaque. World J Cardiol 2016; 8(9): 520-533
- URL: https://www.wjgnet.com/1949-8462/full/v8/i9/520.htm
- DOI: https://dx.doi.org/10.4330/wjc.v8.i9.520


