Copyright
©The Author(s) 2016.
World J Cardiol. Jul 26, 2016; 8(7): 413-424
Published online Jul 26, 2016. doi: 10.4330/wjc.v8.i7.413
Published online Jul 26, 2016. doi: 10.4330/wjc.v8.i7.413
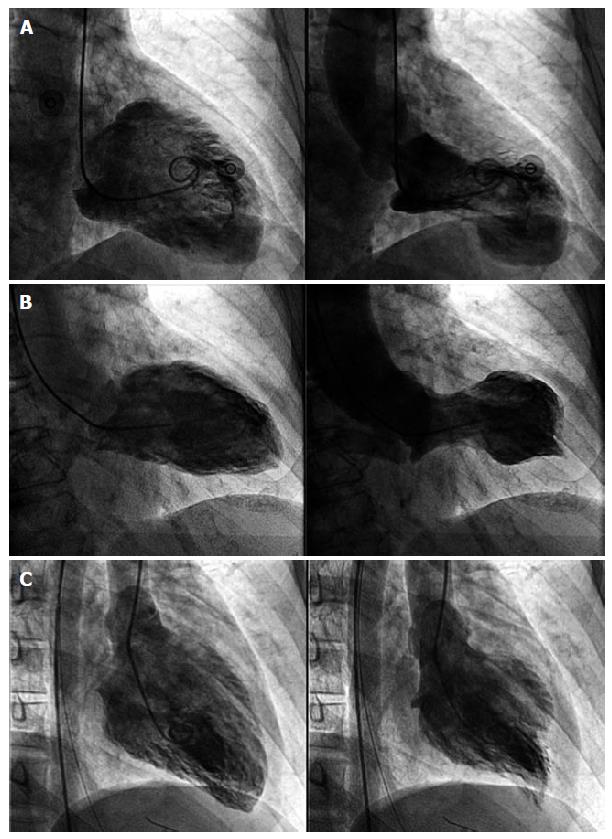
Figure 1 Left ventriculography showing different types of takotsubo cardiomyopathy.
A: Takotsubo cardiomyopathy (TTC) typical form. On systole the left ventricle presents akinesis of the apex and hyperkinesis of the basal segments; B: Mid-ventricular variant. On systole the mid-segments are akinetic while the apical and basal segments are normal; C: “Inverted TTC”. Basal and mid-segments are akinetic on systole while the apex is hyperkinetic.
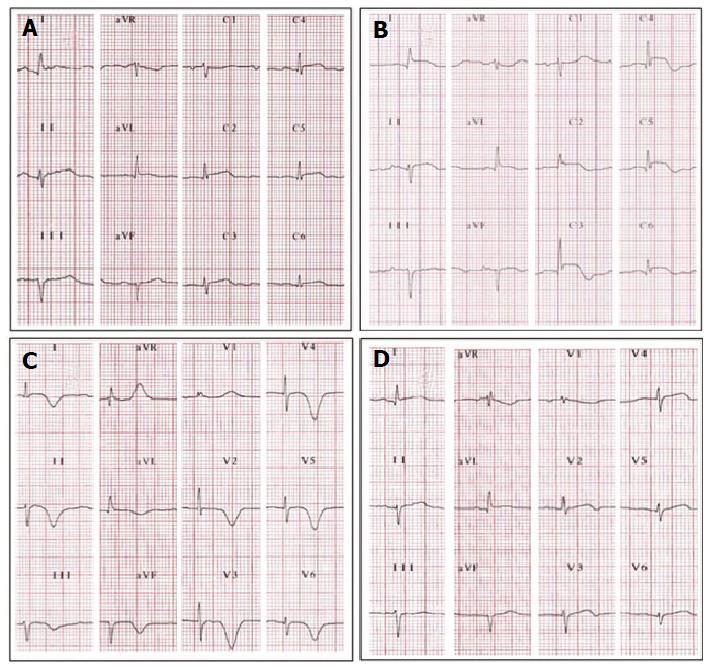
Figure 2 Electrocardiographic evolutionary changes in a 65-year-old woman with typical takotsubo cardiomyopathy.
A: Initial electrocardiographic (ECG) after 3 h of symptoms. There is diffuse ST-segment elevation (DI, aVL and all precordial leads except on V1); B: ECG after 24 h of symptoms. The ST-segment elevation seems to be more prominent. Note ST-segment depression on aVR. The T waves start to invert on leads with ST-segment elevation, except on V1 where there is a more prominent positive T wave; C: Third day. The ST-segment is almost normal. The T waves are now inverted, deep, wide and symmetrical on all leads except on aVR and V1 where they are positive. The corrected QT-interval is prolonged (520 milliseconds); D: ECG 3 wk later, outpatient. The T waves are almost normal and the QT-interval is not prolonged.
- Citation: Mejía-Rentería HD, Núñez-Gil IJ. Takotsubo syndrome: Advances in the understanding and management of an enigmatic stress cardiomyopathy. World J Cardiol 2016; 8(7): 413-424
- URL: https://www.wjgnet.com/1949-8462/full/v8/i7/413.htm
- DOI: https://dx.doi.org/10.4330/wjc.v8.i7.413


