Copyright
©The Author(s) 2016.
World J Cardiol. Apr 26, 2016; 8(4): 317-322
Published online Apr 26, 2016. doi: 10.4330/wjc.v8.i4.317
Published online Apr 26, 2016. doi: 10.4330/wjc.v8.i4.317
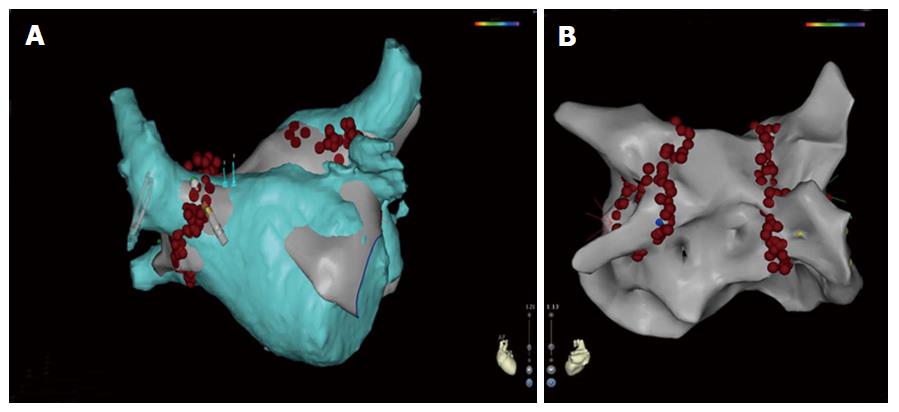
Figure 1 Carto screenshot during pulmonary veins isolation.
A: Anterior-posterior view showing CT image of left atrium integrated into the electroanatomic map (CT group). The ablation in this case was performed using the Smart Touch catheter. The tip of the Smart Touch catheter is shown with 3D vector; B: Posterior-anterior view showing electroanatomic mapping (EAM group) of left atrium with ablation points around pulmonary veins. EAM: Electroanatomic mapping; CT: Computed tomography; 3D: Three dimension.
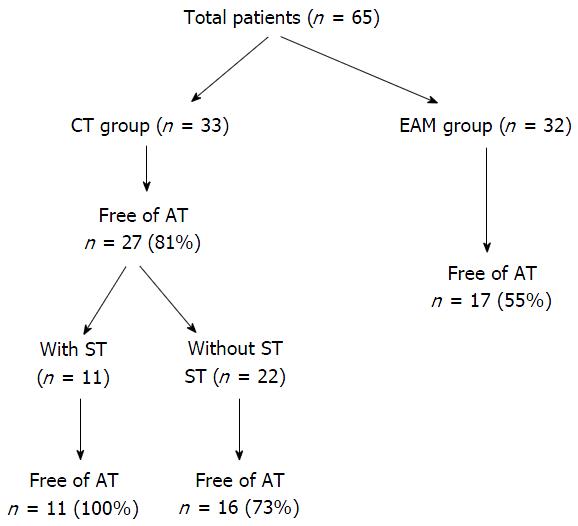
Figure 2 Flowchart reporting the different patient groups and the results.
ST: Smart touch; AT: Atrial tachyarrhythmia; EAM: Electroanatomic mapping; CT: Computed tomography.
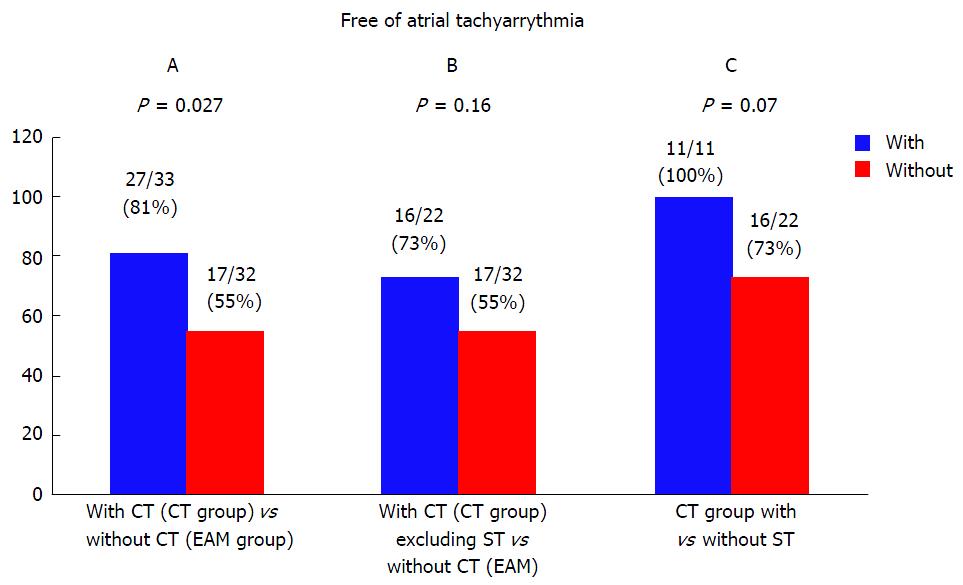
Figure 3 Free of atrial tachyarrhythmia during 24 mo.
A: Among CT group vs among electroanatomic group; B: Free of atrial tachyarrhythmia among CT group (excluding Smart Touch) vs among electroanatomic group; C: Free of atrial tachyarrhythmia among CT group with or without ST. ST: Smart touch; EAM: Electroanatomic mapping; CT: Computed tomography.
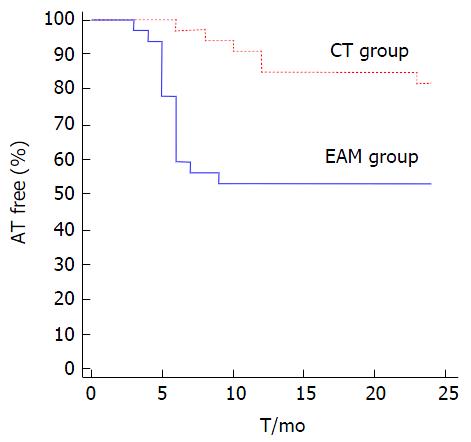
Figure 4 Kaplan-Meier estimate of recurrence atrial tachyarrhythmia during 3-24 mo after ablation for atrial fibrillation.
Free of atrial tachyarrhythmia was significantly higher among CT group compared to electroanatomic mapping group. AT: Atrial tachyarrhythmia; EAM: Electroanatomic mapping; CT: Computed tomography.
- Citation: Marai I, Suleiman M, Blich M, Lessick J, Abadi S, Boulos M. Impact of computed tomography image and contact force technology on catheter ablation for atrial fibrillation. World J Cardiol 2016; 8(4): 317-322
- URL: https://www.wjgnet.com/1949-8462/full/v8/i4/317.htm
- DOI: https://dx.doi.org/10.4330/wjc.v8.i4.317


