Copyright
©The Author(s) 2016.
World J Cardiol. Feb 26, 2016; 8(2): 146-162
Published online Feb 26, 2016. doi: 10.4330/wjc.v8.i2.146
Published online Feb 26, 2016. doi: 10.4330/wjc.v8.i2.146
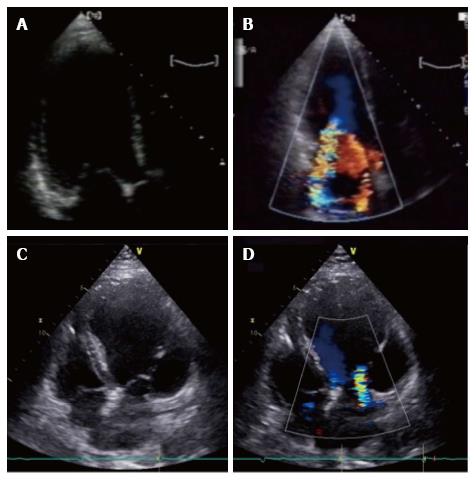
Figure 1 Asymmetric and symmetric tethering pattern.
A, B: Asymmetric tethering pattern. Typical “hockey stick” or ‘‘bent knee’’ configuration. MV coaptation point is moved posteriorly and the anterior leaflet coapts creating a ‘‘pseudo-prolapse’’ appearance with a large regurgitant jet oriented along the posterior wall of the left atrium; C: Symmetric tethering pattern. Both leaflets are apically dislocated and coapt at the same level into the ventricle; D: Color-Doppler shows large central jet.
Figure 2 Impaired leaflet coaptation can be enhanced by dyssynchronous contraction of left ventricle basal segments, that may cause a papillary muscles asynchronous contraction.
A: 2D radial strain of a papillary muscles short axis in a patient with functional MR; B: During systole, myocardial segments adjacent to postero-medial papillary muscles (red and blue segments) show negative radial strain values, whereas antero-lateral papillary muscles (light blue and green segments) show a positive strain values, resulting in a significant papillary dyssynchrony. 2D: 2 dimensional; MR: Magnetic resonance.
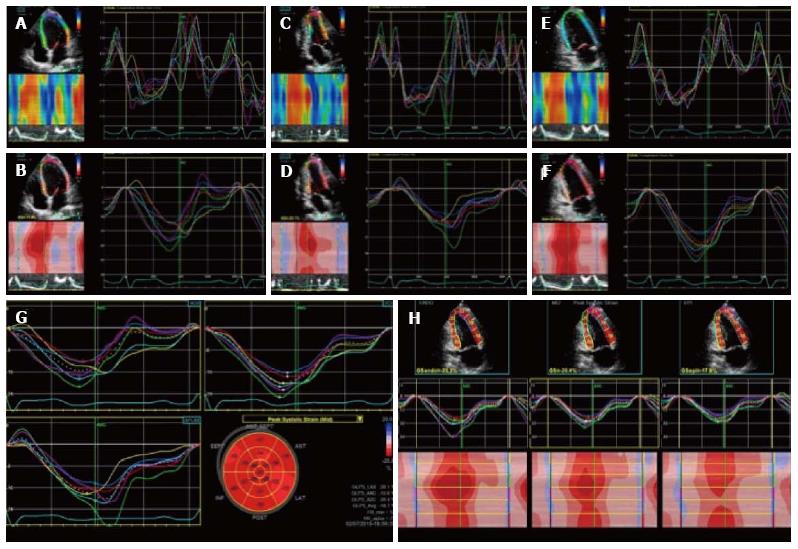
Figure 3 Two dimensional longitudinal strain.
2D longitudinal strain rate (A, C, E) and strain (B, D, F) analysis. Longitudinal strain is obtained from the 3 LV apical views (4C view, 2C view and 3C view). Strain values are then displayed in a bulls eye reconstruction (G). Longitudinal strain values for endocardium, mesocardium and epicardium can also be obtained (H). LV: Left ventricle; 2D: 2 dimensional.
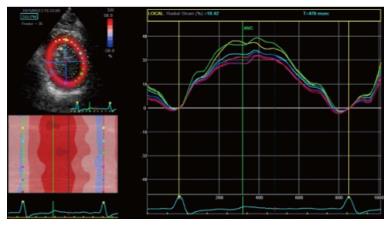
Figure 4 Radial strain analysis with 2 dimensional speckle tracking.
Synchronous strain pattern in a normal patient. During systole, radial strain values are represented by positive curves.
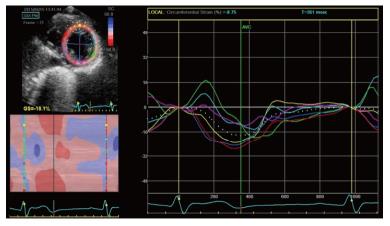
Figure 5 Two dimensional circumferential strain in a normal patient.
It represents left ventricle myocardial fiber shortening along the circular perimeter on a short-axis view and during systole, it is represented by synchronous negative curves.
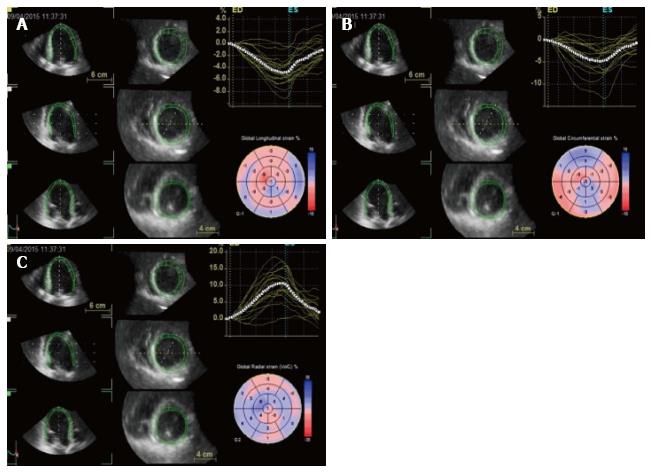
Figure 6 Three dimensional speckle tracking: data sets are displayed in different cross-sections including standard three short-axis views and apical four- and two-chamber views.
The software automatically divides data into 16 standard segments to generate corresponding time–strain curves. Wall motion parameters are simultaneously displayed in particular, the 3 orthogonal strain values (longitudinal strain in A, circumferential strain in B and radial strain in C).
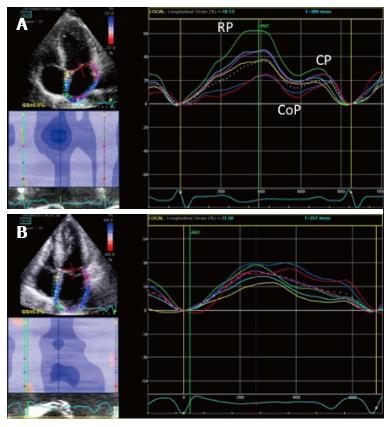
Figure 7 Two dimensional longitudinal atrial strain.
A: PALS in a normal patient. Triphasic strain pattern is evident: Reservoire phase (RP), conduit (CoP) and contractile phase (CP); B: Reduced PALS in a patient with a large MV flail and severe MR, without triphasic strain pattern. PALS: Peak atrial longitudinal strain; MV: Mitral valve; MR: Mitral regurgitation.
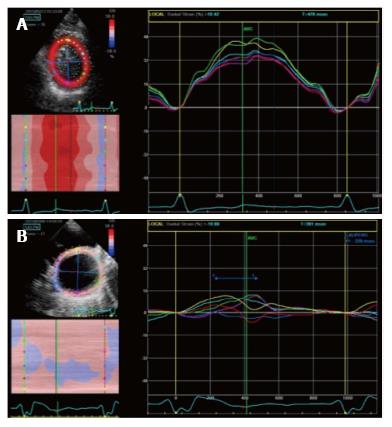
Figure 8 Radial strain analysis with 2 dimensional speckle tracking.
A: Synchronous strain pattern in a normal patients; B: Significant intraventricular dyssynchrony in a patient with dilated cardiomyopathy. A significant delay (≥ 130 msec) between anteroseptal peak strain (yellow segment) and posterior peak strain (pink segment) is evident.
- Citation: Rosa I, Marini C, Stella S, Ancona F, Spartera M, Margonato A, Agricola E. Mechanical dyssynchrony and deformation imaging in patients with functional mitral regurgitation. World J Cardiol 2016; 8(2): 146-162
- URL: https://www.wjgnet.com/1949-8462/full/v8/i2/146.htm
- DOI: https://dx.doi.org/10.4330/wjc.v8.i2.146


