Copyright
©The Author(s) 2016.
World J Cardiol. Feb 26, 2016; 8(2): 132-145
Published online Feb 26, 2016. doi: 10.4330/wjc.v8.i2.132
Published online Feb 26, 2016. doi: 10.4330/wjc.v8.i2.132
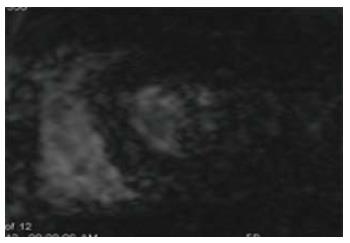
Figure 1 Iron overload cardiomyopathy.
Short axis gradient echo image with long echo time (15 ms) shows dark signal in the left ventricular myocardium due to increased iron deposition.
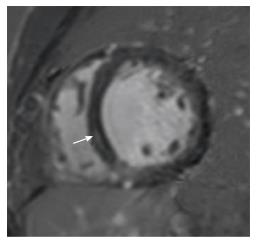
Figure 2 Idiopathic dilated cardiomyopathy.
Short axis delayed-enhancement image shows linear mid myocardial enhancement (arrow) in the basal septum, and dilated left ventricle, which is indicative of idiopathic dilated cardiomyopathy.
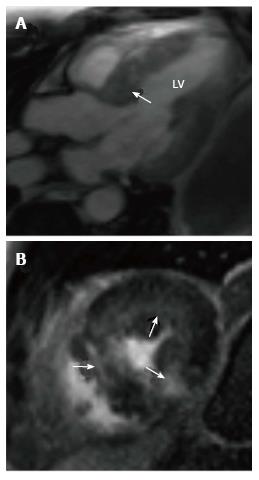
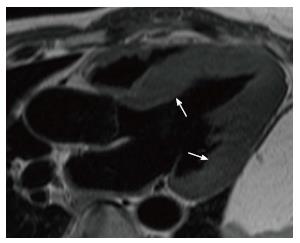
Figure 3 Hypertrophic cardiomyopathy.
A: Three-chamber steady state free precession image shows severe hypertrophy of the basal anteroseptum (arrow), which causes LVOT obstruction; B: Short-axis delayed enhancement image shows patchy mid myocardial enhancement in hypertrophied segments, suggestive of interstitial fibrosis in a pattern specific for hypertrophic cardiomyopathy. LV: Left ventricular.
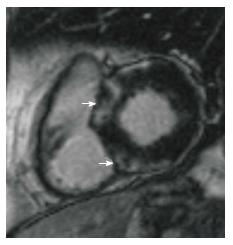
Figure 4 Sarcoidosis.
Short axis delayed enhancement image shows patchy areas of mid myocardial enhancement in the basal septum and basal inferior segments.
Figure 5 Myocarditis.
Four-chamber delayed enhancement image shows mid myocardial enhancement in the basal lateral segment, consistent with acute myocarditis. RA: Right atrium; LA: Left atrium; RV: Right ventricular; LV: Left ventricular.
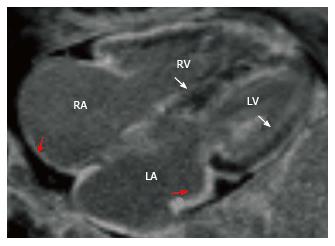
Figure 6 Amyloidosis.
Four-chamber delayed enhancement image shows diffuse subendocardial enhancement of the ventricles (arrows) and atrial walls (red arrows). Note that the blood has lower signal than normal. RA: Right atrium; LA: Left atrium; RV: Right ventricular; LV: Left ventricular.
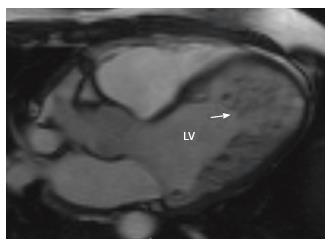
Figure 7 Left ventricular non compaction.
Three-chamber steady state free precession image shows excessive trabeculations in the left ventricle, with the ratio of trabeculated to non trabeculated myocardium of 8, consistent with left ventricular non compaction. LV: Left ventricular.
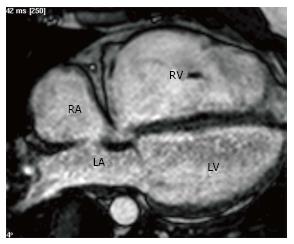
Figure 8 Arrhythmogenic right ventricular dysplasia.
Four-chamber cine steady state free precession image shows wall shows aneurysmal dilation of the right ventricle. There was also low ejection fraction (ejection fraction-35%) and severe right ventricle dilation (end diastolic volume index-130 mL/m2). These magnetic resonance imaging features satisfy one major criterion for arrhythmogenic right ventricular dysplasia. RA: Right atrium; LA: Left atrium; RV: Right ventricular; LV: Left ventricular.
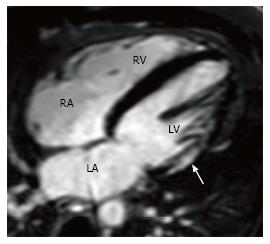
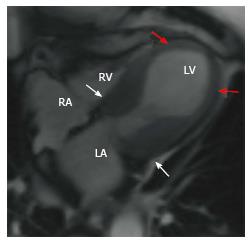
Figure 9 Takotsubo cardiomyopathy.
Four-chamber cine steady state free precession image shows classical appearances of Takotsubo cardiomyopathy, with hyperkinesis of the basal segments (arrows) and akinesis of the apical segments (red arrows), which resembles a Japanese octopus pot. RA: Right atrium; LA: Left atrium; RV: Right ventricular; LV: Left ventricular.
Figure 10 Fabry disease.
Three-chamber black blood image shows moderate to severe concentric hypertrophy in a patient with Fabry’s disease.
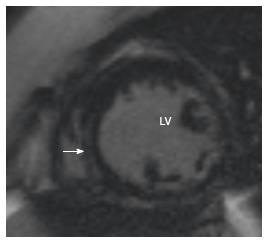
Figure 11 Duchenne muscular dystrophy.
Short-axis delayed enhancement image shows dilated left ventricle, with mid myocardial septal enhancement (arrow) in a patient with Duchenne muscular dystrophy. LV: Left ventricular.
- Citation: Kalisz K, Rajiah P. Impact of cardiac magnetic resonance imaging in non-ischemic cardiomyopathies. World J Cardiol 2016; 8(2): 132-145
- URL: https://www.wjgnet.com/1949-8462/full/v8/i2/132.htm
- DOI: https://dx.doi.org/10.4330/wjc.v8.i2.132


