Copyright
©The Author(s) 2016.
World J Cardiol. Dec 26, 2016; 8(12): 735-745
Published online Dec 26, 2016. doi: 10.4330/wjc.v8.i12.735
Published online Dec 26, 2016. doi: 10.4330/wjc.v8.i12.735
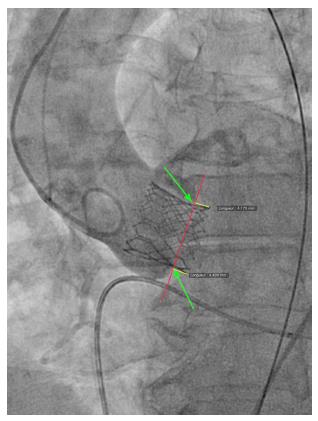
Figure 1 Depth of implant measurement.
The arrows show the hinge points between the device and neighboring sinuses of Valsalva. Next, the red line is drawn from the septal to the non-septal hinge point. The yellow lines, drawn perpendicularly from the red line to the extremity of the device frame, represent depth on the septal side (left) and the non-septal side (right).
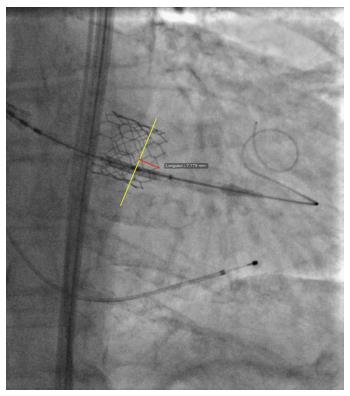
Figure 2 Device coaxiality measurement.
On a still frame, immediately after deployment while still under rapid pacing, a line is drawn connecting neighboring valve struts on the ventricular side of the device (yellow line). Next, a perpendicular line is drawn from the yellow line to the tip of the strut that appears the deepest (red line). The length of this red line is recorded as device lack of coaxiality.
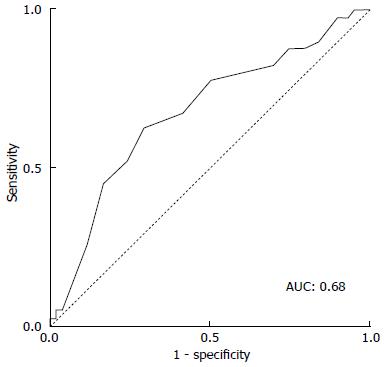
Figure 3 Receiver operating characteristic curve analysis of device diameter to annulus diameter ratio.
ROC curve analysis of device diameter to annulus diameter ratio below the threshold of 1.03 increased the risk of post-dilatation or PVR > mild (area under the curve: 0.68). PVR: Paravalvular regurgitation; ROC: Receiver operating characteristic; AUC: Area under curve.
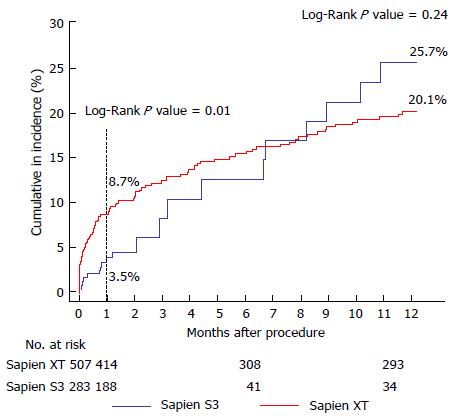
Figure 4 Cumulative incidence of all-cause mortality.
Cumulative incidence (%) of all-cause 1-year mortality in the S3-THV group (blue line) and the XT-THV group (red line). S3-THV: SAPIEN 3 transcatheter heart valve; XT-THV: SAPIEN XT transcatheter heart valve.
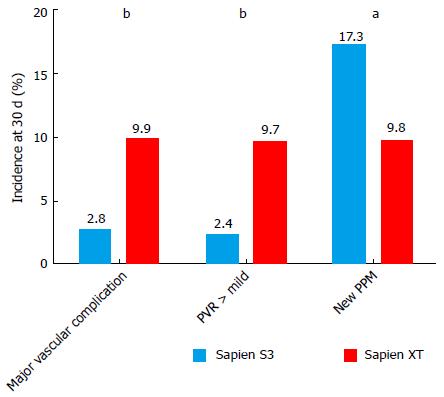
Figure 5 Incidence of major vascular complication, > mild para-valvular regurgitation and new permanent pacemaker.
Thirty-day incidence (%) of major vascular complication, > mild PVR and new PPM in the S3-THV group (blue bars) and the XT-THV group (red bars). aP < 0.05; bP < 0.0001. XT-THV: SAPIEN XT transcatheter heart valve; PPM: Permanent pacemaker; PVR: Paravalvular regurgitation.
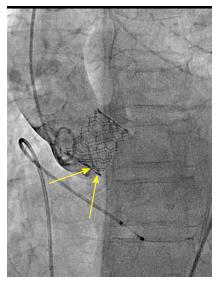
Figure 6 Example of difficult depth measurement.
In this case, the projection has been modified after implant so the device appears coaxial. However, the annulus is no longer coaxial: Two aortic cusps are seen at different levels on the septal side (arrows), making difficult the localization of the hinge point and therefore the measurement depth of implant.
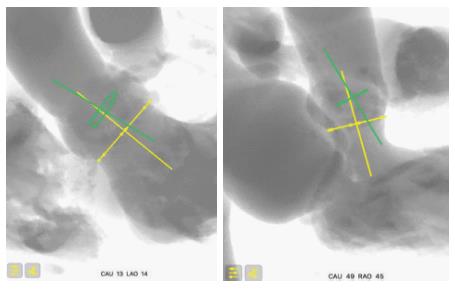
Figure 7 Coaxiality concept.
In this example, the aortic annulus is drawn in yellow and the device is in green. Two different C-arm angulations of the same structures are shown. If the operator selects the angulation on the left for deployment, estimation of implant depth will be more difficult as one of the structures (the device) is not coaxial. Notice that in both angulations, the annulus (yellow) is coaxial.
- Citation: Sawaya FJ, Spaziano M, Lefèvre T, Roy A, Garot P, Hovasse T, Neylon A, Benamer H, Romano M, Unterseeh T, Morice MC, Chevalier B. Comparison between the SAPIEN S3 and the SAPIEN XT transcatheter heart valves: A single-center experience. World J Cardiol 2016; 8(12): 735-745
- URL: https://www.wjgnet.com/1949-8462/full/v8/i12/735.htm
- DOI: https://dx.doi.org/10.4330/wjc.v8.i12.735


