Copyright
©The Author(s) 2016.
World J Cardiol. Nov 26, 2016; 8(11): 684-688
Published online Nov 26, 2016. doi: 10.4330/wjc.v8.i11.684
Published online Nov 26, 2016. doi: 10.4330/wjc.v8.i11.684
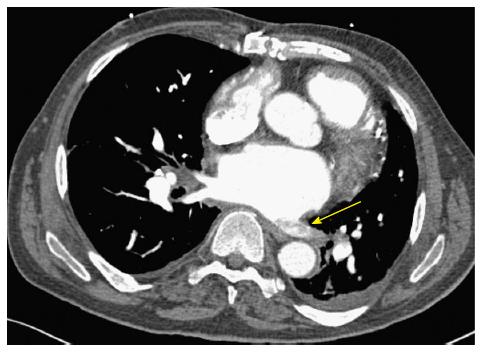
Figure 1 Computerized tomography angiography showing the pulmonary vein thrombosis of the left lower pulmonary vein.
A yellow arrow marks the position of the thrombus.
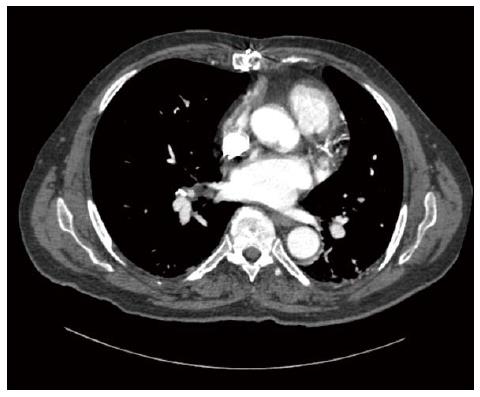
Figure 2 A follow up computerized tomographic angiogram showing the resolution of pulmonary vein thrombosis in the left lower pulmonary vein.
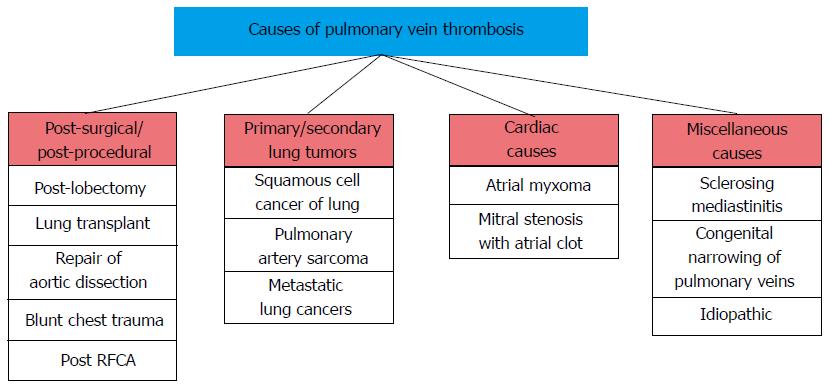
Figure 3 Flowchart describing the various causes of pulmonary vein thrombosis.
RFCA: Radio frequency catheter ablation.
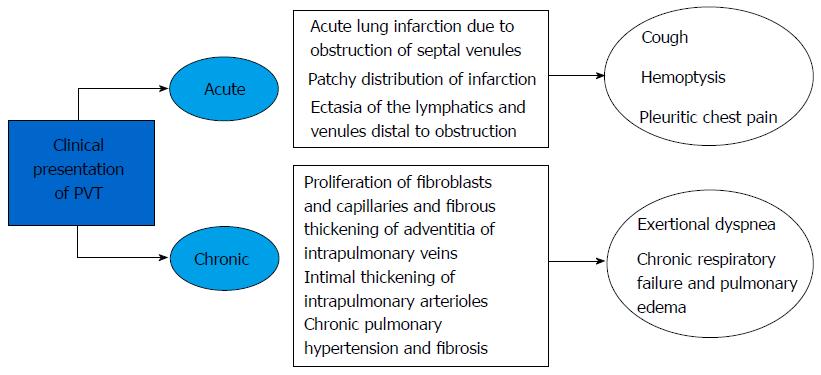
Figure 4 A flow diagram of the two different clinical presentation of pulmonary vein thrombosis.
PVT: Pulmonary vein thrombosis.
- Citation: Bhardwaj B, Jacob D, Sharma A, Ghanimeh MA, Baweja P. Pulmonary vein thrombosis in a patient with polycythemia vera. World J Cardiol 2016; 8(11): 684-688
- URL: https://www.wjgnet.com/1949-8462/full/v8/i11/684.htm
- DOI: https://dx.doi.org/10.4330/wjc.v8.i11.684


