Copyright
©The Author(s) 2016.
World J Cardiol. Oct 26, 2016; 8(10): 606-614
Published online Oct 26, 2016. doi: 10.4330/wjc.v8.i10.606
Published online Oct 26, 2016. doi: 10.4330/wjc.v8.i10.606
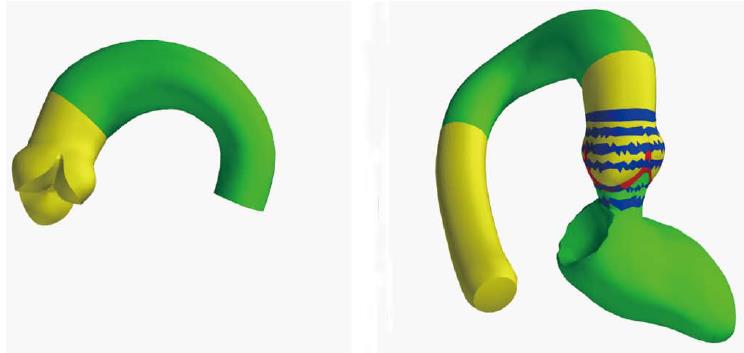
Figure 1 Mesh topology of the rotational C-arm computed tomography model for transcatheter aortic valve replacement (left), extended topology model with rings for diameter measurements (blue), prolonged descending aorta and left ventricle.
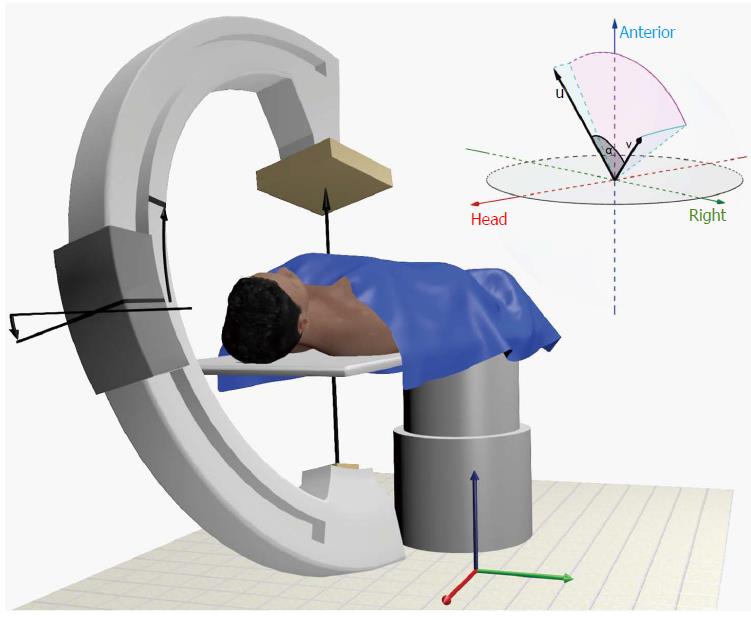
Figure 2 Definition of C-arm coordinate system and illustration of angular displacement between two position vectors each representing a C-arm projection view.
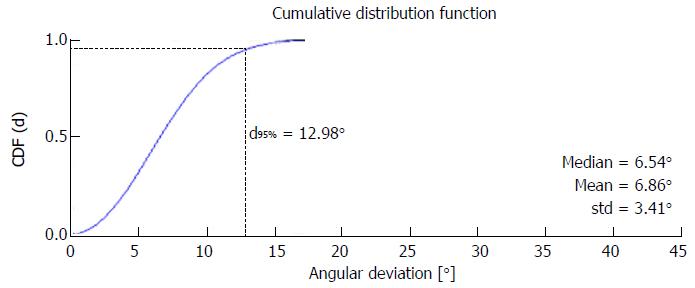
Figure 3 Interobserver variability of rotational C-arm computed tomography-based view planning.
Using Monte-Carlo methods the cumulative distribution function of the angular deviation between two operator-defined C-arm configurations was computed; from this distribution function the expected angular deviation is derived to be the value of the distribution function at 95% confidence level.
Figure 4 Line of perpendicularity curve for the aortic valve annulus of a sample patient.
The solid line represents the line of perpendicularity curve derived from the RCT model; optimal views following the right-cusp rule are given for two operators and the RCT model. RCT: Rotational C-arm computed tomography.
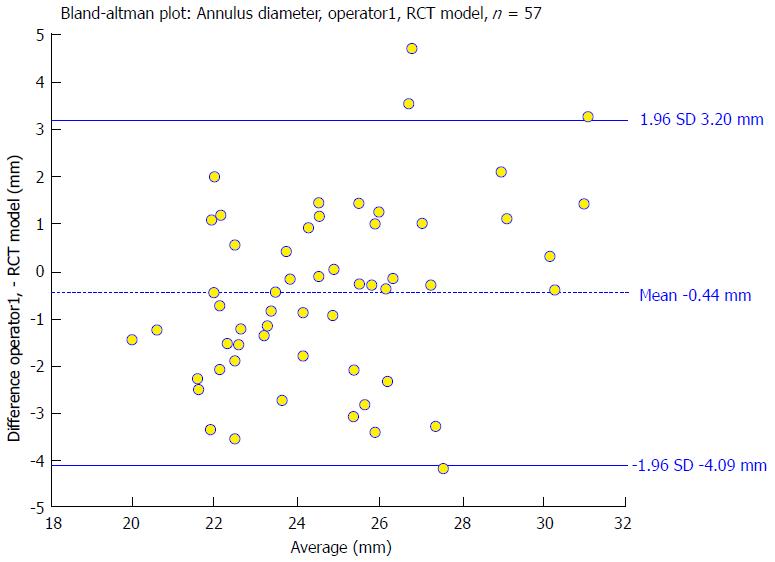
Figure 5 Bland-Altman plot relating aortic annulus diameter measurements done by a medical expert to rotational C-arm computed tomography-model-based measurements.
RCT: Rotational C-arm computed tomography.
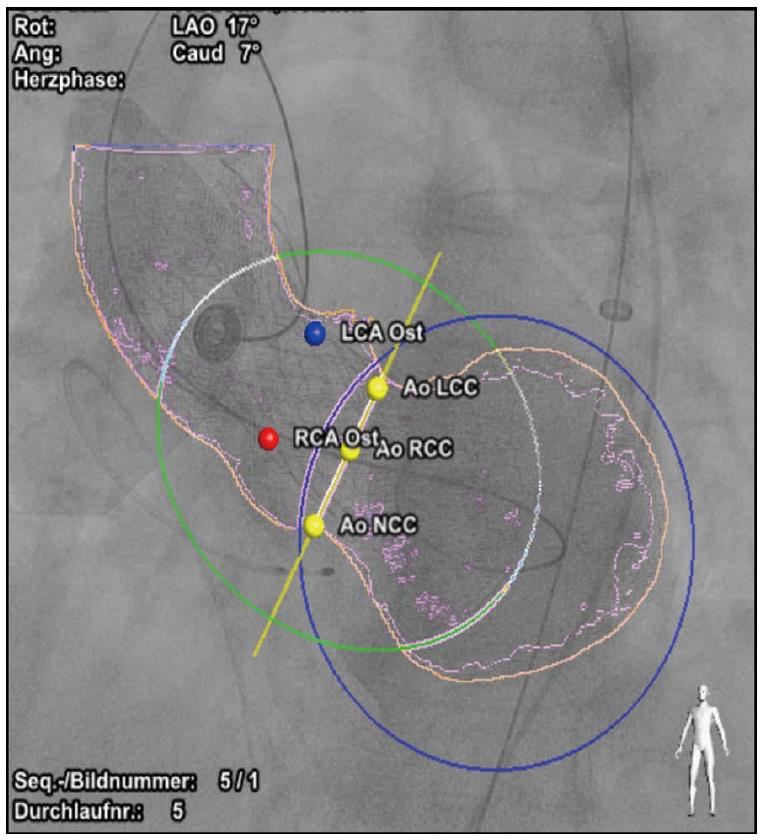
Figure 6 Model-based view planning and interventional overlay with Philips HeartNavigator software.
- Citation: Veulemans V, Mollus S, Saalbach A, Pietsch M, Hellhammer K, Zeus T, Westenfeld R, Weese J, Kelm M, Balzer J. Optimal C-arm angulation during transcatheter aortic valve replacement: Accuracy of a rotational C-arm computed tomography based three dimensional heart model. World J Cardiol 2016; 8(10): 606-614
- URL: https://www.wjgnet.com/1949-8462/full/v8/i10/606.htm
- DOI: https://dx.doi.org/10.4330/wjc.v8.i10.606


