Copyright
©The Author(s) 2016.
World J Cardiol. Oct 26, 2016; 8(10): 584-589
Published online Oct 26, 2016. doi: 10.4330/wjc.v8.i10.584
Published online Oct 26, 2016. doi: 10.4330/wjc.v8.i10.584
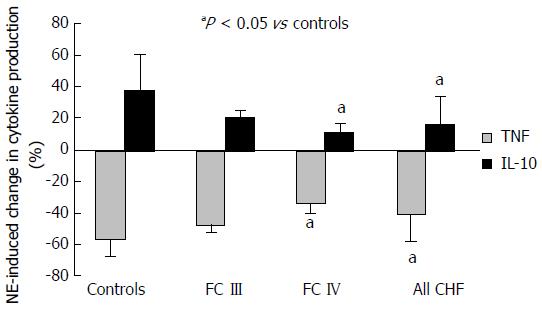
Figure 1 Comparative change in lipopolysaccharide-induced tumor necrosis factor-alpha and interleukin-10 production in monocytes induced by norepinephrine between heart failure patients and normal controls.
Results expressed as mean ± SD. FC: Functional classification.
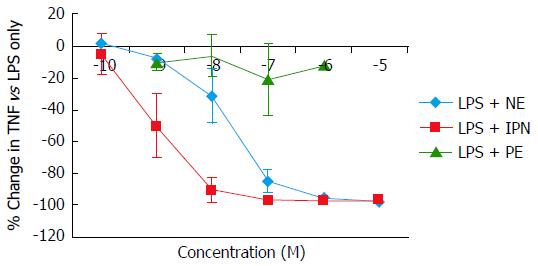
Figure 2 Concentration-dependent changes in lipopolysaccharide-induced tumor necrosis factor-alpha production in monocytic THP-1 cells induced by the α-adrenergic agonist phenylephrine and the β-adrenergic agonist isoproterenol.
Results expressed as mean ± SD. LPS: Lipopolysaccharide; NE: Norepinephrine; IPN: Isoproterenol; PE: Phenylephrine.
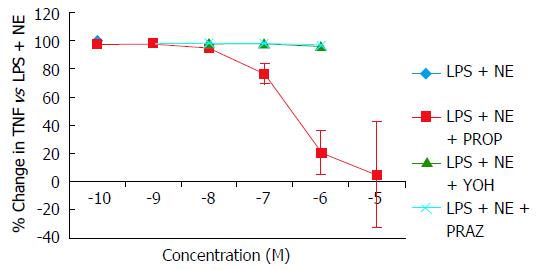
Figure 3 Concentration-dependent changes in norepinephrine attenuation of lipopolysaccharide-induced tumor necrosis factor-alpha production in monocytic THP-1 cells blocked by the α1-adrenergic antagonist prazosin, the α2-adrenergic antagonist yohimbine, and the β-adrenergic antagonist propranolol.
Results expressed as mean ± SD. LPS: Lipopolysaccharide; NE: Norepinephrine; PE: Phenylephrine; PROP: Propranolol; YOH: Yohimbine; PRAZ: Prazosin.
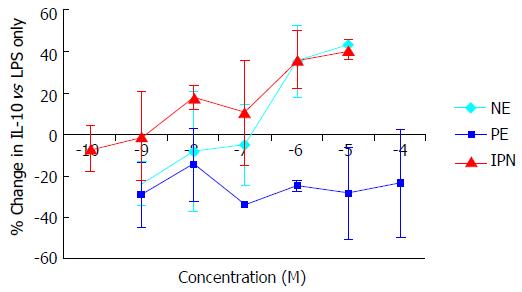
Figure 4 Concentration-dependent changes in interleukin-10 production in THP-1 cells induced by the α-adrenergic agonist phenylephrine and the β-adrenergic agonist isoproterenol.
Results expressed as mean ± SD. NE: Norepinephrine; IPN: Isoproterenol; PE: Phenylephrine; LPS: Lipopolysaccharide; IL: Interleukin.
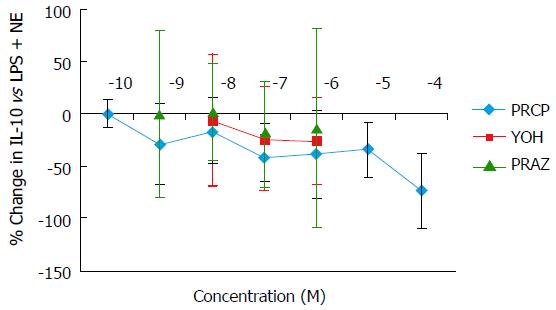
Figure 5 Concentration-dependent changes in norepinephrine attenuation of interleukin-10 production in THP-1 cells blocked by the α1-adrenergic antagonist prazosin, the α2-adrenergic antagonist yohimbine, and the β-adrenergic antagonist propranolol.
Results expressed as mean ± SD. LPS: Lipopolysaccharide; NE: Norepinephrine; PE: Phenylephrine; PROP: Propranolol; YOH: Yohimbine; PRAZ: Prazosin.
- Citation: Ng TM, Toews ML. Impaired norepinephrine regulation of monocyte inflammatory cytokine balance in heart failure. World J Cardiol 2016; 8(10): 584-589
- URL: https://www.wjgnet.com/1949-8462/full/v8/i10/584.htm
- DOI: https://dx.doi.org/10.4330/wjc.v8.i10.584


