Copyright
©The Author(s) 2015.
World J Cardiol. Sep 26, 2015; 7(9): 562-570
Published online Sep 26, 2015. doi: 10.4330/wjc.v7.i9.562
Published online Sep 26, 2015. doi: 10.4330/wjc.v7.i9.562
Figure 1 Specific points of interest can be marked in the ultrasound image by the interventionalist that will automatically appear on the fluoroscopic image.
In this case of a MitraClip® procedure, the echocardiographer displays the mitral valve with Color Doppler in the X-plane mode in order to define the most regurgitant jet (right upper panel). The interventionalist can then steer particular markers using the table-side control mouse, and place them to define the region of interest for the MitraClip® procedure. After adjusting the marker, it will appear on the fluoroscopic image, representing the exact region of interest, where the MitraClip® should be implanted (right lower panel).
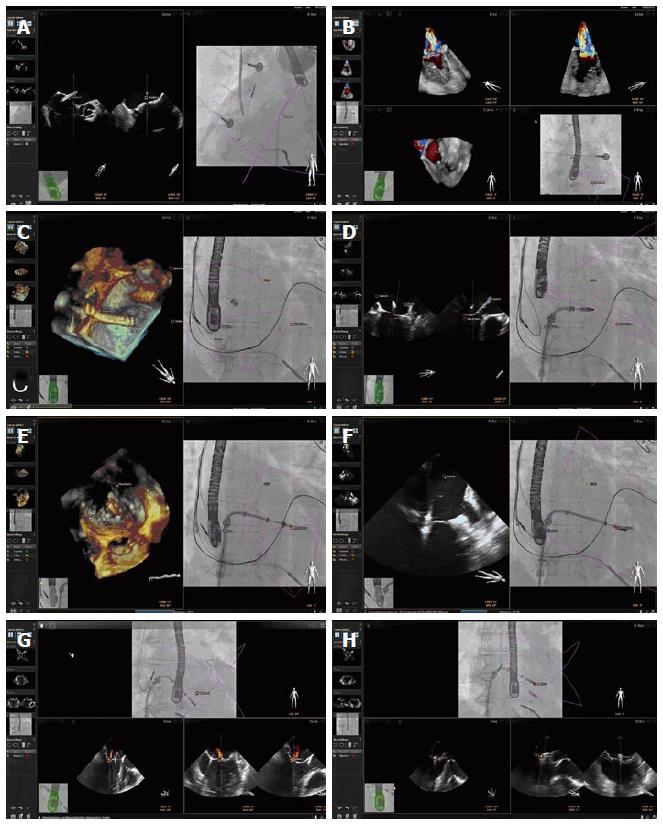
Figure 2 EchoNavigator® during MitraClip® procedures.
A demonstrates the Echo-view on the left, depicting an X-plane-view of the interatrial septum. The interventionalist can set markers in this view for exact delineation of the optimal puncture site that will automatically appear in the X-ray-view on the right. A 3D full volume color doppler image is shown in the right upper panel of B. After cropping into this data set, the maximum regurgitant jet was depicted and marked within this image. On the left side of C, a 3D view of the septum with the delivery system and especially the three points of interest (Septum, Crista, and Mitral valve) is demonstrated. The connection between these three points creates a virtual triangle in the X-ray-view on the right side of C, outlining the area at risk outside this triangle in the X-ray-view in D, where contact of the MitraClip® device with its surrounding structures potentially can lead to complications, such as perforation with cardiac tamponade. E demonstrate the process of Clip orientation orthogonally towards the commissure in the 3D view, and the grasping of leaflets in the 2D intercommisural view in F. The X-ray-view in both figures on the right display demonstrates the correct position of the Clip right on top of the red marker, corresponding with the echo images. G demonstrates the residual regurgitant jet on the lateral side of the first Clip. This jet was marked in the echo image and was then used for orientating a second Clip in the X-Ray image, as demonstrated in H. 2D: Two-dimensional; 3D: Three-dimensional.
Figure 3 Echonavigator® during left atrial appendage occlusion.
A demonstrates how the point of interest for potential transseptal crossing along the interatrial septum is marked in the Echo image. B demonstrates in the X-ray-view, that the wire is located cranial of the Crista terminalis, that initially was assigned in the Echo image. C depicts an ellipsoid ring, representing the landing zone for the occluder device marked yellow in the X-plane view of the 2D Echo image. D displays the deployment of the lobe of the left atrial appendage occluder, detecting that correct device size was chosen. E shows this ellipsoid marker right in between the lobe and the disc of the occluder after deployment of the disc. The red marker represents the location of the circumflex coronary artery. F shows the final result after disconnecting the guiding system from the occcluder. The left panel gives a nice 3D overview of the site of implantation, displaying the difference of the landing zone (yellow circle) and the orifice area of the left atrial appendage.
Figure 4 EchoNavigator® during atrial septal defect closure.
A: Shows in the Echo-view in the right upper panel an X-plane view of the interatrial septum with a bicaval and a short axis view. The defect is clearly illustrated and marked with a red circle, appearing also in the X-ray-view as the target lesion; B: Demonstrates the occluder device after deployment of both the left and the right atrial disc. Note in the right upper panel that the two discs embrace the red target marker, where the defect was previously located.
Figure 5 EchoNavigator® during transcatheter aortic valve repair.
For precise delineation of the aortic annulus, the hinge points of the three leaflets of the aortic valve were marked in the Echo image, as illustrated in the right upper panel in A. These markers then appeared in the fluoroscopic X-ray-image in the right lower panel. Afterwards, the gantry was moved in order to transfer the three markers in one orthogonal image plane. This was also performed using 3D TEE for a better spatial orientation along the annulus plane of the aortic valve (B).
Figure 6 A case of a prosthetic paravalvular leak presenting aortic regurgitation after transcatheter aortic valve repair.
The left panel demonstrates the Echo image in a short axis view, presenting the aortic annulus and depicting the regurgitant jet with Color Doppler. Here the marker was placed incorrectly, consequently transfering the marker next to the destination in the fluoroscopic image in the right panel. The red marker demonstrates where the region of interest should have been defined, reflecting the correct position in the fluoroscopic image.
- Citation: Balzer J, Zeus T, Hellhammer K, Veulemans V, Eschenhagen S, Kehmeier E, Meyer C, Rassaf T, Kelm M. Initial clinical experience using the EchoNavigator®-system during structural heart disease interventions. World J Cardiol 2015; 7(9): 562-570
- URL: https://www.wjgnet.com/1949-8462/full/v7/i9/562.htm
- DOI: https://dx.doi.org/10.4330/wjc.v7.i9.562


