Copyright
©The Author(s) 2015.
World J Cardiol. Aug 26, 2015; 7(8): 490-498
Published online Aug 26, 2015. doi: 10.4330/wjc.v7.i8.490
Published online Aug 26, 2015. doi: 10.4330/wjc.v7.i8.490
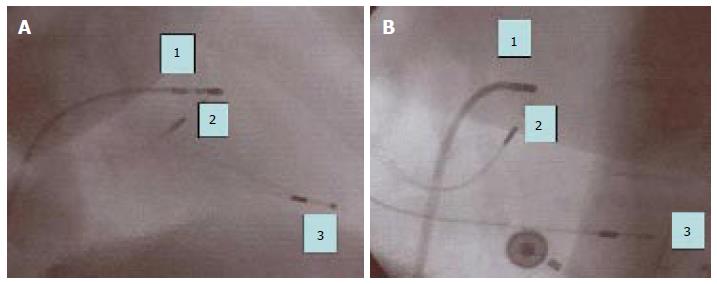
Figure 1 Antero-posterior (A) and left anterior oblique (B) fluoroscopic projections showing leads position after the “ablate and pace” procedure and parahisian pacing.
1 = quadripolar radiofrequency catheter mapping the Hisian site; 2 = screw-in bipolar lead positioned near the His-bundle; 3 = bipolar lead positioned in right ventricular apex.
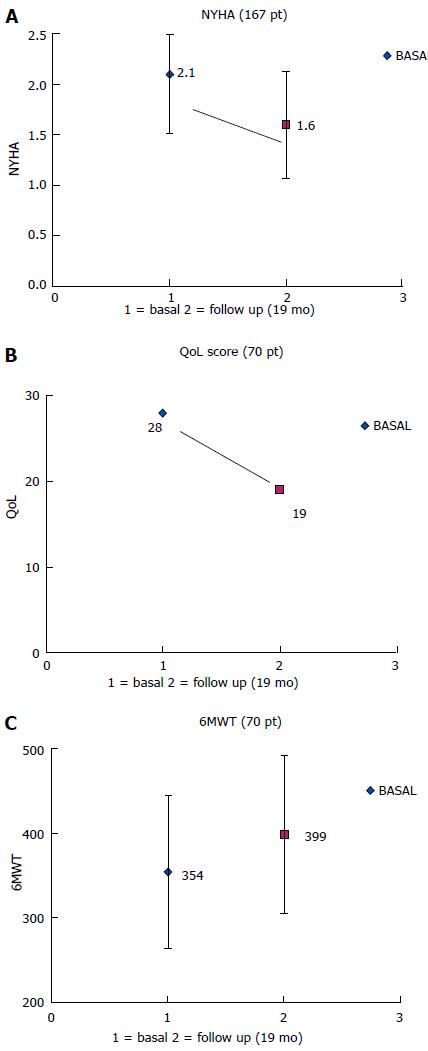
Figure 2 Clinical data before pacemaker implant (basal) and after septal pacing follow up.
A: New York Heart Association functional class (NYHA); B: Quality of life (QoL) minnesota score; C: Six-minute walking test (6mwt) (meters).
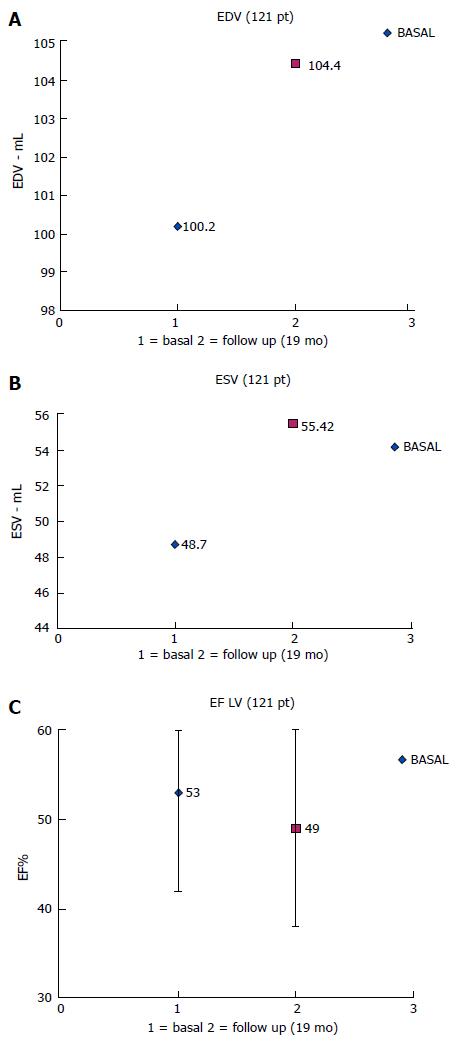
Figure 3 Echocardiographic data before pacemaker implant (basal) and after septal pacing follow up.
A: End diastolic left ventricular volumes (EDV); B: End systolic left ventricular volumes (EDV); C: Left ventricular ejection fraction (EF LV).
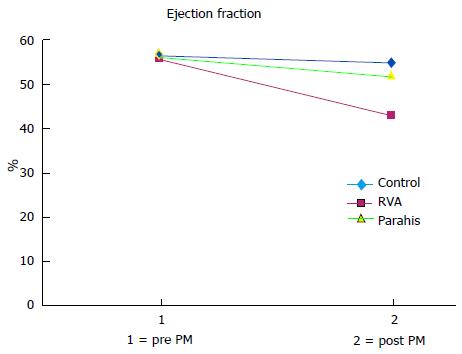
Figure 4 Average values of left ventricular ejection fraction at the baseline (1) and after two years of follow-up (2) in patients without significant stimulation (blue: control NO pacing), right ventricular apex paced patients (red: right ventricular apical ) and parahisian paced patients (green: parahis).
In control patients and PH patients, the ejection fraction remained essentially normal (values above 50%), while in RVA patients it declined significantly to average values of around 40. RVA: Right ventricular; PH: Parahisian.
- Citation: Occhetta E, Quirino G, Baduena L, Nappo R, Cavallino C, Facchini E, Pistelli P, Magnani A, Bortnik M, Francalacci G, Dell’Era G, Plebani L, Marino P. Right ventricular septal pacing: Safety and efficacy in a long term follow up. World J Cardiol 2015; 7(8): 490-498
- URL: https://www.wjgnet.com/1949-8462/full/v7/i8/490.htm
- DOI: https://dx.doi.org/10.4330/wjc.v7.i8.490


