Copyright
©The Author(s) 2015.
World J Cardiol. Jul 26, 2015; 7(7): 373-376
Published online Jul 26, 2015. doi: 10.4330/wjc.v7.i7.373
Published online Jul 26, 2015. doi: 10.4330/wjc.v7.i7.373
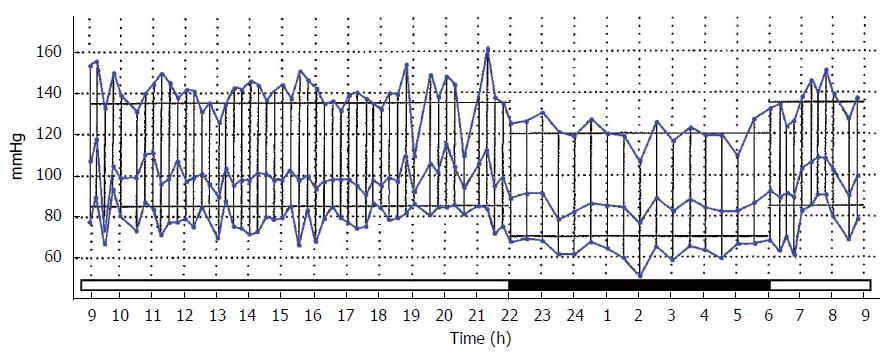
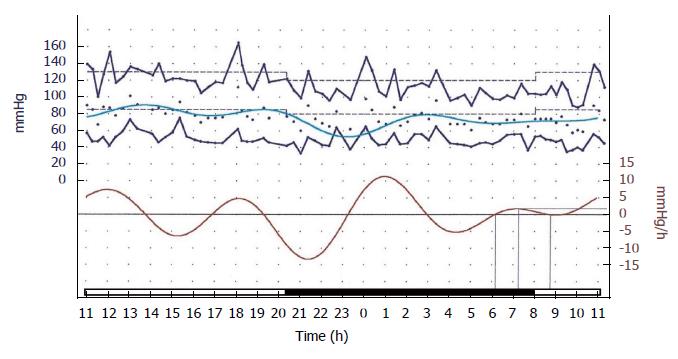
Figure 1 Ambulatory blood pressure recording showing a normal night time dip.
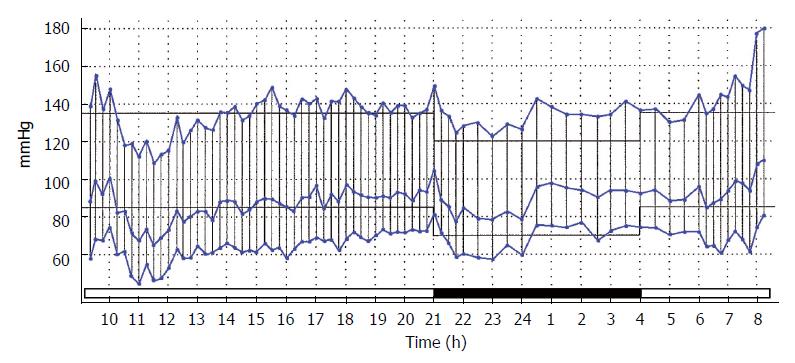
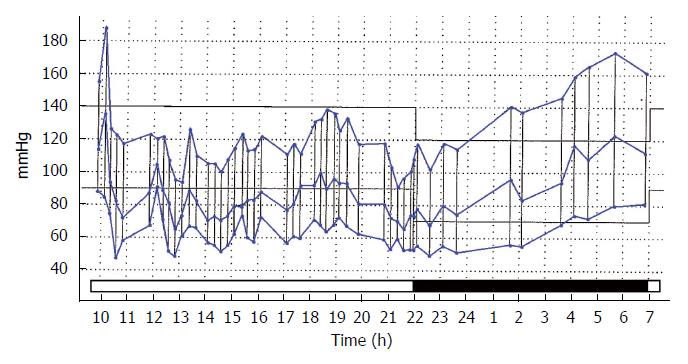
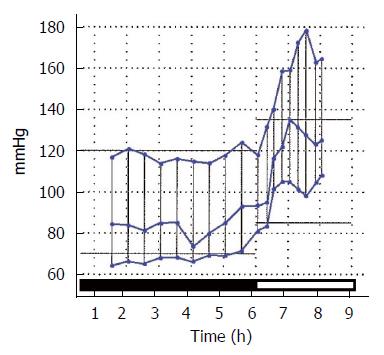
In all the ambulatory blood pressure monitoring tracings, the systolic, diastolic, and mean pressures are shown in blue. The pressure scale in mmHg is on the vertical Y-axis on the left and the time scale in hours is on the horizontal X-axis. The duration of sleep corresponding to the night time period is indicated by a heavy black bar.
Figure 2 Ambulatory blood pressure recording showing a blunted night time dip.
Figure 3 Ambulatory blood pressure recording showing white coat hypertension with a steadily rising pressure of superimposed essential hypertension.
The pressure only reaches hypertension levels during sleep when it is likely to be clinically unnoticed.
Figure 4 Ambulatory blood pressure recording showing a significantly rapid rise in mean blood pressure upon awakening.
Figure 5 Ambulatory blood pressure recording showing the rate of pressure rise upon awakening at 7 am.
At 1 am, the rate of rise reaches cardiac risk significance. The scale in mmHg/h is shown in red on the right.
- Citation: Bloomfield D, Park A. Night time blood pressure dip. World J Cardiol 2015; 7(7): 373-376
- URL: https://www.wjgnet.com/1949-8462/full/v7/i7/373.htm
- DOI: https://dx.doi.org/10.4330/wjc.v7.i7.373


