Copyright
©The Author(s) 2015.
World J Cardiol. Jun 26, 2015; 7(6): 361-366
Published online Jun 26, 2015. doi: 10.4330/wjc.v7.i6.361
Published online Jun 26, 2015. doi: 10.4330/wjc.v7.i6.361
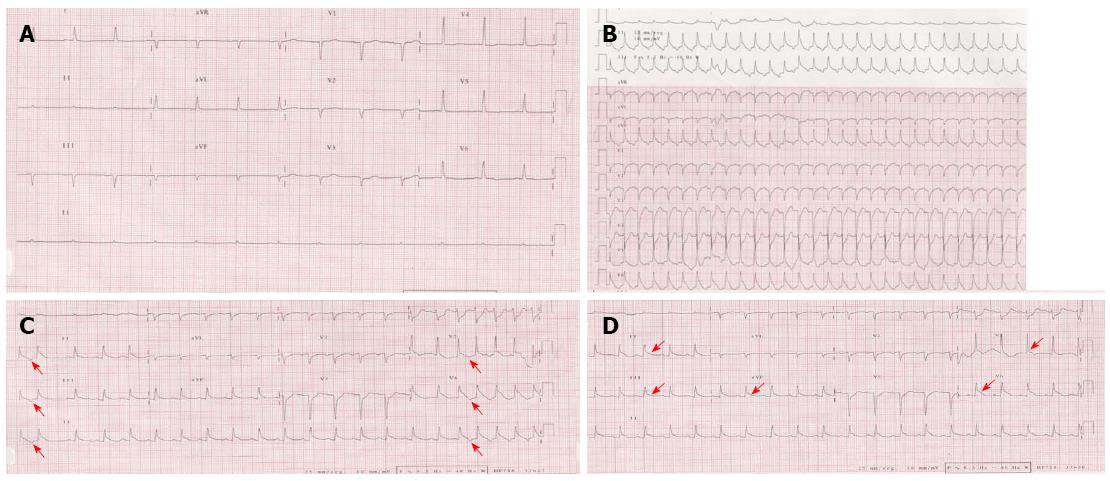
Figure 1 Change process of electrocardiogram.
Baseline electrocardiogram (ECG) showed sinus bradycardia and nonspecific repolarization abnormalities (A). Surface ECG of repetitive nonsustained atrial tachycardia (AT). Note that the first P wave of the tachycardia is similar in morphology to the subsequent P waves, consistent with abnormal automaticity as the mechanism of the AT (red arrow). In the setting of posteroseptal AT (originating below and around the coronary sinus ostium), the P wave is positive in lead V1, negative in the inferior leads, and positive in leads aVL and aVR (B and C). ECG after the completion of the tachycardia showed persistent ST elevation in leads II, III, AVF, V5 and V6 (D) (red arrows).
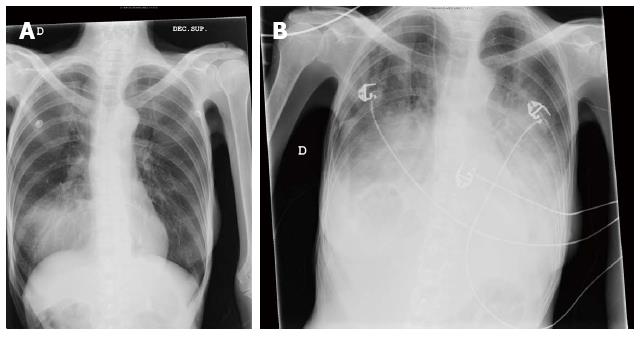
Figure 2 Chest X-ray on admission (A) and after the episode of atrial tachycardia (B) showing signs of severe heart failure.
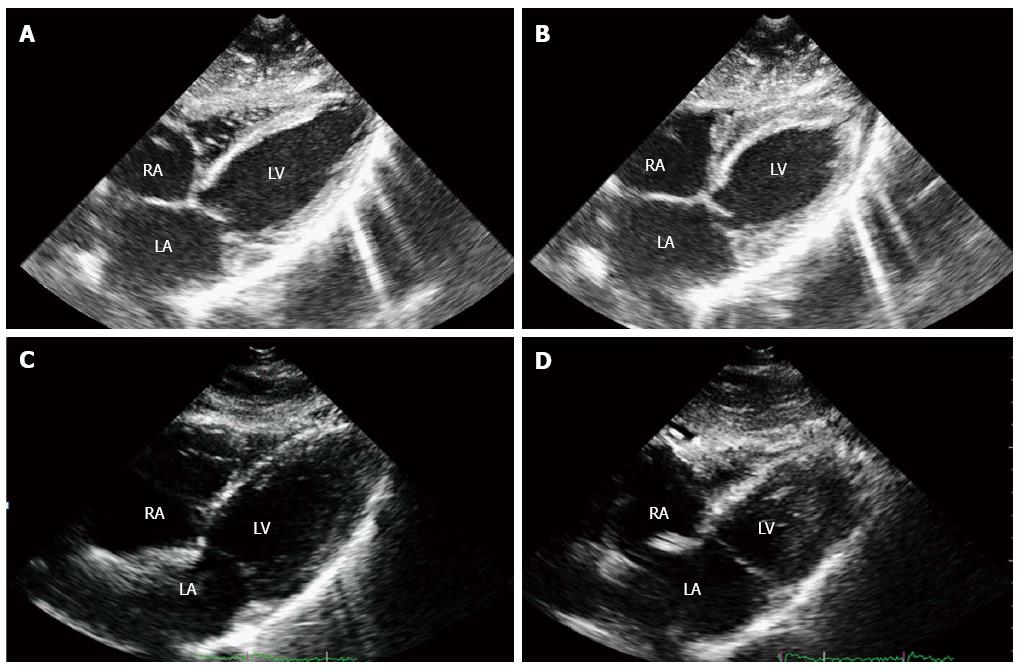
Figure 3 Two-dimensional echocardiogram, subcostal four chambers view, showing the anteroseptal and posterolateral walls of the left ventricle.
End-diastolic (A) and mid-systolic (B) frames at the time of acute cardiac symptoms presentation showed dyskinesia of basal and medium segments, with hyperkinesia of the left ventricular apex. One week later, recovery of the wall motion abnormalities was demonstrated, with hyperdynamic ejection fraction (C and D). A previous echocardiogram performed two years before in this patient was similar to this last one. RA: Right atrium; LA: Left atrium; LV: Left ventricle.
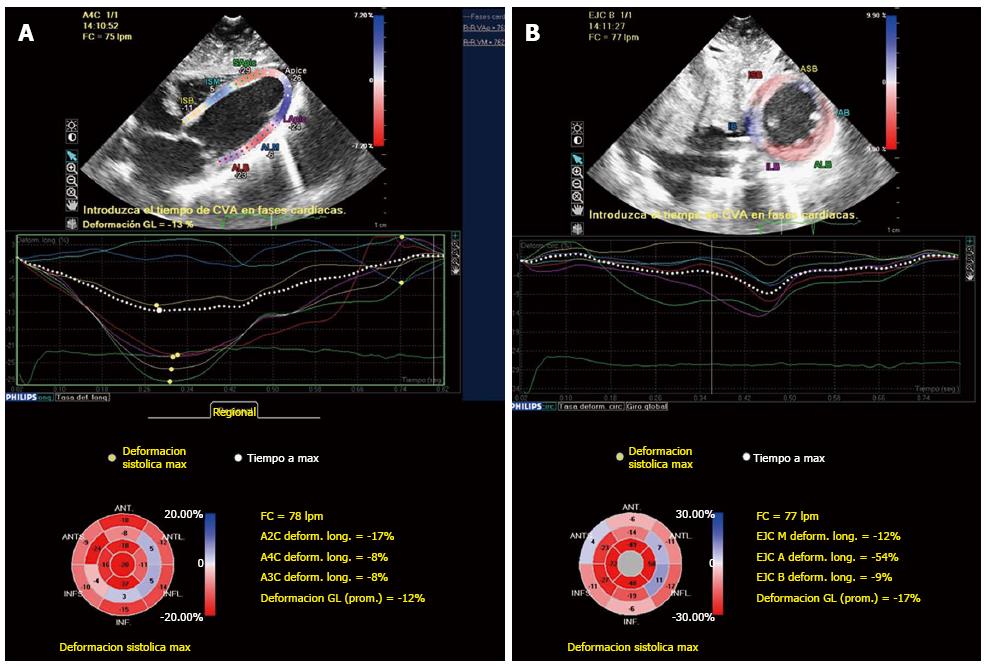
Figure 4 Bull’s eye mapping of two-dimensional speckle tracking strain imaging longitudinal (A) and circunferencial (B) showed decreased strain values of the basal and mid-ventricular segments, with normal or increased strain values of the apical segments.
- Citation: Robles P, Monedero I, Rubio A, Botas J. Reverse or inverted apical ballooning in a case of refeeding syndrome. World J Cardiol 2015; 7(6): 361-366
- URL: https://www.wjgnet.com/1949-8462/full/v7/i6/361.htm
- DOI: https://dx.doi.org/10.4330/wjc.v7.i6.361


