Copyright
©The Author(s) 2015.
World J Cardiol. May 26, 2015; 7(5): 287-292
Published online May 26, 2015. doi: 10.4330/wjc.v7.i5.287
Published online May 26, 2015. doi: 10.4330/wjc.v7.i5.287
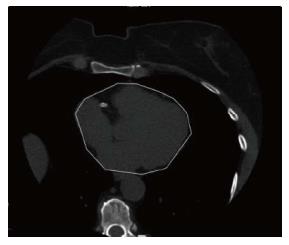
Figure 1 Measurement of epicardial fat volume; the electronic line delineates the contour of epicardiumin in noncontrast computed tomography.
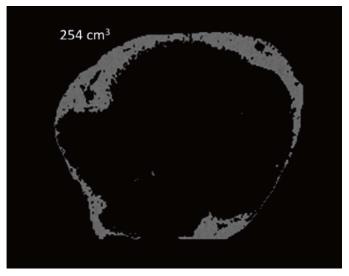
Figure 2 Measurement of epicardial fat volume; the fat voxels were identified using threshold attenuation values (-30 to -190 HU) and the volume of epicardial fat is measures.
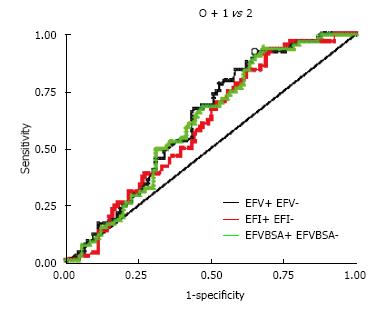
Figure 3 Receiver operating characteristic curves compare the three parameters for measuring the epicardial fat.
AUC was 0.62 for EFV, 0.6 for EFVBMI, and 0.61 for EFVBSA (non-significant pairwise comparison). EFV: Epicardial fat volume; EFVBMI: EFV indexed with body mass index; EFVBSA: EFV indexed with body surface area.
- Citation: Saad Z, El-Rawy M, Donkol RH, Boghattas S. Quantification of epicardial fat: Which method can predict significant coronary artery disease? World J Cardiol 2015; 7(5): 287-292
- URL: https://www.wjgnet.com/1949-8462/full/v7/i5/287.htm
- DOI: https://dx.doi.org/10.4330/wjc.v7.i5.287


