Copyright
©The Author(s) 2015.
World J Cardiol. Apr 26, 2015; 7(4): 178-186
Published online Apr 26, 2015. doi: 10.4330/wjc.v7.i4.178
Published online Apr 26, 2015. doi: 10.4330/wjc.v7.i4.178
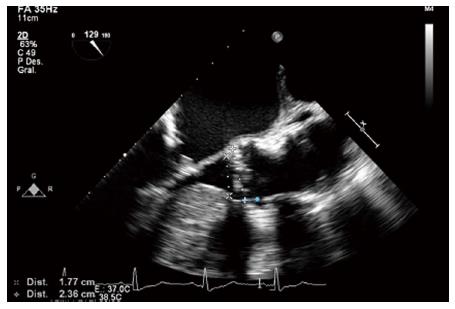
Figure 1 Transesophageal echocardiography 2D at 129° in long axis view in systole with measurements of the left ventricular outflow tract and aortic annulus.
The measurement in blue is the distance to the rigth coronary artery.
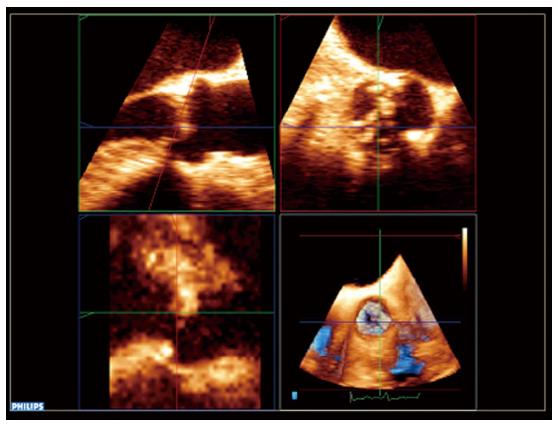
Figure 2 Transesophageal echocardiography 3D with multiplanar projection showing the measurements at annulus level.
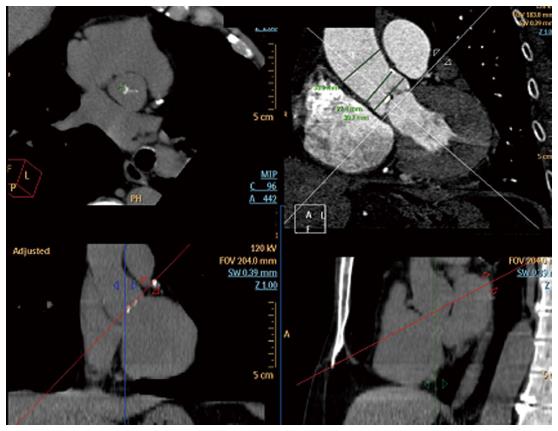
Figure 3 Computed tomography with multiplanar reconstruction showing measurements at different levels of the aorta.
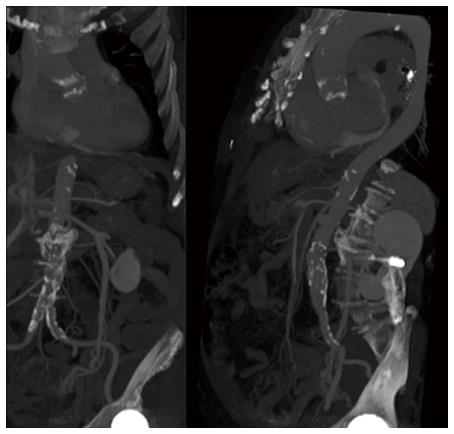
Figure 4 Computed tomography images showing aortic anatomy and calcifications, previous to transcatheter aortic valve implantation procedure.
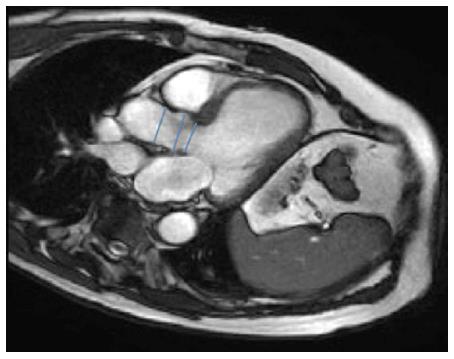
Figure 5 T1 weighted cardiac magnetic resonance image depicting aorta measurements.
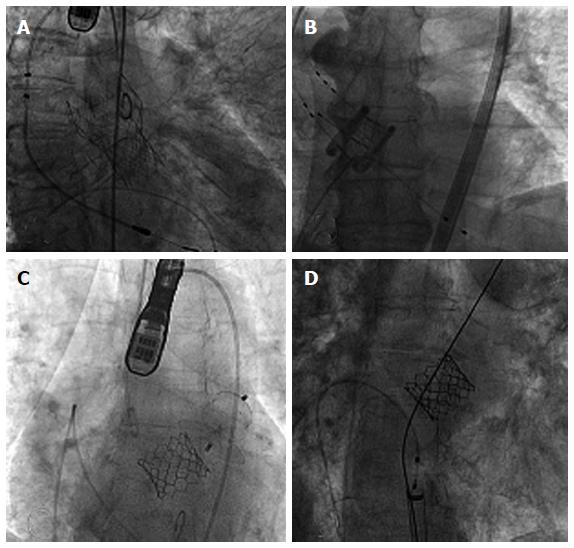
Figure 6 Fluoroscopy images showing different prosthesis models.
A: CoreValve evolut R; B: Direct Flow valve; C: Edward Sapien 3; D: Edward Sapien XT.
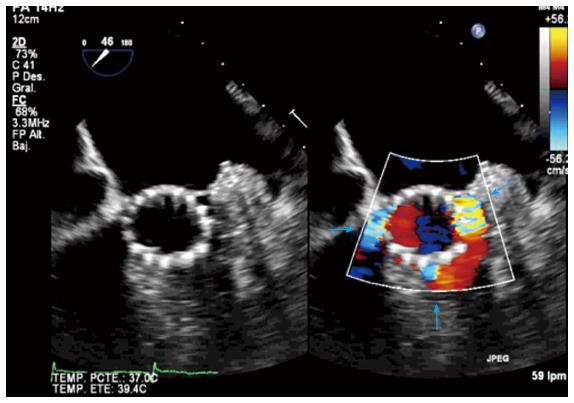
Figure 7 Transesophageal echocardiography at 46°without and with color Doppler showing 3 paravalvular leaks (arrows) after valve implantation.
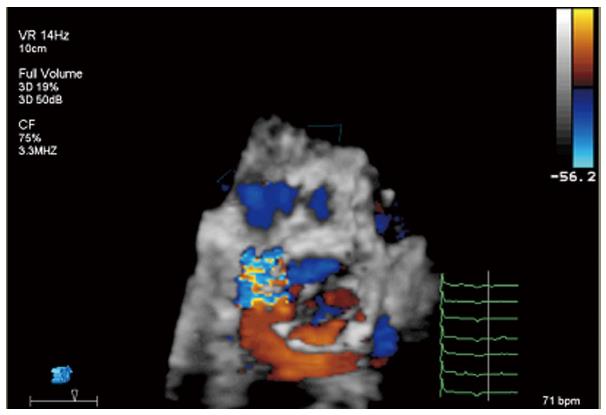
Figure 8 Transesophageal echocardiography 3D full volume showing the exact position of an important paravalvular leak.
Figure 9 Transesophageal echocardiography at 114° without and with color Doppler depicting the presence of central aortic regurgitation due to underexpansion of the prosthesis.
- Citation: Feltes G, Núñez-Gil IJ. Practical update on imaging and transcatheter aortic valve implantation. World J Cardiol 2015; 7(4): 178-186
- URL: https://www.wjgnet.com/1949-8462/full/v7/i4/178.htm
- DOI: https://dx.doi.org/10.4330/wjc.v7.i4.178


