Copyright
©The Author(s) 2015.
World J Cardiol. Nov 26, 2015; 7(11): 742-753
Published online Nov 26, 2015. doi: 10.4330/wjc.v7.i11.742
Published online Nov 26, 2015. doi: 10.4330/wjc.v7.i11.742
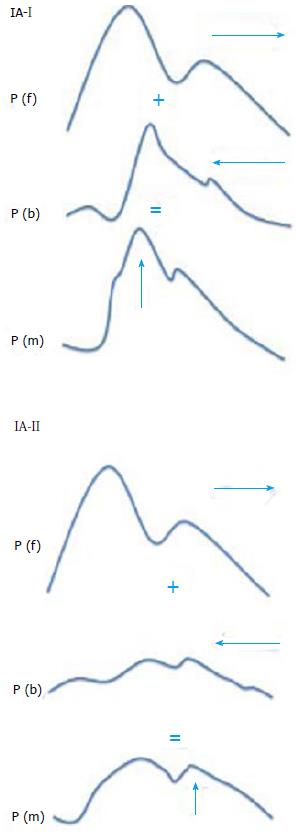
Figure 1 The central aortic pressure waveform is the summation of forward travelling wave, P (f) and the reflected backward-travelling wave, P (b).
On the top graph IA-I, is an illustration of a stiff aorta or peripheral vasoconstriction, both P (f) and P (b) travel fast and the magnitude of the reflected wave is increased, thus augmenting the systolic pressure of summated central aortic pressure waveform, P (m). In graph IA-II, is another illustration of a distensible aorta or with vasodilatation. Length and thickness of horizontal arrows correspond to the waveform velocity and the magnitude of the reflected wave, respectively. Vertical arrows indicate point of merging of P (f) and P (b).
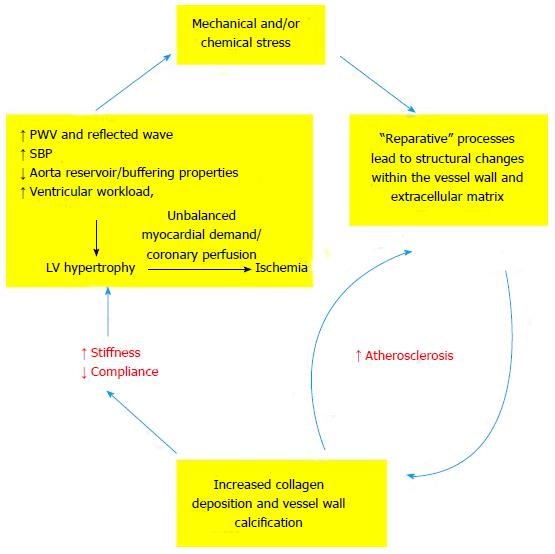
Figure 2 Aortic elastic properties may be altered by several processes, resulting in increased stiffness, decreased compliance, and encompassing the diseased ventricular-arterial coupling.
Mechanical and chemical stress factors include hypertension, inflammation, advanced glycation end products, etc. LV: Ventricular; PWV: Pulse wave velocity; SBP: Systolic blood pressure.
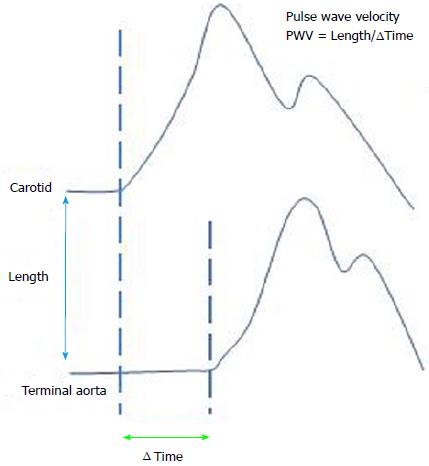
Figure 3 For practical purpose, femoral artery is counted as the terminal aorta.
The measured distance is length. If ∆Time represents the time delay between the feet of the 2 waves, pulse wave velocity.
- Citation: Wu CF, Liu PY, Wu TJ, Hung Y, Yang SP, Lin GM. Therapeutic modification of arterial stiffness: An update and comprehensive review. World J Cardiol 2015; 7(11): 742-753
- URL: https://www.wjgnet.com/1949-8462/full/v7/i11/742.htm
- DOI: https://dx.doi.org/10.4330/wjc.v7.i11.742


