Copyright
©2014 Baishideng Publishing Group Inc.
World J Cardiol. Sep 26, 2014; 6(9): 959-967
Published online Sep 26, 2014. doi: 10.4330/wjc.v6.i9.959
Published online Sep 26, 2014. doi: 10.4330/wjc.v6.i9.959
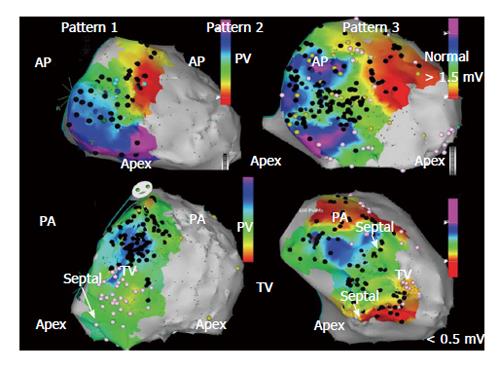
Figure 1 Bipolar right ventricle endocardial voltage maps demonstrating characteristic patterns of low voltage (< 1.
5 mV) regions identified in patients with arrhythmogenic right ventricular cardiomyopathy/dysplasi and ventricular tachycardia in anterior and posterior views. Peritricuspid (pattern 1), peripulmonic (pattern 2), or more extensive involvement extending from both valvular regions (pattern 3) is shown. Distribution of abnormal electrograms is predominantly free wall. Right ventricle apex is spared, and septal involvement is frequently identified (arrows). Adapted from Marchlinski et al[15] with permission. AP: Anterior; PA: Posterior.
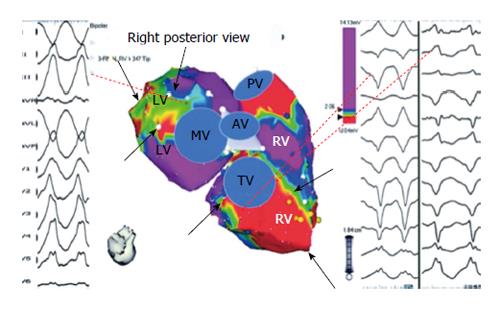
Figure 2 Bipolar right ventricle and left ventricle endocardial voltage maps highlighting location of abnormal endocardium and origin of ventricular tachycardia in a patient with right ventricle cardiomyopathy and ventricular tachycardia.
Electroanatomic abnormalities include both the tricuspid and mitral valves from tricuspid and mitral valves (black arrows). Origin of ventricular tachycardia (VT) based on activation and pace mapping was perivalvular mitral for the RBBB VT and perivalvular tricuspid valve for LBBB VT (dashed lines). Adapted from Marchlinski et al[15] with permission. RV: Right ventricle; LV: Left ventricle.
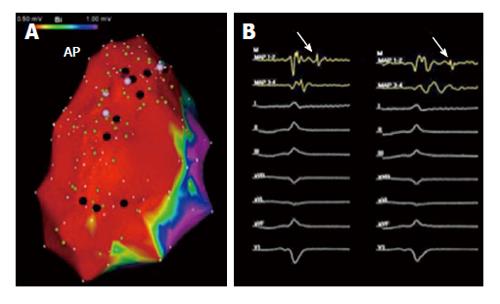
Figure 3 Epicardial right ventricle bipolar voltage map and isolated late potentials in sinus rhythm.
A: Demonstrates significant epicardial bipolar voltage abnormalities (< 1.0 mV) over the right ventricle free wall. The black tags on the electroanatomical map represent areas of abnormal fractionated and/or late signals identified during sinus rhythm voltage mapping; B: Provides an example, as exhibited by the white arrows, of an isolated late potential. AP: Anterior.
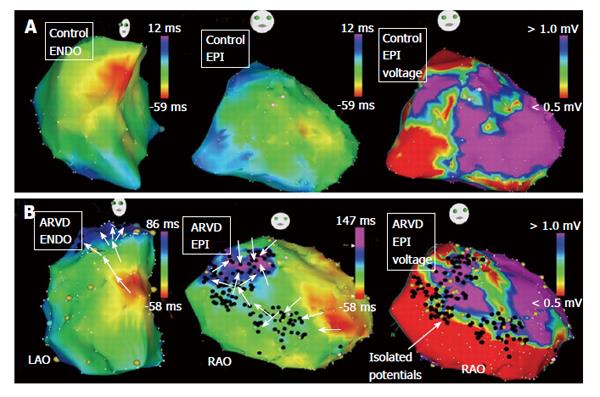
Figure 4 Right ventricle endocardial and epicardial activation maps and epicardial bipolar voltage maps of a control patient (A) and a patient with arrhythmogenic right ventricular cardiomyopathy/dysplasia (B) are shown.
A: From control patient demonstrates continuous and rapid activation from the anteroseptal region toward the infundibulum and tricuspid annulus. The endocardial (not shown) and epicardial voltage map did not reveal any late potential or substantive voltage abnormalities; B: From patient with ARVC/D demonstrates significant epicardial scarring with epiendo isolated late potentials (black tags) on the bipolar voltage map. The activation wavefront is significantly delayed into the scar due to the extensive epicardial disease. Adapted from Haqqani et al[18] with permission. RAO: Right anterior oblique; LAO: Left anterior oblique.
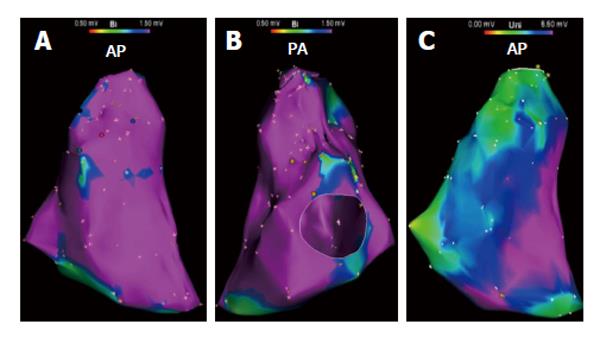
Figure 5 Bipolar and unipolar endocardial right ventricle voltage maps in a patient with ventricular tachycardia in the setting of arrhythmogenic right ventricular cardiomyopathy/dysplasia.
A and B: Demonstrate no substantial endocardial substrate on bipolar voltage map; C: Demonstrates a substantial area of unipolar voltage abnormality (< 5.5 mV) encompassing most of the right ventricle free wall in the same patient. AP: Anterior; PA: Posterior.
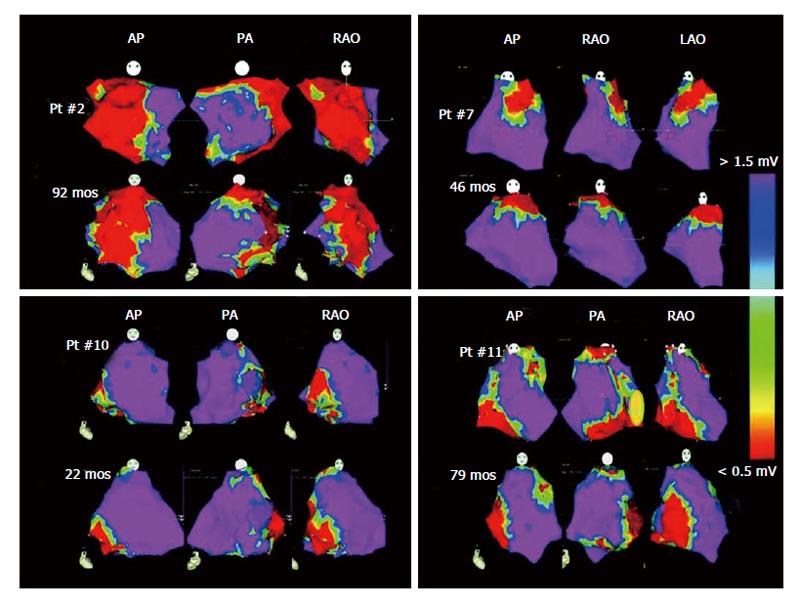
Figure 6 Right ventricle endocardial sinus rhythm bipolar voltage maps for 4 patients who did not develop scar progression over time.
Each patient shows complementary views in the anterior (AP), right anterior oblique (RAO), and left anterior oblique (LAO) projections during initial and subsequent catheter ablation procedures. Normal voltage regions are represented in the purple regions and low voltage areas are represented in red. Adapted from Riley et al[21] with permission. PA: Posterior.
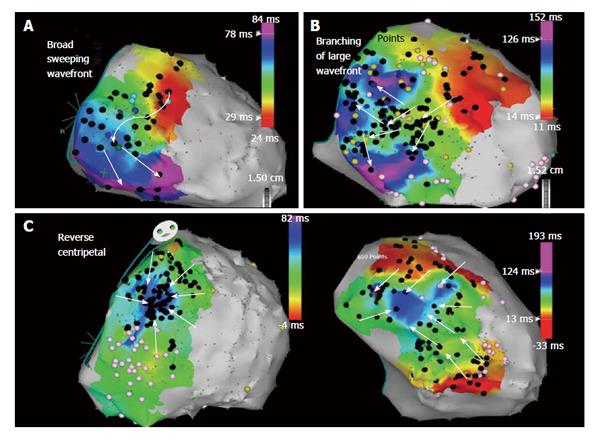
Figure 7 Epicardial right ventricle free wall activation maps illustrating propagation wavefront of epicardial isolated potentials in a patient with arrhythmogenic right ventricular cardiomyopathy/dysplasia.
A: Right ventricle (RV) free wall activation via a broad wavefront progressing toward the inferior RV; B: A diverging pattern of activation, initially broad, but subsequently branching as it progresses through the scar; C: Reverse centripetal pattern with outside activation progressing inward with wavefront collision in the center of the scar. Adapted from Haqqani et al[18] with permission.
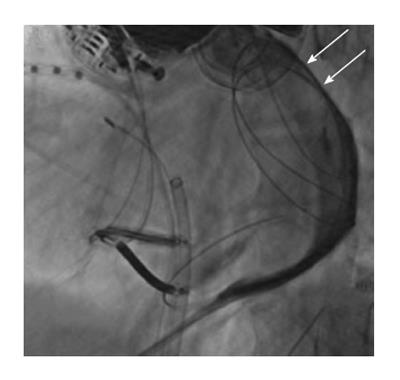
Figure 8 Fluoroscopic image in the left anterior oblique projection showing distribution of contrast restricted by pericardial compartmentalization from prior epicardial mapping and ablation.
In this particular case, a deflectable catheter with a steerable sheath was not able to disrupt the adhesions and a more anterior epicardial access was required to bypass the area of compartmentalization to target the area of interest. Adapted from Tschabrunn et al[33].
- Citation: Tschabrunn CM, Marchlinski FE. Ventricular tachycardia mapping and ablation in arrhythmogenic right ventricular cardiomyopathy/dysplasia: Lessons Learned. World J Cardiol 2014; 6(9): 959-967
- URL: https://www.wjgnet.com/1949-8462/full/v6/i9/959.htm
- DOI: https://dx.doi.org/10.4330/wjc.v6.i9.959


