Copyright
©2014 Baishideng Publishing Group Inc.
World J Cardiol. Sep 26, 2014; 6(9): 916-923
Published online Sep 26, 2014. doi: 10.4330/wjc.v6.i9.916
Published online Sep 26, 2014. doi: 10.4330/wjc.v6.i9.916
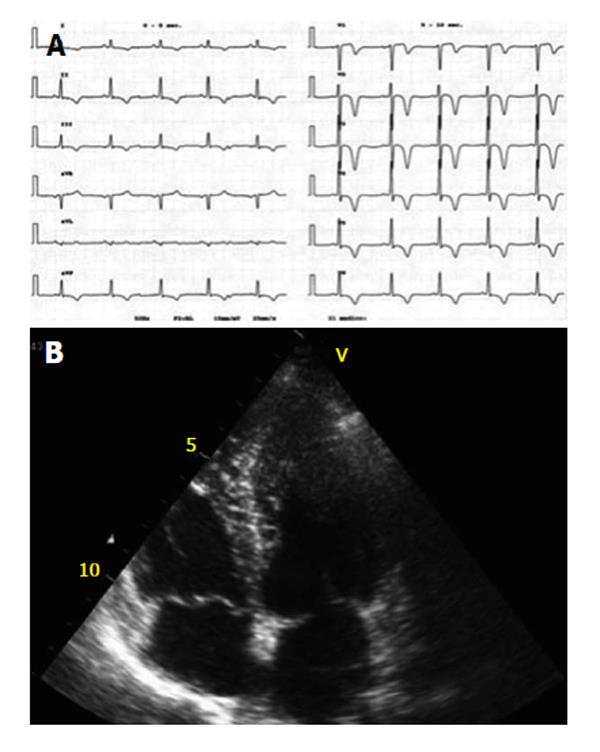
Figure 1 On transthoracic echocardiography, apical hypertrophic cardiomyopathy is defined as an absolute apical thickness of more than 15 mm with a ratio of apical to basal left ventricular wall thickness of more than 1.
3. A: 12-lead electrocardiogram with increased in QRS voltage and deep T-wave inversion in the precordial leads; B: Transthoracic echocardiography 4-chambers view showing asymmetrical left ventricular apical thickening with a spade shaped left ventricle configuration.
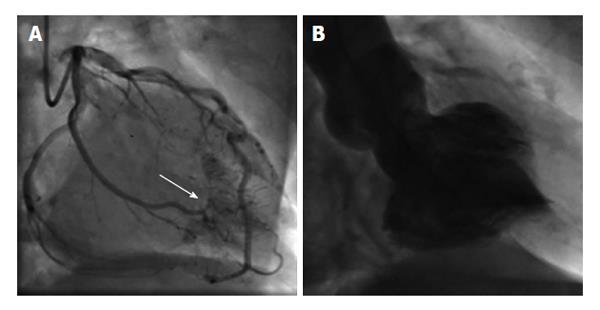
Figure 2 Angiography pictures.
A: Coronary angiography showing normal epicardial coronary arteries. Please note the presence of multiple coronary artery-left ventricular microfistulae (white arrow); B: Left ventricular angiography showing the characteristic diastolic “ace-of spade” sign.
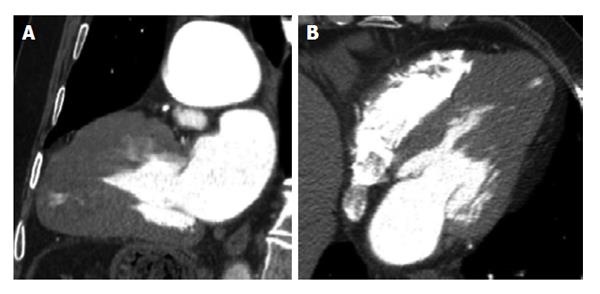
Figure 3 Multidetector computed tomography imaging: Long axis view (A) and axial scans at the level of the left ventricle (B) showing apical hypertrophy with cavity obliteration and a sequestered small left ventricle cavity.
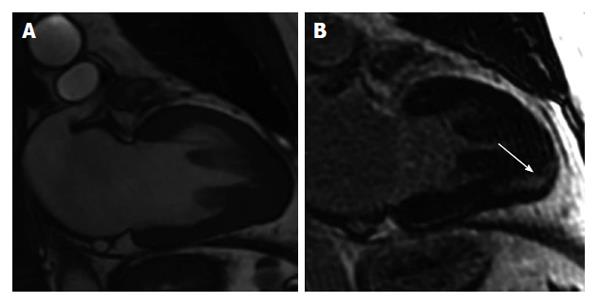
Figure 4 Cardiovascular magnetic resonance imaging.
Long axis view (A) of the left ventricle showing apical regional hypertrophy; long axis view 10 min after Gadolinium injection; B: An abnormal hyper-enhancement of the apical segment is visible (white arrow).
- Citation: Parisi R, Mirabella F, Secco GG, Fattori R. Multimodality imaging in apical hypertrophic cardiomyopathy. World J Cardiol 2014; 6(9): 916-923
- URL: https://www.wjgnet.com/1949-8462/full/v6/i9/916.htm
- DOI: https://dx.doi.org/10.4330/wjc.v6.i9.916


